1 minute read
Time vs. displacements plots from time history analysis
from IRJET- Comparative Analysis of Irregular G+11 Storied RC Building with & without Shear Walls at Diff
Volume: 07 Issue: 11 | Nov 2020 www.irjet.net p-ISSN: 2395-0072
For the Time history function, koyna earthquake ground motion accelerogram data has been taken. The data consists of 1001 points of acceleration data with a time interval of 0.02 sec between each data point and has duration of 20 seconds. The below fig 7 shows the scaled representation of the data plot function with time on X-axis and acceleration on y-axis which has been used for analysis.
Advertisement
Fig 6. Koyna Accelerogram (Acceleration vs. Time graph)
For the response spectrum, the parameters which are taken for the earthquake load case, same parameters are considered for the development of response function.
4. RESULTS AND DISCUSSIONS
We will be discussing the results obtained from different analysis as mentioned in the previouschapters. From both the software's, we got max Storey displacements for the critical load case, modal time periods and frequencies for all the three models, max shears and moments in a typical column for a critical load case, mode shapes time history plotfunctions, max base shear and moments at supports for response spectrum load case, and concrete design outputs for all models in both the software's.
4.1 Storey Displacements
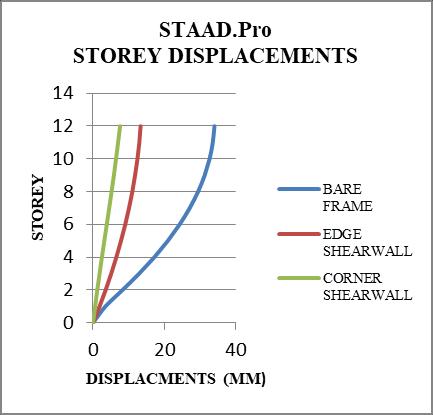
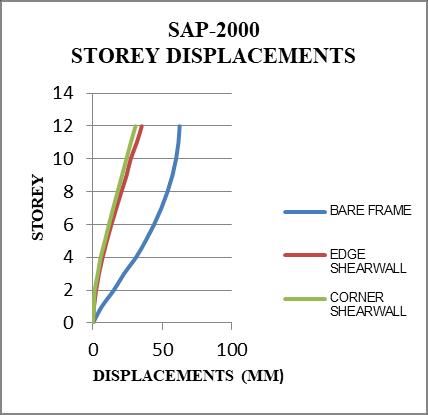
Fig 7. Storey displacementsinSTAAD.Pro Fig 8. Storey displacementsinSAP-2000
From the above two figures, it is observed that the displacements are maximum in the models which are not provided with shear walls. The displacements of models provided with shear walls are minimum. When compared to both the software's, the displacements which are occurring in the SAP-2000 are higher than the STAAD.Pro software. In STAAD.Pro the displacements are less because of the increased size of columns which are done in order to pass the structure for concrete design.

