2 minute read
Max moment in the critical column of each Storey
from IRJET- Comparative Analysis of Irregular G+11 Storied RC Building with & without Shear Walls at Diff
Volume: 07 Issue: 11 | Nov 2020 www.irjet.net p-ISSN: 2395-0072
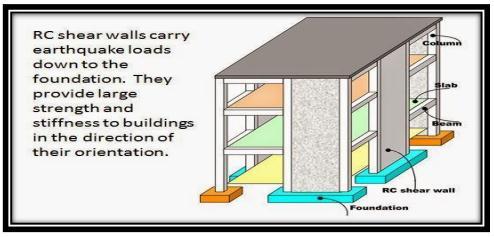
reinforcement detailing of walls is relatively straight-forward and therefore easily implemented at site. Shear walls are efficient, both in terms of construction cost and effectiveness in minimizing earthquake damage in structural and nonstructural elements.
Advertisement
1.1 Objective of the Study
• To study behavior of RC building (G+11) with and without shear walls at different locations like edges and corners of building. • To study the behavior of G+11 storied RC building situated in earthquake zone III using equivalent lateral force analysis, modal analysis, time history analysis and response spectrum analysis. • To measure the shear force and bending moment of these structures at numerous levels, relative to ground displacements in horizontal direction in both the STAAD.PRO & SAP-2000 software’s. • The study on Dynamic analysis discloses an effort to see the elemental natural frequency of various building’s victimization Matrix methodology based mostly software packages, STAAD and SAP.
1.2 Methodology
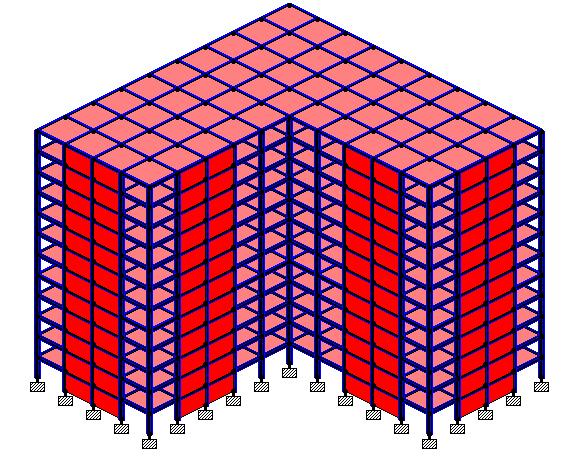
For this study three models having the same plan configuration are taken with varying locations of shear walls in the model, these are modelled in two software’s using STAAD.Pro and SAP-2000. Initially a bare frame model is developed and subjected to different load conditions and load combinations. Concrete design for bare frame models is done in both software’s. The sections are finalised by using trails and error method, most economical sections are developed using these software’s keeping the type of materials as constant in both software’s. Fig.3 displays the flow chart of the models which are developed for this study.
Fig.3 Model development flow chart
2. ANALYSIS & RESULTS
For all these models EQUIVALENT LATERAL FORCE analysis, MODAL analysis, TIME HISTORY and RESPONSE SPECTRUM analysis has been carried out. The type of time history analysis is direct nonlinear time history analysis, also known as Fast Nonlinear or FNA analysis. These analyses are performed with few limitations in both software’s. By performing, following results are obtained, noted down & compared. 1. Max Storey displacements. 2. Max moment in the critical column of each Storey. 3. Max shear in the critical column of each Storey. 4. Mode shapes. 5. Time periods and frequencies. 6. Time vs. displacements plots from time history analysis. 7. Max base shears and moments at base from response spectrum analysis.
For the above analysis, the basic versions of STAAD.PRO and SAP-2000 are used, the following analysis are performed using individual software’s.


