International Research Journal of Engineering and Technology (IRJET) Volume: 06 Issue: 06 | June 2019
e-ISSN: 2395-0056 p-ISSN: 2395-0072
www.irjet.net
Segregation of Machines According to the Noise Emitted by Different Mechanical Methods by Hierarchical Clustering Method Pintu Pal1, Amitava Kar1, Debapriya Goswami2, Dashmeet Kaur2 1Department
of Computer Application, Asansol Engineering College, Asansol-713305, West Bengal, India. of MCA, Department of Computer Application, Asansol Engineering College, Asansol-713305, West Bengal, India. ---------------------------------------------------------------------------***--------------------------------------------------------------------------2Student
Abstract:- The main motivation of this work deals with the hearing system the most negative effects are caused by noise exposure and this may cause permanent deafness. This effect has very important influence on workers’ health, so it is necessary to develop mathematical models and identification of similar noise producing machines. In this work a study of noise, emitted from different press machines of a press shop in West Bengal have been discussed. Different noise parameters such as LAeq (equivalent continuous Aweighted sound level), LAE (sound exposure level), LAV (average sound level) and TWA (Time weighted average level) are taken by a precision noise dosimeter (Model4444). For this Johnson’s Algorithm of Hierarchical clustering method is applied. Clustering is a popular data mining technique for partitioning a dataset into a set of clusters (i.e. segmentation). Hierarchical Clustering is a graph based algorithm that calculates the Euclidean distance of the different machines in terms of noise exposure parameters - LAeq (equivalent continuous A-weighted sound level), LAE (sound exposure level), LAV (average sound level) and TWA (Time weighted average level). It forms the distance matrix. The matrix is then reduced step by step until all the machines are clustered. Then it constructs the dendrogram i.e. graphical representation of the hierarchical clustering thus formed. The dendrogram forms one cluster containing all the machines at some point of distance. The dendrogram is then cut following a threshold value that is set earlier. It leads to the segregation of machines into clusters. Johnson’s algorithm has two components – Singlelink and Complete-link. In this paper, we have considered both the components leading to two different formations of clusters.
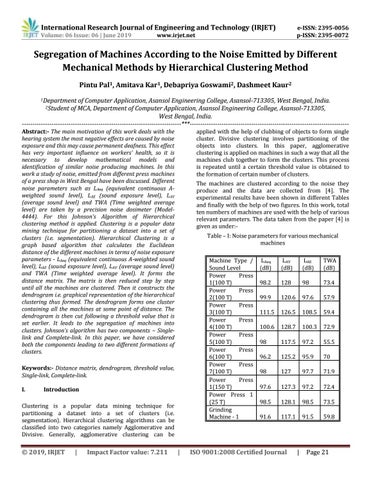
applied with the help of clubbing of objects to form single cluster. Divisive clustering involves partitioning of the objects into clusters. In this paper, agglomerative clustering is applied on machines in such a way that all the machines club together to form the clusters. This process is repeated until a certain threshold value is obtained to the formation of certain number of clusters. The machines are clustered according to the noise they produce and the data are collected from [4]. The experimental results have been shown in different Tables and finally with the help of two figures. In this work, total ten numbers of machines are used with the help of various relevant parameters. The data taken from the paper [4] is given as under:Table – I: Noise parameters for various mechanical machines Machine Type / Sound Level Power Press 1(100 T) Power Press 2(100 T) Power Press 3(100 T) Power Press 4(100 T) Power Press 5(100 T) Power Press 6(100 T) Power Press 7(100 T) Power Press 1(150 T) Power Press 1 (25 T) Grinding Machine - 1
Keywords:- Distance matrix, dendrogram, threshold value, Single-link, Complete-link. I.
Introduction
Clustering is a popular data mining technique for partitioning a dataset into a set of clusters (i.e. segmentation). Hierarchical clustering algorithms can be classified into two categories namely Agglomerative and Divisive. Generally, agglomerative clustering can be
© 2019, IRJET
|
Impact Factor value: 7.211
|
LAeq (dB)
LAV (dB)
LAE (dB)
TWA (dB)
98.2
128
98
73.4
99.9
120.6
97.6
57.9
111.5
126.5
108.5
59.4
100.6
128.7
100.3
72.9
98
117.5
97.2
55.5
96.2
125.2
95.9
70
98
127
97.7
71.9
97.6
127.3
97.2
72.4
98.5
128.1
98.5
73.5
91.6
117.1
91.5
59.8
ISO 9001:2008 Certified Journal
|
Page 21