International Research Journal of Engineering and Technology (IRJET)
e-ISSN: 2395-0056
Volume: 06 Issue: 05 | May 2019
p-ISSN: 2395-0072
www.irjet.net
PERFORMANCE BASED PUSHOVER ANALYSIS, CYCLIC LOADING, DETERIORATION EFFECT IN RC MOMENT FRAMES Afna P.S M Tech, Structural Engineering and Construction Management, Indira Gandhi Institute of Engineering and Technology, Nellikuzhi, Kerala, India ---------------------------------------------------------------------***--------------------------------------------------------------------Abstract - Pushover is a static –nonlinear analysis method where a structure is subjected to gravity loading and monotonic displacement controlled lateral load pattern which continuously increases through elastic and inelastic behaviour until an ultimate condition is reached. As the name states “push over”, push the building you reach its maximum capacity to deform. It helps in understanding the deformation and cracking of a structure in case of earthquake and gives you a kind of fair understanding of deformation of building and formation of plastic hinges in the structure. In this project I would like to analyse a multistory RC buildings using different bracing systems by using Etabs software. Push over analysis gives pushover curve which consist of capacity spectrum, demand spectrum, and performance point. It shows the performance point if the building
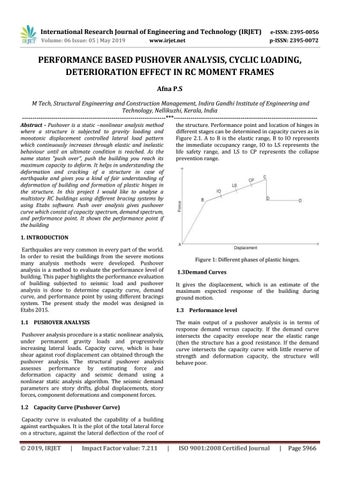
the structure. Performance point and location of hinges in different stages can be determined in capacity curves as in Figure 2.1. A to B is the elastic range, B to IO represents the immediate occupancy range, IO to LS represents the life safety range, and LS to CP represents the collapse prevention range.
1. INTRODUCTION Earthquakes are very common in every part of the world. In order to resist the buildings from the severe motions many analysis methods were developed. Pushover analysis is a method to evaluate the performance level of building. This paper highlights the performance evaluation of building subjected to seismic load and pushover analysis is done to determine capacity curve, demand curve, and performance point by using different bracings system. The present study the model was designed in Etabs 2015.
Figure 1: Different phases of plastic hinges. 1.3Demand Curves It gives the displacement, which is an estimate of the maximum expected response of the building during ground motion. 1.3 Performance level
1.1 PUSHOVER ANALYSIS
The main output of a pushover analysis is in terms of response demand versus capacity. If the demand curve intersects the capacity envelope near the elastic range (then the structure has a good resistance. If the demand curve intersects the capacity curve with little reserve of strength and deformation capacity, the structure will behave poor.
Pushover analysis procedure is a static nonlinear analysis, under permanent gravity loads and progressively increasing lateral loads. Capacity curve, which is base shear against roof displacement can obtained through the pushover analysis. The structural pushover analysis assesses performance by estimating force and deformation capacity and seismic demand using a nonlinear static analysis algorithm. The seismic demand parameters are story drifts, global displacements, story forces, component deformations and component forces. 1.2 Capacity Curve (Pushover Curve) Capacity curve is evaluated the capability of a building against earthquakes. It is the plot of the total lateral force on a structure, against the lateral deflection of the roof of
© 2019, IRJET
|
Impact Factor value: 7.211
|
ISO 9001:2008 Certified Journal
|
Page 5966