International Research Journal of Engineering and Technology (IRJET)
e-ISSN: 2395-0056
Volume: 06 Issue: 04 | Apr 2019
p-ISSN: 2395-0072
www.irjet.net
Flash Reduction In Pressure Die Casting Using Taguchi’s DOE Shubham G. Satpute1, Shashank B. Pandhare2, Arun K. Verma3, Sameer D. Walimbe4, Pravin E. Ingle5, Harshal J. Sutar6 1Student
& Sukewadi, Sangamner, & Yeola, Nashik, 3Student & Akurdi, Pune 4Student & Pimpri, Pune
2Student
5Professor,
Dept. of Mechanical Engineering, Dr. D. Y. Patil Institute of Technology, Pimpri, Maharshtra, India 6Senior Engineer, Dept. of Manufacturing Engineering, Sigma Electric Mfg. Corp., Chakan, Maharshtra, India ---------------------------------------------------------------***---------------------------------------------------------------productivity of various company-wide activities the quality Abstract - The prime objective of today's manufacturing
of design can be improved by improving the quality and reducing the cost. The activities which are concerned with quality include quality of product planning, product design and process design. Taguchi’s parameter design approach can reduce number of experiments to optimize design for performance, quality and cost. Two major tools used in robust design are Signal to Noise(S/N) ratio and orthogonal array (OA). S/N ratio measures quality with emphasis on variation, and OA accommodates many design factors simultaneously. Taguchi method offers the quality of product is measured by quality characteristics such as: nominal is the best, smaller is better and larger is better.
industries is to produce low cost, high quality products in minimum time. Taguchi’s parameter design is a powerful tool for robust design and it offers a simple and systematic approach to optimize a design for performance, quality and cost. However, the key element for achieving high quality is Design of Experiments (DOE). The present work analyses different parameters of manufacturing processes to minimize the defects. With optimization of controllable parameter we can achieve good surface finish with required tolerances. Moreover, by selection of optimum process parameters defects are minimized. The effects of selected process parameters on defects and subsequent setting of parameters with the levels have been accomplished by Taguchi’s parameter design approach. The experiments have been performed as per the combination of levels of different process parameters suggested by orthogonal array [2]. Analyses of variance is been performed for mean and signal to noise ratio to estimate the percent contribution of different process parameters.
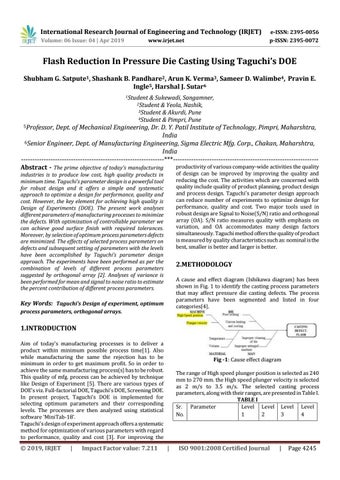
2.METHODOLOGY A cause and effect diagram (Ishikawa diagram) has been shown in Fig. 1 to identify the casting process parameters that may affect pressure die casting defects. The process parameters have been segmented and listed in four categories[4].
Key Words: Taguchi’s Design of experiment, optimum process parameters, orthogonal arrays.
1.INTRODUCTION Aim of today’s manufacturing processes is to deliver a product within minimum possible process time[1]. Also while manufacturing the same the rejection has to be minimum in order to get maximum profit. So in order to achieve the same manufacturing process(s) has to be robust. This quality of mfg. process can be achieved by technique like Design of Experiment [5]. There are various types of DOE’s viz. Full-factorial DOE, Taguchi’s DOE, Screening DOE. In present project, Taguchi’s DOE is implemented for selecting optimum parameters and their corresponding levels. The processes are then analyzed using statistical software ‘MiniTab-18’. Taguchi’s design of experiment approach offers a systematic method for optimization of various parameters with regard to performance, quality and cost [3]. For improving the
© 2019, IRJET
|
Impact Factor value: 7.211
Fig -1: Cause effect diagram The range of High speed plunger position is selected as 240 mm to 270 mm. the High speed plunger velocity is selected as 2 m/s to 3.5 m/s. The selected casting process parameters, along with their ranges, are presented in Table I. TABLE I Sr. Parameter Level Level Level Level No. 1 2 3 4
|
ISO 9001:2008 Certified Journal
|
Page 4245