International Research Journal of Engineering and Technology (IRJET)
e-ISSN: 2395-0056
Volume: 06 Issue: 04 | Apr 2019
p-ISSN: 2395-0072
www.irjet.net
Minning Frequent Patterns, Associations and Correlations Aravind Chowdary1, Savya Chamarti2, A Likith Reddy3, Yavapuram Mahesh Babu4 , K Radha5 1,2,3,4III-B.TECH-CSE,GITAM
UNIVERSITY, Rudraram, Hyderabad, Telangana Professor, CSE, GITAM UNIVERSITY, Rudraram, Hyderabad, Telangana, India -----------------------------------------------------------------------***-------------------------------------------------------------------5 Asst
Abstract - In this paper, we will learn how to mine frequent patterns, association rules, and correlation rules when working with R programs. Then, we will evaluate all these methods with benchmark data to determine the interestingness of the frequent patterns and rules.
common. To summarize them all, the market basket model is suggested as the most typical example to be researched [1]. The basket is also known as the transaction set; this contains the itemsets that are sets of items belonging to same itemset.
Key Words: Correlation Rule, Frequent Patterns, bench mark data. 1. INTRODUCTION Frequent patterns: Frequent patterns are the ones that often occur in the source dataset. The dataset types for frequent pattern mining can be itemset, subsequence, or substructure. These three frequent patterns i.
Frequent itemset
ii.
Frequent subsequence
iii.
Frequent substructures
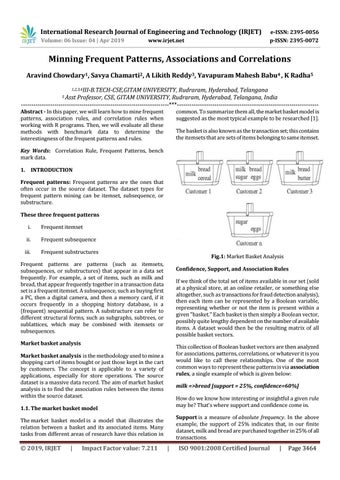
Fig.1: Market Basket Analysis
Frequent patterns are patterns (such as itemsets, subsequences, or substructures) that appear in a data set frequently. For example, a set of items, such as milk and bread, that appear frequently together in a transaction data set is a frequent itemset. A subsequence, such as buying first a PC, then a digital camera, and then a memory card, if it occurs frequently in a shopping history database, is a (frequent) sequential pattern. A substructure can refer to different structural forms, such as subgraphs, subtrees, or sublattices, which may be combined with itemsets or subsequences.
Confidence, Support, and Association Rules If we think of the total set of items available in our set (sold at a physical store, at an online retailer, or something else altogether, such as transactions for fraud detection analysis), then each item can be represented by a Boolean variable, representing whether or not the item is present within a given "basket." Each basket is then simply a Boolean vector, possibly quite lengthy dependent on the number of available items. A dataset would then be the resulting matrix of all possible basket vectors.
Market basket analysis
This collection of Boolean basket vectors are then analyzed for associations, patterns, correlations, or whatever it is you would like to call these relationships. One of the most common ways to represent these patterns is via association rules, a single example of which is given below:
Market basket analysis is the methodology used to mine a shopping cart of items bought or just those kept in the cart by customers. The concept is applicable to a variety of applications, especially for store operations. The source dataset is a massive data record. The aim of market basket analysis is to find the association rules between the items within the source dataset.
milk =>bread [support = 25%, confidence=60%] How do we know how interesting or insightful a given rule may be? That's where support and confidence come in.
1.1. The market basket model
Support is a measure of absolute frequency. In the above example, the support of 25% indicates that, in our finite dataset, milk and bread are purchased together in 25% of all transactions.
The market basket model is a model that illustrates the relation between a basket and its associated items. Many tasks from different areas of research have this relation in
Š 2019, IRJET
|
Impact Factor value: 7.211
|
ISO 9001:2008 Certified Journal
|
Page 3464