International Research Journal of Engineering and Technology (IRJET)
e-ISSN: 2395-0056
Volume: 06 Issue: 12 | Dec 2019
p-ISSN: 2395-0072
www.irjet.net
Comparison of Solar Energy System Tools: A Case Study Mallikarjuna G D1, G.S. Sheshadri2 1Assistent
Professor, Department of Electrical and Electronics Engineering, Tontadarya College of Engineering, Gadag, Karnataka, India 2Professor, Department of Electrical and Electronics Engineering, Sri Siddartha Institute of Technology, Tumukuru, Karnataka, India ---------------------------------------------------------------------***---------------------------------------------------------------------Abstract - Alternate sources of energy used due to rapid increasing demand and change in climate. Solar energy has been used to generate electrical power due to clean source with wide acceptance and integrated in modern electric grids. Modeling and Simulation of solar power systems is done using MATLAB/Simulink Software. In this paper observation of characteristics of I-V and P-V output curve using both PVSYST_5 and Simulation tool under different Irradiance and temperature is similar. This study helps to consider MATLAB/Simulink Software for further research work.
G
Solar Irradiation (W/m2).
q
Electron Charge, 1.6*10-19 C.
Voc
Open circuit voltage (V).
n
Ideality factor of the diode, 1.3.
K
Boltzmann’s constant, 1.38*10-23J/K.
Eg0
Band gap energy semiconductor, 1.1eV.
Key Words: MATLAB/Simulink, PV Modeling, Irradiance, Solar cell.
Ns
Number of cells connected in series.
1. INTRODUCTION
Np
Number of PV modules connected in parallel.
Rs
Series resistance, 2.366 Ω.
Rsh
Shunt resistance, 1100Ω.
Nowadays there is a lot of climatic changes occurs in environment. Solar energy is clean and abundant available source for generation of power [1-3]. Utilization of this energy will reduce the weather polluting risk. Demand of power is increasing day by day. Photovoltaic energy will meet the demand. Performance characteristic of solar module is modeled using the basic equation [4-6].
of
the
2. METHODOLOGY 2.1. PV Module Modeling:
Many software are present to analyze the module under varying climatic conditions [7-8]. In this paper as a case study, author used PVSYST_5 software and MATLAB/Simulink Software to validate tool for research. Flow chart of Photo voltaic generation is explained by using equivalent solar cell circuit. Step by step modeling is done to get the required output and compared with PVsyst_5 software for validation. Paper show the performance characteristic of I-V and P-V curve for different Irradiance and temperature for both tools. Nomenclature Iph
Photo-current (A).
Isc
Short circuit current.
ki
Short circuit current of cell at 25oC and 1000 W/m2 , 0.003.
T
Operating Temperature (K).
Tn
Nominal Temperature, 298 K.
© 2019, IRJET
|
Impact Factor value: 7.34
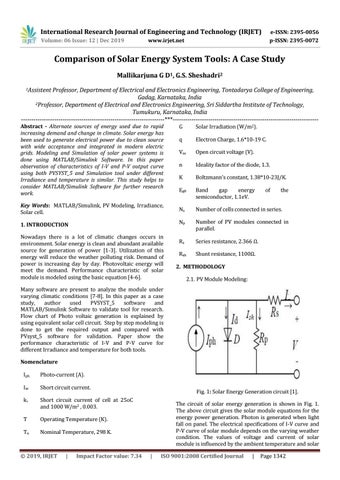
Fig. 1: Solar Energy Generation circuit [1]. The circuit of solar energy generation is shown in Fig. 1. The above circuit gives the solar module equations for the energy power generation. Photon is generated when light fall on panel. The electrical specifications of I-V curve and P-V curve of solar module depends on the varying weather condition. The values of voltage and current of solar module is influenced by the ambient temperature and solar |
ISO 9001:2008 Certified Journal
|
Page 1342