International Research Journal of Engineering and Technology (IRJET)
e-ISSN: 2395 -0056
Volume: 04 Issue: 05 | May -2017
p-ISSN: 2395-0072
www.irjet.net
ECG Signal Characterization and Correlation To Heart Abnormalities Keerthi G Reddy 1, Dr. P A Vijaya 2, Suhasini S 3 1PG
Student, 2Professor and Head, Department of Electronics and Communication, BNMIT, Bangalore, India 3Design Engineer, SenseSemi Technologies Pvt.Ltd, Bangalore, India ---------------------------------------------------------------------***---------------------------------------------------------------------
Abstract –ECG is one of the most important physiological
beats per minute (Bpm). The normal heart rate for normal person is in the range of 60 to 100 beats per minute, but this may change with age and sex. The characteristics of normal heart rhythm also called Normal Sinus Rhythm (NSR) any disorder in these parameters results in a pathological condition called Arrhythmia or dysrhythmia.
parameter that gives the correct assessment regarding the functioning of the heart. One cardiac cycle in an ECG signal consists of the PQRST waves. This paper presents the collection of ECG signal from Database, filtering and processing of ECG signal, feature extraction, detection of P, Q, R, S and T values of an ECG signal and the heart rate. One of the important cardiovascular disease is arrhythmia. By calculating the heart rate the different types of arrhythmia classes including Tachycardia and Bradycardia are determined. MATLAB is used for the implementation & ECG signals were taken from MIT-BIH Database. The extracted parameters are compared with the standard morphological values of ECG signal and abnormality is classified.
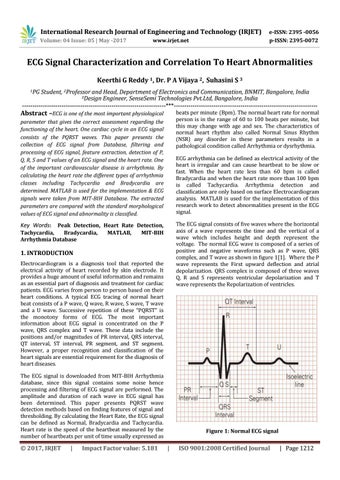
ECG arrhythmia can be defined as electrical activity of the heart is irregular and can cause heartbeat to be slow or fast. When the heart rate less than 60 bpm is called Bradycardia and when the heart rate more than 100 bpm is called Tachycardia. Arrhythmia detection and classification are only based on surface Electrocardiogram analysis. MATLAB is used for the implementation of this research work to detect abnormalities present in the ECG signal. The ECG signal consists of five waves where the horizontal axis of a wave represents the time and the vertical of a wave which includes height and depth represent the voltage. The normal ECG wave is composed of a series of positive and negative waveforms such as P wave, QRS complex, and T wave as shown in figure 1[1]. Where the P wave represents the First upward deflection and atrial depolarization. QRS complex is composed of three waves Q, R and S represents ventricular depolarization and T wave represents the Repolarization of ventricles.
Key Words:
Peak Detection, Heart Rate Detection, Tachycardia, Bradycardia, MATLAB, MIT-BIH Arrhythmia Database
1. INTRODUCTION Electrocardiogram is a diagnosis tool that reported the electrical activity of heart recorded by skin electrode. It provides a huge amount of useful information and remains as an essential part of diagnosis and treatment for cardiac patients. ECG varies from person to person based on their heart conditions. A typical ECG tracing of normal heart beat consists of a P wave, Q wave, R wave, S wave, T wave and a U wave. Successive repetition of these “PQRST” is the monotony forms of ECG. The most important information about ECG signal is concentrated on the P wave, QRS complex and T wave. These data include the positions and/or magnitudes of PR interval, QRS interval, QT interval, ST interval, PR segment, and ST segment. However, a proper recognition and classification of the heart signals are essential requirement for the diagnosis of heart diseases. The ECG signal is downloaded from MIT-BIH Arrhythmia database, since this signal contains some noise hence processing and filtering of ECG signal are performed. The amplitude and duration of each wave in ECG signal has been determined. This paper presents PQRST wave detection methods based on finding features of signal and thresholding. By calculating the Heart Rate, the ECG signal can be defined as Normal, Bradycardia and Tachycardia. Heart rate is the speed of the heartbeat measured by the number of heartbeats per unit of time usually expressed as
© 2017, IRJET
|
Impact Factor value: 5.181
Figure 1: Normal ECG signal
|
ISO 9001:2008 Certified Journal
| Page 1212