International Research Journal of Engineering and Technology (IRJET)
e-ISSN: 2395 -0056
Volume: 04 Issue: 04 | Apr -2017
p-ISSN: 2395-0072
www.irjet.net
Survey on Data Analysis Using Correlation Methods Katru Akhila1, Chilamakuru Ravalipriya2, Bonda Himaja3 , Deepa N4 1School
of information technology and engineering, Vit university, Vellore, Tamilnadu, India of information technology and engineering, Vit university, Vellore, Tamilnadu, India 3School of information technology and engineering, Vit university, Vellore, Tamilnadu, India 4Asst.prof, school of information technology and engineering, Vit university, Vellore, Tamilnadu, India 2School
---------------------------------------------------------------------***---------------------------------------------------------------------
Abstract - In this paper, we are going to use the correlation
methods for analysis of data. The correlation methods are Pearson and Spearman methods. These are mainly used in the software process to identify the complexity between the various modules in the software. For calculating the correlation between the modules we need to collect the data. For obtaining the data we use the code analyzer tool. It is an open source tool in which we able to analyze the metrics of an application at a particular time. The main advantage of this tool is its support the various languages.
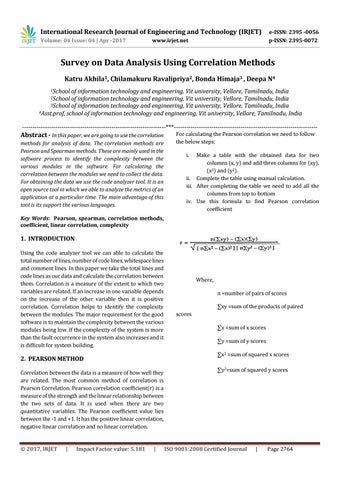
For calculating the Pearson correlation we need to follow the below steps: i.
Make a table with the obtained data for two columns (x, y) and add three columns for (xy), (x2) and (y2). ii. Complete the table using manual calculation. iii. After completing the table we need to add all the columns from top to bottom iv. Use this formula to find Pearson correlation coefficient
Key Words: Pearson, spearman, correlation methods, coefficient, linear correlation, complexity
1. INTRODUCTION Using the code analyzer tool we can able to calculate the total number of lines, number of code lines, whitespace lines and comment lines. In this paper we take the total lines and code lines as our data and calculate the correlation between them. Correlation is a measure of the extent to which two variables are related. If an increase in one variable depends on the increase of the other variable then it is positive correlation. Correlation helps to identify the complexity between the modules. The major requirement for the good software is to maintain the complexity between the various modules being low. If the complexity of the system is more than the fault occurrence in the system also increases and it is difficult for system building.
Correlation between the data is a measure of how well they are related. The most common method of correlation is Pearson Correlation. Pearson correlation coefficient(r) is a measure of the strength and the linear relationship between the two sets of data. It is used when there are two quantitative variables. The Pearson coefficient value lies between the -1 and +1. It has the positive linear correlation, negative linear correlation and no linear correlation.
|
Impact Factor value: 5.181
n =number of pairs of scores ∑xy =sum of the products of paired scores ∑x =sum of x scores ∑y =sum of y scores ∑x2 =sum of squared x scores
2. PEARSON METHOD
© 2017, IRJET
Where,
|
∑y2=sum of squared y scores
ISO 9001:2008 Certified Journal
|
Page 2764