International Research Journal of Engineering and Technology (IRJET) e-ISSN: 2395 -0056 Volume: 03 Issue: 07 | July-2016
www.irjet.net
p-ISSN: 2395-0072
ECG SIGNAL DENOISING USING UWT AND FEATURES EXTRACTION USING LABVIEW Priyanka Choudhary1, Ramavtar Jaswal2
1P.G
Scholar, Electrical Engineering, UIET, Kurukshetra University, Haryana, INDIA Pinku064@gmail.com 2Assistant Professor, Electrical Engineering, UIET Kurukshetra University Haryana, INDIA Ramavtar.jaswal@gmail.com ---------------------------------------------------------------------***---------------------------------------------------------------------
Abstract - An Electrocardiogram (ECG) is a biological
signal shows any deviation from the normal parameters of ECG it will indicate the disease related to it [3,4].
signal and non-invasive method to record the electrical activity of the heart by electrodes placed on the surface of human body. The raw ECG data are taken from MIT-BIH Arrhythmia database. In this paper firstly denoising can be done by using WA Detrend and Undecimated Wavelet Transform (UWT), which has the better capacity to reduce noise and better peak detection and then features extracted from the denoised ECG signal by using ECG Features Extractor VI, which are implemented with Laboratory Virtual Instrumentation Engineering Workbench (LABVIEW) platform.
Table- I Normal ECG Parameters
Key Words: ECG signal, Features extraction, LABVIEW, UWT, WA detrend, WA multiscale peak detection
Phase
Duration
Amplitude
P Wave
0.06-0.11
<0.25
PR Interval
0.12-0.20
PR Segment
0.08
QRS Complex
<0.12
ST Segment
0.12
QT Interval
0.36-0.44
T Wave
0.16
0.8-I. 2
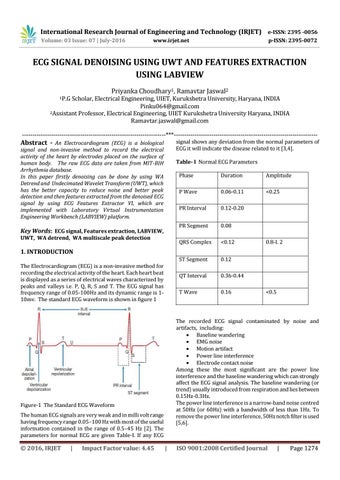
1. INTRODUCTION The Electrocardiogram (ECG) is a non-invasive method for recording the electrical activity of the heart. Each heart beat is displayed as a series of electrical waves characterized by peaks and valleys i.e. P, Q, R, S and T. The ECG signal has frequency range of 0.05-100Hz and its dynamic range is 110mv. The standard ECG waveform is shown in figure 1
The recorded ECG signal contaminated by noise and artifacts, including: Baseline wandering EMG noise Motion artifact Power line interference Electrode contact noise Among these the most significant are the power line interference and the baseline wandering which can strongly affect the ECG signal analysis. The baseline wandering (or trend) usually introduced from respiration and lies between 0.15Hz-0.3Hz. The power line interference is a narrow-band noise centred at 50Hz (or 60Hz) with a bandwidth of less than 1Hz. To remove the power line interference, 50Hz notch filter is used [5,6].
Figure-1 The Standard ECG Waveform The human ECG signals are very weak and in milli volt range having frequency range 0.05–100 Hz with most of the useful information contained in the range of 0.5–45 Hz [2]. The parameters for normal ECG are given Table-I. If any ECG
© 2016, IRJET
|
Impact Factor value: 4.45
<0.5
|
ISO 9001:2008 Certified Journal
|
Page 1274