International Research Journal of Engineering and Technology (IRJET)
e-ISSN: 2395 -0056
Volume: 03 Issue: 02 | Feb-2016
p-ISSN: 2395-0072
www.irjet.net
Data Visualization and Communication by Big Data T. Gnana Prakash1 1Assistant
Professor, CSE Department, VNR VJIET, Hyderabad, TS, India
---------------------------------------------------------------------***---------------------------------------------------------------------
Abstract - Data visualization is viewed by many disciplines
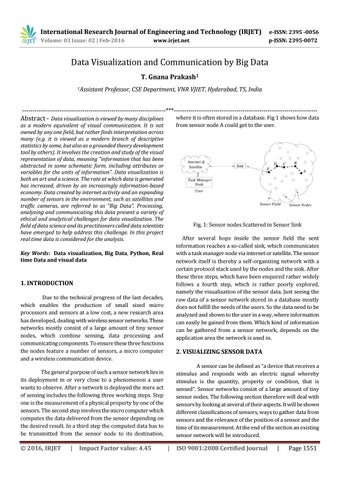
where it is often stored in a database. Fig 1 shows how data from sensor node A could get to the user.
as a modern equivalent of visual communication. It is not owned by any one field, but rather finds interpretation across many (e.g. it is viewed as a modern branch of descriptive statistics by some, but also as a grounded theory development tool by others). It involves the creation and study of the visual representation of data, meaning “information that has been abstracted in some schematic form, including attributes or variables for the units of information”. Data visualization is both an art and a science. The rate at which data is generated has increased, driven by an increasingly information-based economy. Data created by internet activity and an expanding number of sensors in the environment, such as satellites and traffic cameras, are referred to as “Big Data”. Processing, analyzing and communicating this data present a variety of ethical and analytical challenges for data visualization. The field of data science and its practitioners called data scientists have emerged to help address this challenge. In this project real time data is considered for the analysis.
Fig. 1: Sensor nodes Scattered in Sensor Sink After several hops inside the sensor field the sent information reaches a so-called sink, which communicates with a task manager node via internet or satellite. The sensor network itself is thereby a self-organizing network with a certain protocol stack used by the nodes and the sink. After these three steps, which have been enquired rather widely follows a fourth step, which is rather poorly explored, namely the visualization of the sensor data. Just seeing the raw data of a sensor network stored in a database mostly does not fulfill the needs of the users. So the data need to be analyzed and shown to the user in a way, where information can easily be gained from them. Which kind of information can be gathered from a sensor network, depends on the application area the network is used in.
Key Words: Data visualization, Big Data, Python, Real time Data and visual data
1. INTRODUCTION Due to the technical progress of the last decades, which enables the production of small sized micro processors and sensors at a low cost, a new research area has developed, dealing with wireless sensor networks. These networks mostly consist of a large amount of tiny sensor nodes, which combine sensing, data processing and communicating components. To ensure these three functions the nodes feature a number of sensors, a micro computer and a wireless communication device.
2. VISUALIZING SENSOR DATA A sensor can be defined as “a device that receives a stimulus and responds with an electric signal whereby stimulus is the quantity, property or condition, that is sensed”. Sensor networks consist of a large amount of tiny sensor nodes. The following section therefore will deal with sensors by looking at several of their aspects. It will be shown different classifications of sensors, ways to gather data from sensors and the relevance of the position of a sensor and the time of its measurement. At the end of the section an existing sensor network will be introduced.
The general purpose of such a sensor network lies in its deployment in or very close to a phenomenon a user wants to observe. After a network is deployed the mere act of sensing includes the following three working steps. Step one is the measurement of a physical property by one of the sensors. The second step involves the micro computer which computes the data delivered from the sensor depending on the desired result. In a third step the computed data has to be transmitted from the sensor node to its destination,
© 2016, IRJET
|
Impact Factor value: 4.45
|
ISO 9001:2008 Certified Journal
|
Page 1551