
International Research Journal of Engineering and Technology (IRJET) e-ISSN: 2395-0056
Volume: 11 Issue: 05 | May 2024 www.irjet.net p-ISSN: 2395-0072

International Research Journal of Engineering and Technology (IRJET) e-ISSN: 2395-0056
Volume: 11 Issue: 05 | May 2024 www.irjet.net p-ISSN: 2395-0072
Jeevitha R 1 And Dr Rekha H B 2
1 Mtech Student, Department of Civil Engineering, University of Visvesvaraya Collage of Engineering, Bangalore, India
2Assosiate Professor, 1Department of Civil Engineering, University of Visvesvaraya Collage of Engineering, Bangalore, India ***
Abstract - Detailed descriptions and models of the affected metropolitan areas are used to calculate and anticipate the impacts of urbanization on the hydrological procedure as well as water resources. The Water & Soil Analysis (ArcSWAT) model was chosen to test its applicability in the water-scarce city of Mangaluru, India. The primary aim of this project is to find out the rainfall simulation in Mangaluru city and find the flood zone for the study. The catchment area of Mangaluru city is immeasurable. Therefore, a regionalization approach was adopted to estimate the basin outlet flow. Validation and calibration of the SUFI-2 algorithm for the flow process using SWATCUP2012 was performed monthly. The model has been evaluated along validated by comparing observed and simulated water fluxes from the outlet from 1991 to 2015 and 2015 to 2022, respectively. SWATCUP results show a good match among simulated along with observed flow. In summary, urban development can affect runoff, in the research area. Research shows that greater attention should be paid to flood prevention and management of water when planning future urban growth in the region.
Key Words: Urbanization, ArcSWAT, SWAT CUP, Calibration, Validation
1.INTRODUCTION
Urbanwatershedhydrologyorhydrologicalproceduresintheurbanizedwatersheds isoneofthevarioussub-branchesof hydrologicalsciencethathasbecomeclearlyimportantinrecentyears.AspertheWMO(WorldMeteorologicalOrganization), floodsarethethirdlargestcatastrophiceventinhistory.AccordingtotheFederalEmergencyManagementAgency(FEMA), floodingisdefinedasdrylandbeingcoveredbywater.
Urbanfloodingoccurswhensurfacerunoffexceedsthecapacityofmunicipalwatersystems(Nie,2014).Astheimpermeable surfaceincreasesduetourbandevelopmentandclimatechange,floodsalsoincrease.Theriskoffloodsisrisingbecauseofthe effectsofurbanizationaswellaschangesinclimate.Urbanclimateincreasesresultingfromchangesinlanduseinurbanareas haveanegativeimpactonurbanresidentsandinfrastructure.Impactsincludedestructionofhabitatsandvariationsinthe quality&quantityofprecipitation,leadingtoalterationsinwaterquality(Jacobson,2011).
Accordingtostatistics,since2009,overhalfofallpeopleonEarthhavemadethetransitiontocityliving,markingamilestone inhumanhistory.Furthermore,populationforecastsindicatethatby2030,growthandmigration,particularlyinlargecities and wealthy nations, would push the urban population to over 80% of the overall population. Population growth and urbanizationcauseenvironmentalimpactsandoftenaffectthesustainabilityofwaterresources(ErmiasSisay,2017).
Urbanfloodresearchhasbeenconductedworldwideformanyyearsandresultsinawiderangeofmathematicaltools,both freeandproprietary.Graphicaluserinterfaces(GUIs)havemadeitpossibleforprogramslikeSWAT,SWMM,HEC-RAS,HECHMS,MIKEFLOOD,etc.Urbanfloodmodellingsoftwaresuchashasalsobecomewidespread.Theoutputsthatcanbeproduced bysoftwarehavebecomeincreasinglyeasiertounderstand.GISsoftwaresuchasQGISandArcGISmakesiteasytocaptureand enterdatadirectlyintothemodel.(VinayAshokRangari,2020).
This study's main objective is to determine the rainfall-runoff simulation in Mangaluru city using ArcSWAT. SWAT, is a computer-friendlyhydrologicalmodelutilizedtosimulatetheflowofwaterinrivers.AninterfaceamongArcGISandtheSWAT frameworkhasbeenemployedrecently:ArcSWAT,athird-partysoftwareextensionforArcGIS.
2.1
MangaluruisthecapitalofDakshinaKannadadistrictandthemainportcityofKarnataka,knownasthegatewaytoKarnataka. Itisthefourthlargestcityinthestate.Itislocatedat12°52'latitudeand74°53'longitude.Thecityissituatedonthecountry’s
International Research Journal of Engineering and Technology (IRJET) e-ISSN: 2395-0056
Volume: 11 Issue: 05 | May 2024 www.irjet.net p-ISSN: 2395-0072
westcoast.ItbordersthestateofKeralatothesouth,Udupidistricttothenorth,BantwaltaluktotheeastandtheArabianSea tothewest.TheWesternGhatsspreadtothecityofMangaloreontheeasternside.Itisfoundinthebackwatersformedbythe GurupuraRiverandNetravatiRiver.ThetotalareaofMangaloredistrictis30,600hectares.Thecity'sjurisdictioncoversan areaof12,877hectares.
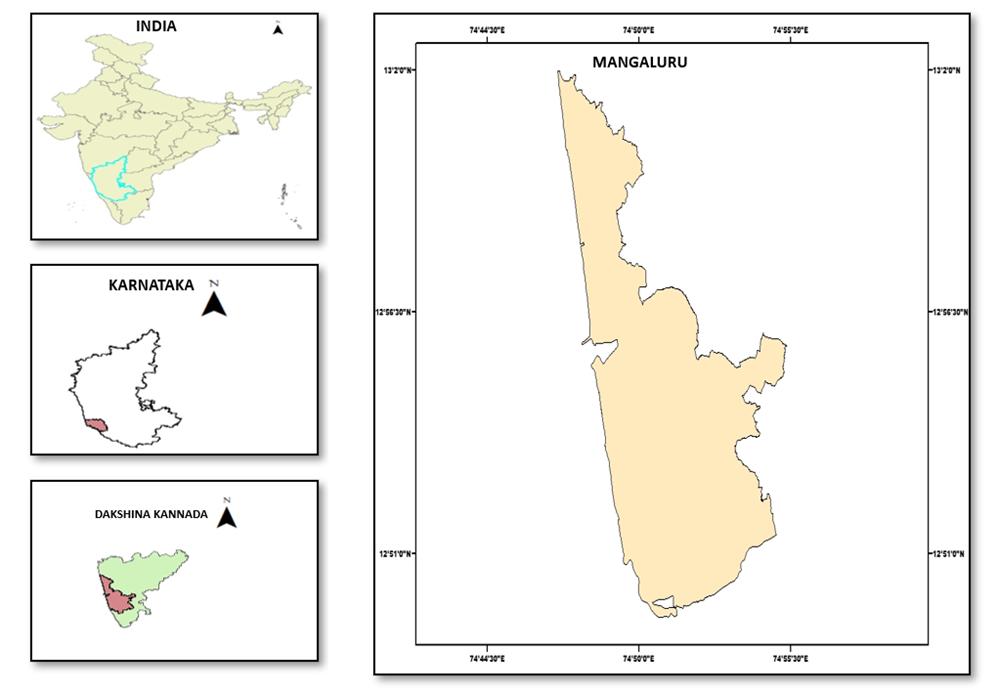
StudyArea
2.2 Data collection
a.Rainfalldata: For30years(1991–2022)isgatheredfromKarnatakaStateNaturalDisasterMonitoringCenter,Karnataka.
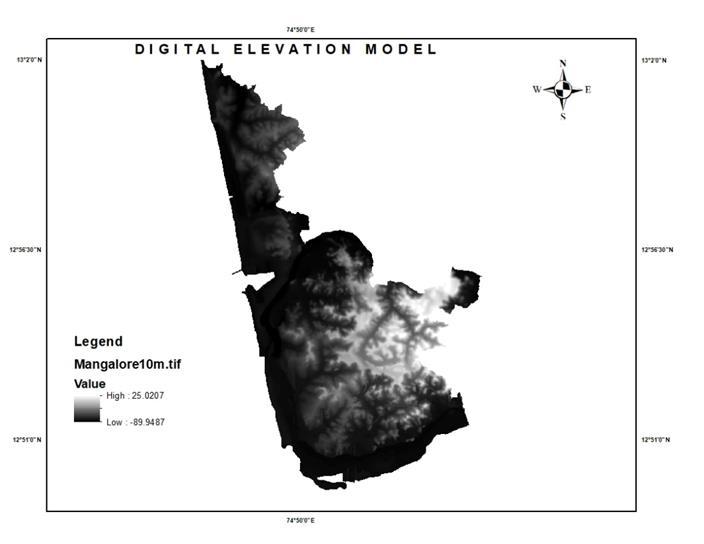
b.Imagedata:DEMisarasterfilecontainingunitsorarraysofpixelswithheight.TopographyhasbeenexplainedbyaDEM, whichexplainsthelocationelevationinanareaatspatialresolution.Forthisproject,DEMwith30mx30mresolutionhasbeen downloadedfromISROBhuvan,cartosat-1.Itwaspreparedforcoordinationpurposes(WGS1984UTMZone43N)andwas madeusingwaterresourcesinaGISenvironment.Thefig-2showstheDEMoftheMangaluru.
c.Land“use/cover(LULC):ThemapoflanduseisobtainedbytheprocessingofsatelliteLandsat8imageof2022whichhasa spatialresolutionof”30m.
d.Soildata:ThesoilhasbeenattainedinlandaswellassoilusesurveyofIndia.Whichwastothescaleof1:50,000.
International Research Journal of Engineering and Technology (IRJET) e-ISSN: 2395-0056
Volume: 11 Issue: 05 | May 2024 www.irjet.net p-ISSN: 2395-0072
Accordingto“Arnoldetal.(1998),theSWATmodelisalsotermedthethesoilandwaterassessmenttool,whichhasbeena semi-distributed watershed model with” an interface of GIS which utilizes the meteorological, land, and soil use data to calculate daily water balance as well as delineate stream networks as well as sub-basins using a DEM (“Digital Elevation Model”).TheSWATmodelusedinformationfromweather,land,andsoilusemaps,amongothersources,tosimulaterunoff volumealongwithsedimentproduction(Neitschet“al.2005;Haverkampetal.2005).Thehydrologicalcycleissimulatedby theSWATmodelbyutilizingthesubsequentwaterbalance”eqn1. where,
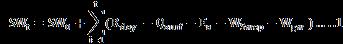
“SWt finalwatercontentin(mm)
Qsurf runoffamountonspecificdays in(mm)
Rday precipitationamountonspecificdaysin (mm)
Ea evapotranspiration amount on day in (mm)
Wgw return the amount of flow on a day in (mm)
Wsweep amount of water percolated into the vadosezonesonadayin(mm)”
Twotechniquesforforecastingextreme(excessive)precipitationaresuggestedbytheSWATmodel.TheSCScurvenumber approachisthefirstofthese,andtheGreenaswellasAmptpenetrationequationisthesecond(Arnoldetal.,2012).In1972,the USSoilConservationService(SCS)createdthecountcurve. Equation2usestheSCSapproachtocalculatetheoveralldailyrunoff depthordailyexcessrainfall(mm).
International Research Journal of Engineering and Technology (IRJET) e-ISSN: 2395-0056
Volume: 11 Issue: 05 | May 2024 www.irjet.net p-ISSN: 2395-0072

hasbeen predictedbyeqns where,

Qsurf “accumulatedrunofforrainfallexcess (mm)
Rday rainfalldepthfortheday(mm)
S retentionparameter(mm)”
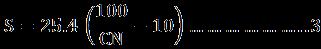
Theretentionparameterfluctuatesbothtemporallybecauseofthevariationsinsoilwatercontentandspatiallybecauseof variationsinlanduse,management,slope,andsoiltypes.Equation3definestheretentionparameter. Thiswillbecalculatedby:
Thestatisticalmodel'spredictionaccuracyismeasuredbythecoefficientofdetermination(R²).TheSDisusedtoillustratethe results.R2hasamax.valueof1andaminimumvalueof0.Itisthe percentageofvariancethatthemodelcanaccountfor. FindingoutwhethertheR2 ishighorlowcantypicallybedeterminedbyplottingalinearregressionprofile.R2indicateshow much“ofthevarianceinthecalculateddatathemodelcanaccountfor.AsperSanthietal.(2001)andVanLiewetal.(2003)”, valueshigherincomparisonto0.5aretypicallyregardedasacceptable.R2valuesrangefrom0 -1,withthegreatervalues depictingthesmallerchanges.
Thesizeofthevarianceoftheresidual,or"noise,"relatedtothevarianceofthemeasureddata,or"data,"isdeterminedutilizing theNSE(“Nash-Sutcliffeefficiency”)statistic(NashandSutcliffe,1970).Theobservedplotaswellasthesimulateddata'sfitto the1:1linehasbeendepictedbytheNSE.Equation4illustrateshowNSEis“calculated.

Inthiscase,nrepresentsthetotalnumberofobservations,Ymeanrepresents”theobserveddatamean,and,����O����representsthe ithobservationfortheconstituentsubjecttoevaluation.
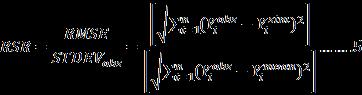
Accordingtoseveralstudies(Singhetal.,2004;ChuandShirmhammadi,2004;Vasquez-AmábileandEngel,2005),RMSEhas been among the most widely used statistical error measures. Guidelines for qualifying for a lower RMSE have only been publishedasanevaluationofvariousmodels,despitethewidespreadagreementthatthebetterthemodel,thelowertheRMSE (Singhetal.,2004).AmeasurementmodelnamedRMSE-basedstandarddeviation(RSR)hasbeenperformedinaccordance with the suggestions made by Singh et al. (2004). Using the observational standard deviation, RSR normalizes RMSE and accountsformeasurementerror.Equation5illustrateshowtocomputeRSR,whichistheproductofthemeasureddata's standarddeviationandRMSE.
AsperGuptaetal.(1999),percentagebias(PBIAS)quantifiestheaveragepropensityofsimulateddatatodifferfromobserved databyacertainamount.SmallervaluesofPBIASdepictedmoreaccuratesimulationmodels;0.0istheidealvalue.Positive outcomessuggestthatthemodelisbiasedtowardunderestimation,whereasnegativeoutcomessuggestthatthemodelis biasedtowardoverestimation(Guptaetal.,1999).TheequationisusedtocalculatePBIAS.wherePBIAS,givenasapercentage, isthedeviationofthedataunderevaluation.
International Research Journal of Engineering and Technology (IRJET) e-ISSN: 2395-0056
Volume: 11 Issue: 05 | May 2024 www.irjet.net p-ISSN: 2395-0072


Where, n -number of observations at the time of the period of simulation, - simulated flow value with the respected time -Observedflowdata

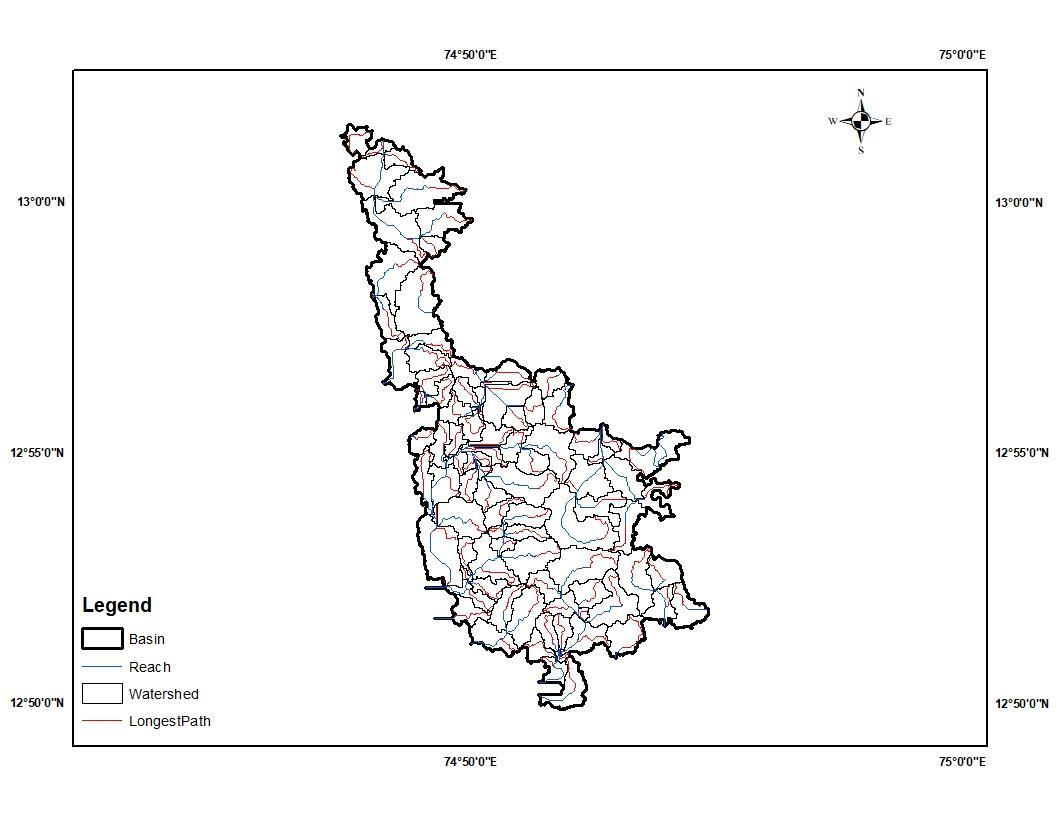
3.1 Watershed delineation
AutomaticwatershedidentificationusingArcSWAT,whichusesDEMstoperformdigitalterrainanalysis,calculateslopes,and streamlengths,andidentifywatershedboundariesandwaternetworksinMangalurucity.ThebasinofMangalurucityis dividedinto96sub-basinswith49outlets.Ascanbeseenfromthetableabove,sub-basinNo.1,sub-basinNo.64isthelargest sub-basinwithanareaof377.36hectares.72isthesmallestwithanareaof5.10hectares.Fig3depictsthewatershedofthe Mangalurucity.
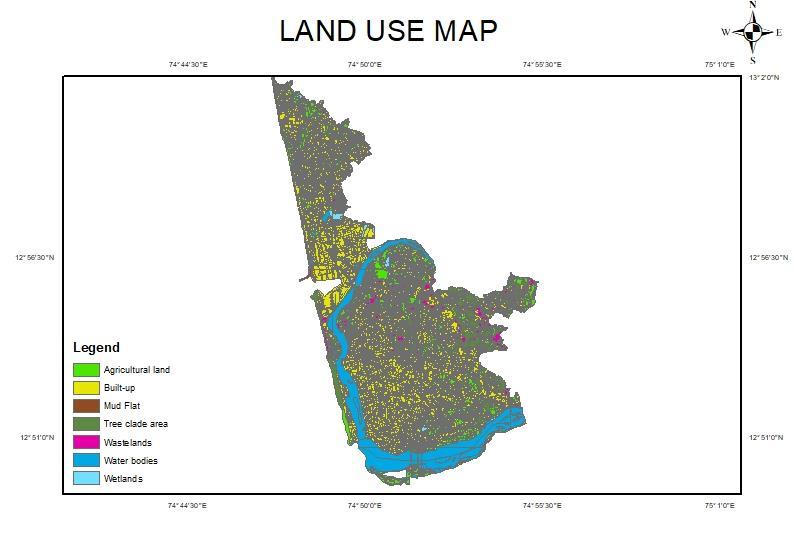
3.2 Land use and landcover
IntheHRUanalysisstep,dataonlanduseisutilizedasaseparateGISlayer(eithervectororraster)thathasbeenreclassified byutilizingArcSWAT.Wherethelanduseconsistsofbuilt-upareas,agriculturalland,mudflats,waterbodies,treecladeareas, wastelands, and wetlands. The area of each land and the percentage of area covered is mentioned in Table 1. Figure 4 representstheLULCofthecity.Hasthecityisdevelopingdaybyday,therateofurbanizationisalsogettingincreased,andthe percentageoftheimperviousnessofeachsubbasincanbenoticed.Morethan50percentoftheareaarehavingapercentageof imperviousnessgreaterthan55%.Weknowthatanincreaseinthepercentageofimperviousnessisequaltoariseinrunoff. Thisdemonstratesclearlythatthereisahighprobabilityofrainfallconvertingtorunoffwithgreaterpeaksandlargervolumes offlood.TheLULCmapfor2022isdisplayedinFigure4
International Research Journal of Engineering and Technology (IRJET) e-ISSN: 2395-0056
Volume: 11 Issue: 05 | May 2024 www.irjet.net p-ISSN: 2395-0072
Table no: 1 Percentage of different areas covered in Mangalore city.
Has the city is developing day by day, the rate of urbanization is also increasing, from Table 1. The percentage of the imperviousnessofeachsubbasincanbenoticed.Morethan50percentofsubbasinshaveapercentageofimperviousness greaterthan55%.Weknowthatanincreaseinthepercentageofimperviousnessisequaltoariseinrunoff.Thisdepictsclearly that there has been a greater probability of conversion from rainfall to runoff with greater peaks as well as higher flood volumes.Fig4showstheLULCmapoftheyear2020.
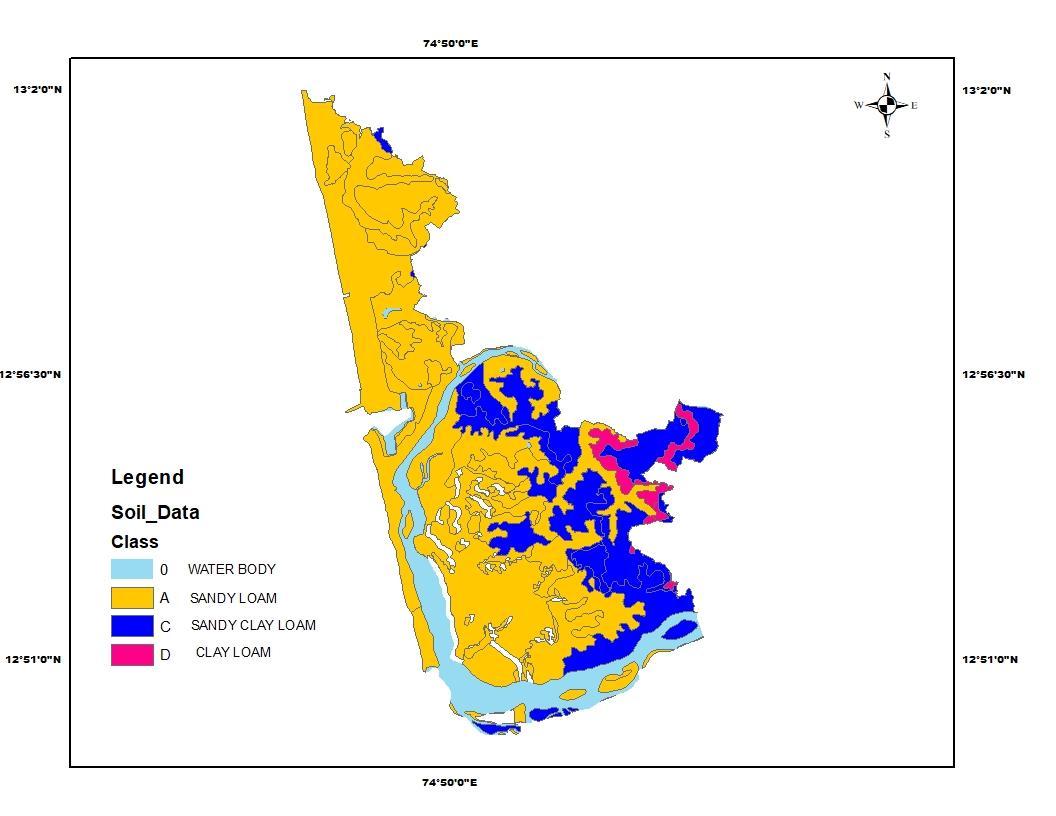
Soil texture:
FromtheArcSWATmodel,afterreclassifyingthesoilmapthetypesofsoilthatareavailableinMangalurucityaredetermined. The3mainsoiltypeshavebeenidentifiedonthesoilmapassandyclayloam,sandyloam,andclayloam.Thepercentageof areathateachsoiltypecoversandsoiltexturearedescribedbelow.Fig5depictsthesoiltypesoftheManaglurucity
International Research Journal of Engineering and Technology (IRJET) e-ISSN: 2395-0056
Volume: 11 Issue: 05 | May 2024 www.irjet.net
Table:2 Soil group classification of Mangaluru city
SoilClassificationof
Model calibration and validation
city
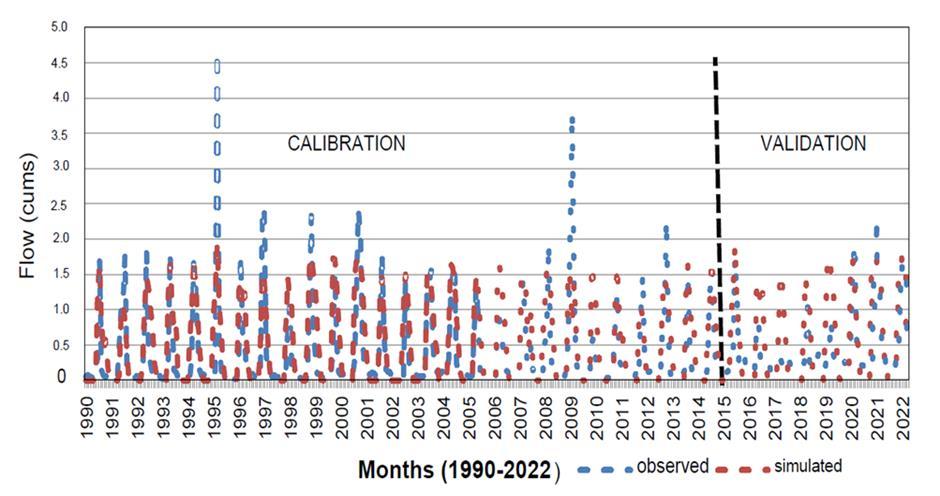
Theaccuracyofthemeasurementmodelhadbeenevaluatedandcanbeusedbysendingflowdatafromthebasintotheareaof interestfortheperiod1990-2015and2016-2022,respectively,formeasurement.Theevaluationwasperformedusingmultiple regressionanalysisusingSequentialUncertaintyAdaptation-2(SUFI-2).WhiletheR2valuewas0.75inthecalibrationperiod (1993-2015),NSEwas0.53inthemonthlyflowcalibrationinthesameperiod.AsshowninTable3,theRSRvalueis0.70and thepercentagedifference(PBIAAS)is4.0%.
Conversely,theR2(coefficientofdetermination)valueoftheverificationprocessresultsforthe2016-2022periodis0.74. However,inthesameperiod,themonthlyoutputNSEvalueofthebasinwas0.57,RSR(ReasonforStandardizationAnalysis) was0.69,andPBIAS(PercentDeviation)was6.2%asshowninTable3.
Table:3 Summary of model performance for calibration and validation period
International Research Journal of Engineering and Technology (IRJET) e-ISSN: 2395-0056
Volume: 11 Issue: 05 | May 2024 www.irjet.net p-ISSN: 2395-0072
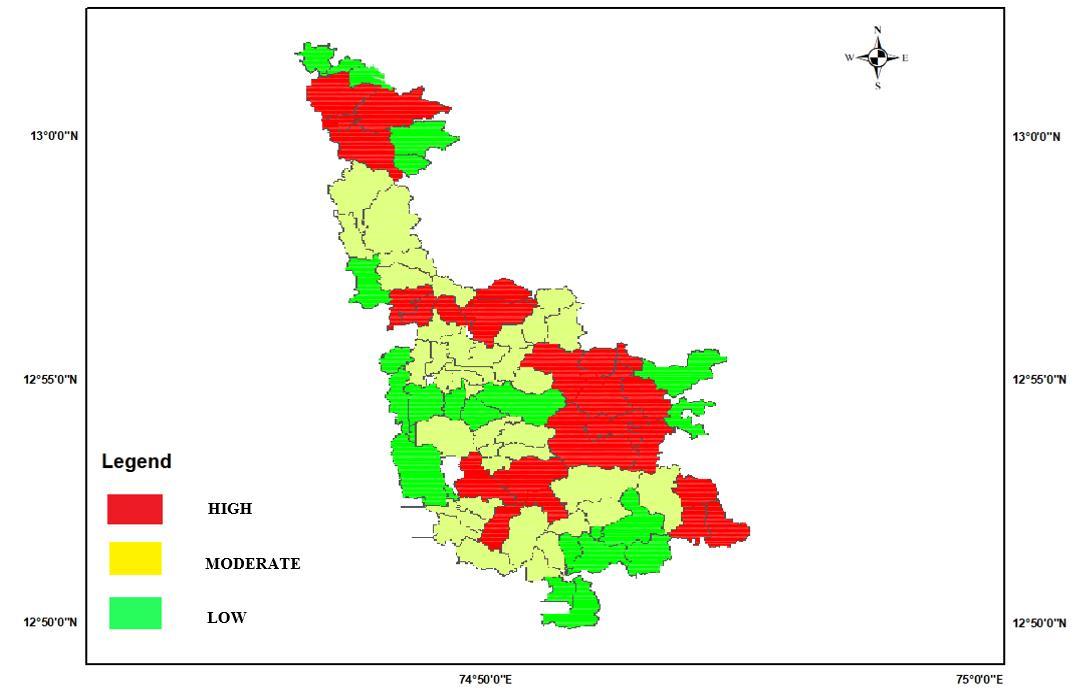
3.5 Flood index map
DifferentfeaturesofthewaterbalanceoftheDemebasinhavebeenfoundbyutilizingacalibratedaswellasvalidatedSWAT model.AfloodmapwascreatedusingArcMapbyanalyzingoverlapusingaveragecurvecounts,runoff,andprecipitation.The resultsshowedthattheareawasdividedinto3areas:highfloodarea,mediumfloodarea,andlowerfloodarea.Analyzingthe overlapbetweenpeakdischargesforeachcompletedbasininArcMapshowsthatmanysubbasinshaveonefinalflow.Themap showsthatKottaraChowki,Kodialguthu,PVS,Attavar,Ekkur,KadriKambalaAdyar,Panjimogeru,Alake,Bykpadyindustrial area,andThokkottuareflood-proneareas,andareatriskofmajorfloods.Fig7belowshowsthefloodzoneinMangalurucity. Majorfloodsincludecommercialareas,residentialareas,andsomemajorcities.
4. CONCLUSIONS
The current study allows for the drawing of the following conclusions:
Asupervisedclassificationalgorithmwasusedtogenerateamapoflandusefortheareafromtheimageofthesatellite. Since62.96%oftheregion'slandisusedforlanduse,thereisacorrespondingincreaseinthepercentageofimpervious surface.
International Research Journal of Engineering and Technology (IRJET) e-ISSN: 2395-0056
Volume: 11 Issue: 05 | May 2024 www.irjet.net p-ISSN: 2395-0072
Thenormaldischargepatternhasbeenshowntobesimilartotheobserveddischarge.Thecorrelationcoefficient(R2)is 0.74,depictingagoodrelationshipamongobservedaswellassimulatedflows.
Some key areas at moderate to high flood risk can be easily identified from the flood risk map and Google Earth projections.Therefore,theseareasrequireimmediateattentionatthetimeofthefloodsandshouldbegiventhehighest priority.Thesecurityaswellasriskmapthuscreatedcouldbeutilizedforfuturedevelopmentplanning.
IthasbeenshownthatSWATisaneffectivetoolforsimulatingfloodhydrographsatspecificlocations.Thisstudyprovides furtherinformationonfloodforecastingandanalysisforhydrologicalmodeling,hydrodynamicmodeling,andfloodcontrol strategies.
References:
[1] NieL.(2014).Floodinganalysisofurbandrainagesystems(Unpublisheddoctoraldissertation).NorwegianUniversityof ScienceandTechnology.
[2] Jeong,J.;Williams,J.R.;Merkel,W.H.;Arnold,J.G.;Wang,X.;Rossi,C.G.ImprovementoftheVariableStorageCoefficient MethodwithWaterSurfaceGradientasaVariable.Trans.ASABE2014,57,791–801.
[3] Roux, H.; Labat, D.; Garambois, P.-A.; Maubourguet, M.-M.; Chorda, J.; Dartus, D. A physically-based parsimonious hydrologicalmodelforflashfloodsinMediterraneancatchments.Nat.HazardsEarthSyst.Sci.2011,11,2567–2582.
[4] MishraSK,SinghVP(2004)Long-termhydrologicalsimulationbasedonthesoilconservationservicecurvenumber. HydroProcess18(7):1291–1313
[5] J.Jasmine,RohanS.Gurav“SWATModelCalibration,ValidationandParameterSensitivityAnalysisUsingSWAT-CUP”. JournalofRemoteSensing,EnvironmentalScience&GeotechnicalEngineeringVolume6Issue1
[6] ManishaBal,AsitKumarDandpat,BanditaNaik“Hydrologicalmodelingwithrespecttotheimpactofland-useandlandcover change on the runoff dynamics in Budhabalanga river basing using ArcGIS and SWAT model”. Remote Sensing Applications:SocietyandEnvironment23(2021)100527
[7] AferaHalefom,ErmiasSisay,DeepakKhare,LakhwinderSingh,TesfaWorku,“Hydrologicalmodelingofurbancatchment usingsemi-distributedmodel”.SpringerInternationalPublishingSwitzerland2017.
[8] DeepakKhare,RajinderSinghandRiturajShukla“HydrologicalModellingofBarinallahWatershedUsingArc-SwatModel” InternationalJournalofGeology,Earth&EnvironmentalSciences2014Vol.4.
[9] ManojK.JhaandSaymaAfreen“FloodingUrbanLandscapes:AnalysisUsingCombinedHydrodynamicandHydrologic ModelingApproaches”www.mdpi.com/journal/water. 2020,12
[10] VinayAshokRangari,V.Sridhar,N.V.UmamaheshandAjeyKumarPatel“RainfallRunoffModellingofUrbanAreaUsing HEC-HMS:ACaseStudyofHyderabadCity”SpringerNatureSingaporePteLtd.2020.
[11] VinayAshokRangari,V.Sridhar,N.V.Umamahesh,AjeyKumarPatel“FloodplainMappingandManagementofUrban CatchmentUsingHEC-RAS:ACaseStudyofHyderabadCity”TheInstitutionofEngineers(India)2018.
[12] Muhammad Jehanzaib, Muhammad Ajmal , Mohammed Achite and Tae-Woong Kim “Comprehensive Review: Advancements in Rainfall-Runoff Modelling for Flood Mitigation” Climate 2022, 10, 147. https://doi.org/10.3390/cli10100147.
[13] Santhi,C,J.G.Arnold,J.R.Williams,W.A.Dugas,R.Srinivasan,andL.M.Hauck.2001.ValidationoftheSWATmodelona largeriverbasinwithpointandnonpointsources.J.AmericanWaterResourcesAssoc.37(5):1169-1188.
[14] VanLiew,M.W.,T.L.Veith,D.D.Bosch,andJ.G.Arnold.2007.SuitabilityofSWATfortheconservationeffectsassessment project:AcomparisononUSDA-ARSexperimentalwatersheds.J.HydrologicEng.12(2):173-189.
[15] Gupta,H.V.,S.Sorooshian,andP.O.Yapo.1999.Statusofautomaticcalibrationforhydrologicmodels:Comparisonwith multilevelexpertcalibration.J.HydrologicEng.4(2):135-143.
[16] Chu, T. W., and A. Shirmohammadi. 2004. Evaluation of the SWAT model’s hydrology component in the piedmont physiographicregionofMaryland.Trans.ASAE47(4):1057-1073
[17] Vazquez-Amábile,G.G.,andB.A.Engel.2005.UseofSWATtocomputegroundwatertabledepthandstreamflowinthe MuscatatuckRiverwatershed.Trans.ASAE48(3):991-1003.
[18] D. N. Moriasi, J. G. Arnold, M. W. Van Liew, R. L. Bingner, R. D. Harmel, T. L. Veith “Model Evaluation Guidelines for SystematicQuantificationofAccuracyInWatershedSimulations”Soil&WaterDivisionofASABEinMarch2007.Vol. 50(3):885−900
[19] SuprayogiSlamet,Rifai,LatifahReviana“HEC-HMSModelforUrbanFloodAnalysisinBelikRiver,Yogyakarta,Indonesia” ASEANJournalonScienceandTechnologyforDevelopmentVol.38:No.1
[20] SurendarNatarajan,NishaRadhakrishnan“AnIntegratedHydrologicandHydraulicFloodModelingStudyforaMediumSizedUngaugedUrbanCatchmentArea:ACaseStudyofTiruchirappalliCityUsingHEC-HMSandHEC-RAS”TheInstitution ofEngineers(India)2020.
[21] Surendar Natarajan, Nisha Radhakrishnan “Simulation of extreme event‑based rainfall–runoff process of an urban catchmentareausingHEC‑HMS”SpringerNatureSwitzerlandAG2019.
International Research Journal of Engineering and Technology (IRJET) e-ISSN: 2395-0056
Volume: 11 Issue: 05 | May 2024 www.irjet.net p-ISSN: 2395-0072
[22] P.P.Mujumdar*,M.S.MohanKumar,G.S.SreenivasaReddy,ShubhaAvinash“Developmentofanurbanfloodmodelfor Bengalurucity,Karnataka,India”CurrentScience,Vol.120,No.9,10May2021.
[23] PallaviTomar,SurajKumarSingh,ShrutiKanga“GIS-BasedUrbanFloodRiskAssessmentandManagement ACaseStudy of Delhi National Capital Territory (NCT), India” India. Sustainability 2021, 13, 12850. https://doi.org/10.3390/su132212850
[24] LeiJiang,YangboChen&HuanyuWang“UrbanfloodsimulationbasedontheSWMMmodel”RemoteSensingandGISfor HydrologyandWaterResources(IAHSPubl.368,2015)
[25] M.H.Hsu,S.H.Chen,T.J.Chang“Inundationsimulationforurbandrainage basinwithstormsewersystem”Journal of Hydrology234(2000)21–37
[26] ErmiasSisay,AferaHalefom,DeepakKhare“HydrologicalmodellingofungaugedurbanwatershedusingSWATmodel” Model.EarthSyst.Environ.DOI10.1007/s40808-017-03286
[27] FengZhou,YoupengXu“Hydrologicalresponsetourbanizationatdifferentspatio-temporalscalessimulatedbycouplingof CLUE-SandtheSWATmodelintheYangtzeRiverDeltaregion”JournalofHydrology485(2013)113–125
[28] ErmiasSisay,AferaHalefom,DeepakKhare,LakhwinderSingh,TesfaWorku“Hydrologicalmodellingofungaugedurban watershedusingSWATmodel”SpringerInternationalPublishingSwitzerland2017.
[29] NDMA(2010).NationalDisasterManagementAuthority(NDMA).GovernmentofIndia.
[30] Das,S.K.,Gupta,R.K.,&Varma,H.K.(2007).Floodanddroughtmanagementthroughwaterresourcesdevelopmentin India.BulletinoftheWorldMeteorologicalOrganization,56(3),179-188.