
International Research Journal of Engineering and Technology (IRJET) e-ISSN:2395-0056
Volume: 11 Issue: 03 | Mar 2024 www.irjet.net p-ISSN:2395-0072


International Research Journal of Engineering and Technology (IRJET) e-ISSN:2395-0056
Volume: 11 Issue: 03 | Mar 2024 www.irjet.net p-ISSN:2395-0072
Upasana Singh, Bhargav Sonawane, Priyanka Shamraj and Ashutosh Pawar
Ashutosh Pawar: Head, GIS and RS, Semantic Technologies and Agritech services Pvt. Ltd., Pune.
Upasana Singh: Sr. GIS and RS executive, Semantic Technologies and Agritech services Pvt. Ltd., Pune. Priyanka Shamraj: Agrometeorologist, Semantic Technologies and Agritech services Pvt. Ltd., Pune. and Bhargav Sonawane: Jr. RS executive Semantic Technologies and Agritech services Pvt. Ltd., Pune. Department of GIS and Remote Sensing, Semantic Technologies and Agritech Services, Pvt. Ltd. Pune.
Abstract
Thisstudy,conductedbytheSemanticTechnologiesandAgritechServices, Pvt.Ltd.,Pune,GISandRemoteSensingTeam in Pune during the Kharif-2023 season, focuses on estimating Cotton crop yield in Beed District. Following the methodology outlined in the YESTECH manual under the Pradhan Mantri Fasal Bima Yojana (PMFBY), the research addresses significant weather-induced yield losses in the region. The study targets Revenue Circle (RC) level assessment usingamultimodalapproach,incorporatingvariousmodelsforpreciseyieldforecasting.Theachievedaccuracy,measured with Root Mean Square Error (RMSE) below ±30% at the RC level, demonstrates the effectiveness of the ensemble approach. The findings highlight the utility of such models in decision-making for agricultural stakeholders, insurance companies, and government policies, especially in rainfed regions facing cotton productivity challenges under diverse climatechangescenarios.
Keywords: Remote Sensing, GIS, Net Primary Productivity (NPP), Machine Learning, (DSSAT-4.8), Cotton, Beed, Yield Simulation,RevenueCircle,CottonProductivity.
Introduction:
In today's dynamic agricultural landscape, unpredictable weather patterns, such as erratic rainfall, rising temperatures, andextremeevents,posesignificantthreatstocropgrowthandyieldstability.Consequently,farmersincreasingly turnto drought-resistantcropsandintensiveirrigation,exacerbatingsoildegradationandamplifyingeconomicvulnerabilitydue tounstableproduction.AveragecottonproductivityinMaharashtra,islikelyfallsbetween187kg/haand443kg/ha.The averagecottonproductivityinBeeddistrictis7.15quintalsperhectare(715kg/ha).
Agriculture serves as the cornerstone of global economies, sustaining livelihoods for billions while presenting critical challenges in accurately predicting crop yields. Traditional methods relying on historical data and manual observations often struggle to address the dynamic nature of modern agricultural challenges. However, the integration of advanced technologies such as software applications, remote sensing, GIS, and AI/ML algorithms has revolutionized crop yield estimation,offeringunprecedentedaccuracyandinsight.
Accurate crop yield estimation holds immense significance across sectors in the contemporary landscape. Firstly, in the insurance realm, precise estimates facilitate fair risk assessment, enabling insurers to develop tailored products that alleviatefinancialburdensonfarmersduringcropfailures.Secondly,ineconomicforecasting,reliablepredictionsinform commodity markets, tradeagreements,and pricing mechanisms,promotingstabilityand ensuringfoodsecurity.Thirdly, governments leverage accurate estimates to formulate effective policies, including subsidy allocation, resource distribution,andstrategicinterventions duringadverseconditions or pestoutbreaks,fostering sustainable practicesand rural development. Additionally, anticipating potential shortfalls supports proactive food distribution, enhancing access, and averting scarcity. Lastly, for farmers, precise estimates enable informed decisions on crop selection, resource allocation,andmarketparticipation,enhancingproductivityandlivelihoods.
The adoption of advanced methods for crop yield estimation signals a transformative step towards building agricultural resilience. By harnessing the synergy between software applications, remote sensing, GIS, and AI/ML technologies, stakeholders empower informed decision-making, paving the way for sustainable agricultural practices and economic prosperity. This report emphasizes the significance of employing advanced methods for estimating crop yield and its implicationsacrossdiversedomains.

International Research Journal of Engineering and Technology (IRJET) e-ISSN:2395-0056
Volume: 11 Issue: 03 | Mar 2024 www.irjet.net p-ISSN:2395-0072
Theobjectivesincludeestimatingthearea undermajorkharifcropsin the Beed district,cropclassificationusingremote sensing and GIS techniques, and estimating crop yield through a combination of models including RS and GIS, Artificial Intelligence,GoogleEarthEngine,groundtruth,andDSSATsoftware.
Inconclusion,byrecognizingthemultifacetedimplicationsofaccuratecropyieldestimation,societiescancollaboratively strengthenglobalfoodsecurity,economicstability,andthewelfareoffarmingcommunities
1. Material and Methods:
Study area:
Study was carried out at Semantic Technologies and Agritech Services, Pvt. Ltd., Pune during kharif season 2023 for particular assignment. For this study, all revenue circles (RC) in the districts of Beed of Maharashtra state were used as experimentalsites.Fieldleveldatalikegroundtruth,Cropcuttingexperimentswerecarriedout.
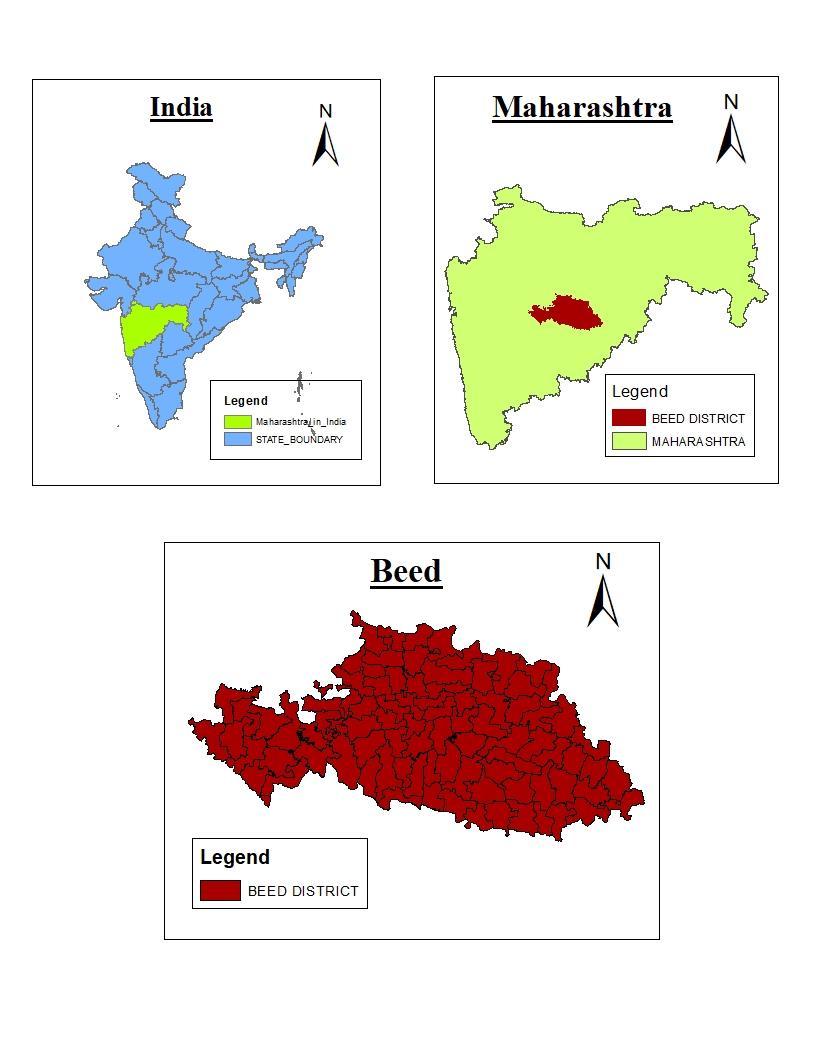
Geography and Climate for Beed District:
Beed district, located in the state of Maharashtra, India, spans an area of approximately 10,693 square kilometres. Its geographical coordinates are approximately 18.9906° N latitude and 75.7531° E longitude, with an average elevation of 540metersabovesea level.The district experiencesa semi-arid climate withhotsummersandcool winters. Theannual rainfalltypicallyrangesfrom600to800millimetres,primarilyoccurringduringthemonsoonseason.Temperaturesvary widely throughout the year, with average highs peaking around 40°C during the summer months, while winter temperatures can drop to around 10°C in December and January. Humidity levels tend to be relatively lower during the driermonths,especiallyinwinter,withhigherhumiditylevelsexperiencedduringthemonsoonseason.Thepredominant soiltypesincludeblacksoil,redsoil,andalluvialsoil,supportingthecultivationofcropssuchascotton,sorghum,pulses, and soybeans. Beed is bordered by the districts of Ahmednagar, Osmanabad, Aurangabad, and Jalna. The major rivers flowingthroughthedistrictincludetheGodavariandtheSindhphana.
© 2024, IRJET | Impact Factor value: 8.226 | ISO 9001:2008 Certified Journal | Page1383

International Research Journal of Engineering and Technology (IRJET) e-ISSN:2395-0056
Methodology:
Allmethodologywasfollowedbytheproceduregivenbyyieldestimationsystembasedontechnology (YES-TECH)under PradhanMantriFasalBimaYojana(PMFBY).
Methodologyusedismultimodalapproachforestimationofcropyieldwasgivenbelow.RCwiseyieldinTonnes/hectorof cottoncropduring kharif season2023wasestimatedbyallfollowingmethods.
1) SemiPhysicalNPP-NetPrimaryProductivity
2) AIandMachinelearning
3) Cropsimulationmodel-DSSAT-4.8
4) EnsembleModel
1) Semi Physical Net Primary Productivity (NPP):
Data and materials used:
Thedataandmaterialsusedinthisstudyareasfollows:
Table 1: Data used for NPP generation in Semi Physical model.
Dailyinsolation/PAR INSAT-3D 4kmresampledto1km MOSDAC
10dayscomposite fAPARver.2
8dayscomposite surfacereflectance
PROBAVandSPOTVGT 1km
Terra-MODIS 1km
PaddyMask Sentinel1 5m
CopernicusLand Service
MODISTimeSeries
Tool
USGSExplorer
Temperature Griddeddatafrom NASAPowerwebsite 1kminterpolated NASAPower
Light-useefficiency Literature HarvestIndex Ground CCE
Fraction of Absorbed PAR (FAPAR):
TheFAPARdataisfromCopernicusLandService,sourcelinkis(https://land.copernicus.eu/global/index.html).the10daycompositeproductwith1kmdataisused.TherangeofFAPARliesbetween0and1.Thephysicalvaluesareretrieved fromtheDigitalNumber(DN).
Photosynthetically Absorbed Radiation (PAR):
PAR is calculated from daily insolation data. The daily insolation data is converted to 8 - day composite (sum) for the wholeperiod.50%insolationisconsideredasPAR.ThisdailyinsolationdataiscollectedfromMOSDACfromINSAT -3D satellite,sourcelink(www.mosdac.gov.in)forthecropseasonfrom2018to2022.
PAR= 8 - day composite * 0.5.
Water Stress (Wstress):
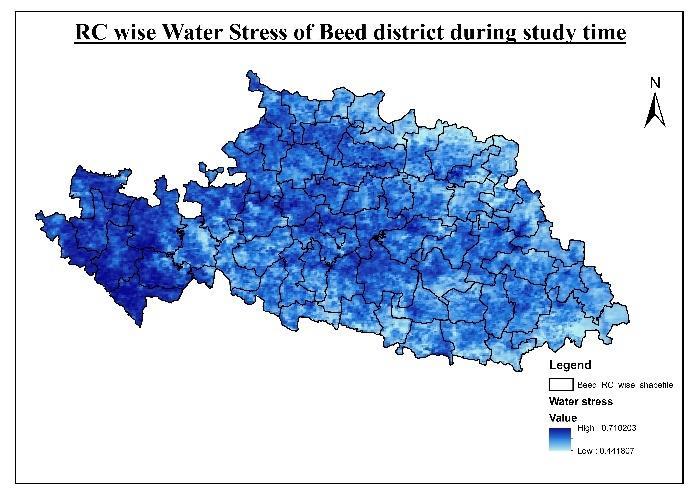
The Wstress is calculated from Land Surface Water Index (LSWI). The MODIS time series tool (MODIStsp) used to download and process the MODIS 8 day composite (MOD09A1) source link is (https: //lpdaac. usgs. gov/products/mod09a1v006),andLSWIiscalculatedfortheentireperiodwiththeformula
LSWI = (ƿ������−ƿ��������)/ (ƿ������+ƿ��������)
LSWI value range from - 1 to 1, and higher positive values indicate the vegetation and soil water stress. Further, the Wstressiscalculatedfrom8daysLSWIoutput–
Wstess = (�� ��������)/ (��+��������������)
Volume: 11 Issue: 03 | Mar 2024 www.irjet.net p-ISSN:2395-0072 © 2024, IRJET | Impact Factor value: 8.226 | ISO 9001:2008

International Research Journal of Engineering and Technology (IRJET)
Volume: 11 Issue: 03 | Mar 2024 www.irjet.net
TheLSWImaxvaluehasbeentakenfromthespatialmaximumofparticularcropmaskoftheentiredistrict.
Temperature Stress:
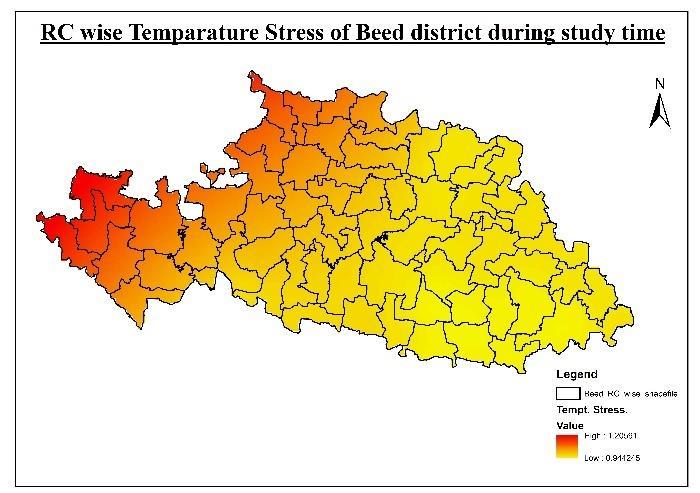
TemperatureStress(Tstress):ThedailyaveragetemperaturedataisdownloadedfromNASAPowerwebsite,sourcelinkis (https://power.larc.nasa.gov/data-access-viewer.html).Itisagriddeddatawitharesolutionof1°0*1°0latitudeand longitude. ��������������= (��−��������)*(��−��������)
Where,Tmin=Minimumtemperaturerequiredforthephotosynthesis(°C).
Tmax=Maximumtemperaturerequiredforthephotosynthesis(°C).
Topt=Optimaltemperaturerequiredforthephotosynthesis(°C);
T=Dailymeantemperature(°C).
Table 2: Data used for cotton crop for Semi-Physical Approach
On the off chance that air temperature falls beneath Tmin, which is quite a rare chance than Tscalar value will automaticallybecome0.
Light Use Efficiency (ℇ):
ThelightuseefficiencyLUEisusedforcottoncropwas1.53forthestudy.(Chavanetal.,2018)
Crop Mask
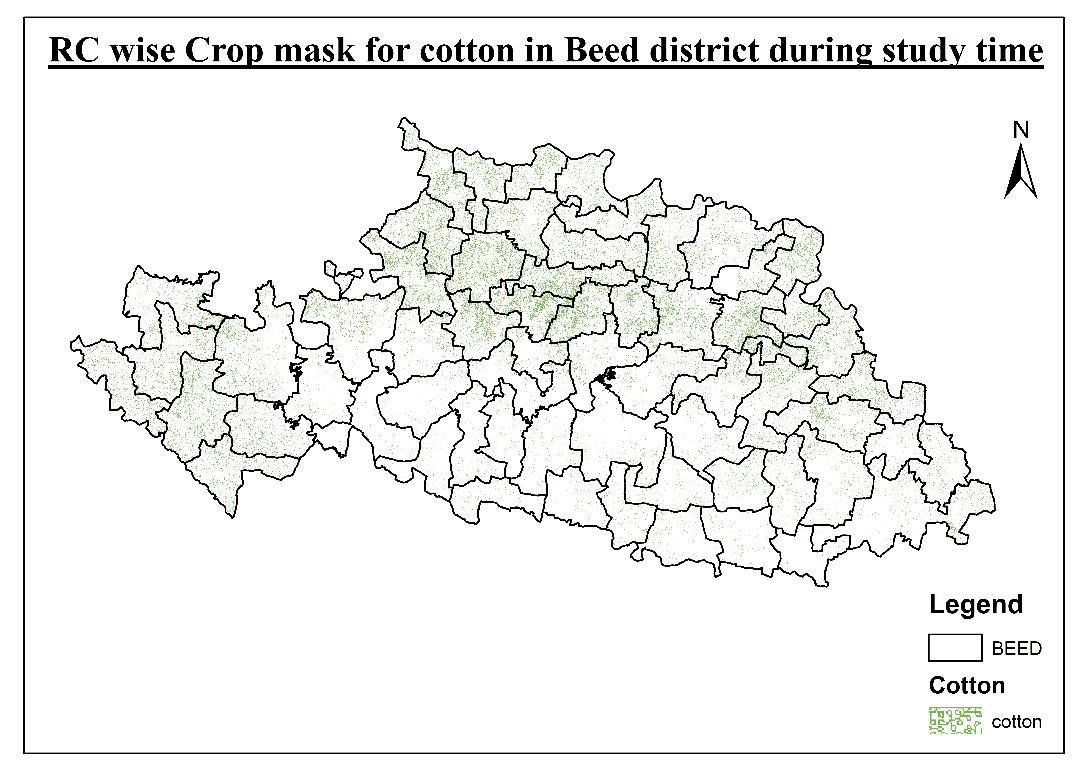
The crop mask was derived utilizing Sentinel-1 synthetic aperture radar (SAR) data obtained from the European Space Agency (ESA) Copernicus Hub. Employing the R programming language, we employed the Random Forest algorithm for the generation of the crop mask, implementing hyperparameter tuning techniques and contingency matrix analysis. This methodologywassystematicallyappliedacrossourspecifiedcropswithinthetargetedareaofinterest. Intermsofaccuracyassessment,ourresultsyieldedarobustaccuracyrangeof90%to95%acrossallcultivatedcropsand withinvariousdistricts.Thissignifiesahighlevelofprecisionindelineatingandclassifyingthespecifiedcropswithin the delineated geographical regions. The meticulous incorporation of Random Forest algorithm, hyperparameter tuning,and contingencymatrixanalysishasfacilitatedthegenerationofareliableandaccuratecropmask,providingvaluableinsights foragriculturalmonitoringandmanagementwithinthedesignatedstudyarea.
Calculation of NPP and Grain Yield:
To compute the final Net Primary Productivity NPP and its Grain Yield, the formula and equation is used as follows. The NPPsumhasbeenmultipliedwithHarvestIndex(0.12)toestimateperpixelyield.
NPP = PAR * FAPAR * ℇ * Tstress * Wstress (LogicofMonteithEquation1972)
Same methodology is followed by Upasana Singh et.al. (2023) and also showing same results for all data usedto run the model.
Material and method and all file process was carried out by the procedure followed by Hoogenboom, G., et.al (2019) and (2024)Jones,J.W.,(2003)andtheminimumdatarequirementsforoperation,calibrationandvalidationoftheCropmodels aredescribedbelow.
Crop simulation model is a mathematical equation or the set of equations, which represents the behaviourofsystem.We used CROPGRO – for Cotton crop. It is consisting of various subroutines viz., Water balance subroutine, Phenology subroutine,Nitrogensubroutine,andGrowthandDevelopmentsubroutinedescribedbelow.
Data input to model
Theminimumdatarequirementsforoperation,calibrationandvalidationoftheCropmodelsaredescribedbelow. [(��−��������)*(��−��������)−��−��������)2]

International Research Journal of Engineering and Technology (IRJET) e-ISSN:2395-0056
Volume: 11 Issue: 03 | Mar 2024 www.irjet.net p-ISSN:2395-0072
Table 3: Showing List of input required by crop simulation model.
Sr.No. Input variables Acronym Source
1. SITE DATA
Latitude LAT NASApower
Longitude LONG NASApower
Elevation ELEV NASApower
2. DAILY WEATHER DATA
Maximumtemperature TEMPMAX NASApower
Minimumtemperature TEMPMIN NASApower
Solarradiation SOLARAD NASApower
Rainfall RAIN NASApower
3. SOIL CHARACTERISTICS
Soiltexture SLTX
Soillocalclassification SLDESC
Soildepth SLDP
Colour,moist SCOM
Albedo(fraction) SALB
Photosynthesisfactor(0to1scale) SLPE
pHinbufferdeterminationmethod SMPX
Potassiumdetermination method SMKE
Horizon-wise
Lowerlimitdrained
LL(L)
Upperlimitdrained DUL(L)
Upperlimitdrained SAT(L)
Saturatedhydraulicconductivity
Bulkdensitymoist
Organiccarbon
DSSAT website Where Global gridded-soil profile dataset at 10-km resolution was Developed for DSSAT-4.8
Software crop simulationmodels.
SWCN(L)
BD(L)
OC(L)
Clay(<0.002mm)` CLAY(L)
Silt(0.05to0.002mm)
Coarsefraction(>2mm)
Totalnitrogen
pHinbuffer
Cationexchangecapacity
Rootgrowthfactor0to1
SILT(L)
STONES(L)
TOTN(L)
PHKCL(L)
CEC(L)
SHF(L)

International Research Journal of Engineering and Technology (IRJET) e-ISSN:2395-0056
Volume: 11 Issue: 03 | Mar 2024 www.irjet.net p-ISSN:2395-0072
Sowingdate
Plantpopulationatseedling
Plantingmethod(TP/directseeded)
Rowspacing
Rowdirection(degreefromnorth)
Seedrate
Sowingdepth
Irrigationdates
Irrigationamount
Methodofirrigation
Fertilizerapplicationdates
FertilizeramountN
Fertilizertype
Fertilizerapplicationmethod
Fertilizerincorporationdepth
Tillagedate
Tillageimplements
Input files
YRPLT
PLNATS
PLME
ROWSPS
AZIR
SDWTRL
SDEPTH
IDLAPL
AMT(J)
IRRCOD
FDAY(J)
ANFER
IFTYPE
FERCOD
DFERT
TDATE
TIMPL
Krishi-Dainandini
Published by in Vasantrao Naik
Marathwada Krishi
Vidypeeth,Parbhani,
Krishi-Dainandini
Published by in Vasantrao Naik
Marathwada Krishi
Vidypeeth,Parbhani,
The files are organized into input, output and experiment performance data file. The experiment performance files are neededonlywhensimulatedresultsaretobecomparedwithdatarecordedinaparticularexperiment.Insomecases,they couldbeusedasinputfilestoresetsomevariableduringthecourseofasimulationrun.Theinputfilesarefurtherdivided into those dealing with the experiment, weather and soil and the characteristics of different genotypes. Similarly output filesarealsofurtherdividedintothosedealingwiththeoverview,summary,growth,water,carbonandnitrogenbalance.
Soil properties directory file: The file SOIL.SOL contained the list of different soils with their physical and chemical properties.
Soil profile initial condition file: The soil profile initial condition file contained the initial values of soil water, soil reactionandsoilnitrogendatapertainingtothissituationwasentered.
Irrigation management file: The Irrigation management file has the provision of date and amount perfixedirrigation (mm)applieddepth(cm)ofmanagement.Irrigationdatapertainingtothissituationwasentered.
Fertilizer management file: Thefertilizermanagementfilecontainedthedate,formandamountofnitrogenapplication. Accordingly,informationonfertilizerapplicationwasenteredinthefile.
Treatment management file: Thetreatmentmanagementfilecontainedthedescriptionofeachtreatmentunderseparate title and serial numbers. The file also contained dates of planting and emergence, plant population at seeding and at emergence, planting method, planting distribution, row spacing, row direction, planting depth, planting material, transplant age,plantsperhill,datesofsimulationbeginningetc.Allneededinformationwasenteredforallthetreatments.
Crop cultivars directory file
For Cotton CRGRO048 contained the list of different cultivars with their genetic coefficients. The modified genetic coefficientsviz.,CSDVAR,PPSEN,EMG-FLW,FLW-FSD,FSD-PHM,WTPSD,SDPDVR,SDFDUR,PODDUR,THRESH,SDPROand SDLIPisused.VarietyselectedwasJS-335whichismostlyusedinthisarea.

International Research Journal of Engineering and Technology (IRJET) e-ISSN:2395-0056
Volume: 11 Issue: 03 | Mar 2024 www.irjet.net p-ISSN:2395-0072
Thegeneticcoefficientsarethemostimportantparameterswhichrepresentsthegeneticcharacteristicsofthecultivarand on which the crop phenology, biomass production partitioning and yield potential of the crop depends. However, the actualperformanceiscontrolledbytheexternalfactorsalso.
Running the crop model: Once,allthedesiredfileswerecreatedcarefullythemodelwas run for all the crops cultivars. Eachrunofmodelcreatedoutputfiles.
3) Machine learning:
Methodologyandprocessingofmodelisdescribedbelowindetails.
Data Collection and Ground Truthing:
Collect remote sensing data (optical and radar imagery) for the study area,coveringthegrowingseasonofthe crops.
Ground truth data collection using field surveys using CropTech App (prepared by compony) for accurate calibrationandvalidation.
Crop Mask Extraction:
Pre-processtheremotesensingdatatocorrectforatmosphericinterferenceandgeometricdistortions.
Applyimageenhancementtechniquestoimprovethevisualqualityoftheimages.
EmploysupervisedorunsupervisedclassificationalgorithmstoextractcropmasksforCottonfields.
Generation of Spectral Indices and use of RADAR backscatter:
Calculatevegetationindices(e.g.,NDVI,NDRE,GNDVI)fromtheopticalremotesensingdatatoassesscrophealth andVigor.
Utilizebackscatterdatafromradarimagerytoanalysesurfaceroughnessandotherrelevantcropinformation(VV, VH).
Crop Cutting Experiments:
Use of Crop Cutting Experiment (CCE) for Crop with smart sampling methods to efficiently estimate crop parametersforcrop.
Training and Testing Models (Machine Learning):
Dividethedatasetintotrainingandtestingsets,ensuringnooverlapbetweenthetwo.
Evaluate the model's performance on the testing dataset using evaluation metrics like accuracy, F1-score, and meansquarederror(RMSE).
Model Validation and Final Result:
ValidatethetrainedmodelusingindependentgroundtruthdatacollectedduringthegrowingseasonforCotton

International Research Journal of Engineering and Technology (IRJET) e-ISSN:2395-0056
Volume: 11 Issue: 03 | Mar 2024 www.irjet.net p-ISSN:2395-0072
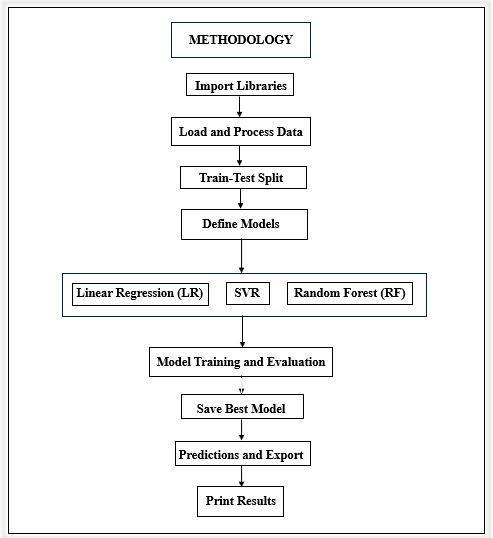
Figure 2: Methodology used in Machine learning Approach.
Assessthemodel'saccuracyandgeneralizationabilitytoensurereliableyieldestimation.
ObtainthefinalcropyieldestimationresultsforCottoninthestudyarea.
4) Ensemble Models
This methodology aims to combine the predictive power of both Machine Learning (ML) models and Crop Simulation Models(CSM)toprovideanenhancedandmoreaccurateestimationofcropyields.Hereisastructuredapproach:
1. Data Collection and Preprocessing:
GatherdatafrombothML,Semi-PhysicalApproachandCSMapproachesasoutlinedintheabovemethods.
Consolidate all input data: weather data, soil properties, crop management practices, spectral indices, RADAR backscatter,andgroundtruthdata.
Ensuredataalignmentintermsoftemporalandspatialgranularity.
2. Individual Model Generation:
a) Machine Learning Approach:
Utilize various algorithms like Linear regression, Random Forest, Extra Trees, k-earest neighbours, and neural networks.
Trainthesemodelsonthedatasetensuringpropervalidationandcalibration.
b) Crop Simulation Approach:
Usewell-calibratedcropsimulationmodelssuchasDSSAT.
Simulatethegrowthandyieldofcropsusingthesemodelsbasedonprovidedinputdata.
© 2024, IRJET | Impact Factor value: 8.226 | ISO 9001:2008 Certified Journal | Page1389

International Research Journal of Engineering and Technology (IRJET) e-ISSN:2395-0056
Volume: 11 Issue: 03 | Mar 2024 www.irjet.net p-ISSN:2395-0072
c) Semi-physical Models:Asemi-physical model in remote sensingandGIS isa type of model thatcombinesphysical
principles with remotely sensed data to estimate or predict biophysical parameters, such as crop yield, biomass. These modelsare often usedto monitorand manage natural resources,as well as toassess the impactsofclimate changeandotherenvironmentalstressors.
3. Ensemble Techniques Application:
Model Averaging:CalculatethesimplemeanofpredictionsfromML,semi-physicalmodelandCSMmodels.
Weighted Averaging:Assignweightsbasedonindividualmodelperformanceandcalculatetheweightedaverage ofpredictions.
Stacking:Useameta-modelthattakespredictionsfromindividualmodelsasinputsandpredictsthefinalyield.
Voting:Eachmodelvotesforafinalyieldprediction,andthemostfrequentpredictionisconsidered.
4. Model Validation:
Splitthedatasetintotraining,validation,andtestsetstoavoidoverfittingandensuregeneralizability.
UsemetricslikeRootMeanSquaredError(RMSE),andR-squared(R2)forevaluation.
Assessperformanceusingthetestdatasetandgroundtruthdata.
5. Quality Control:
CalculatethenormalizedRMSEbetweentheobservedandensemblemodel'sestimatedyield.
EnsureRMSEdoesnotexceedacceptablethresholds,refiningthemodelifnecessary.
Validation:
The accuracy of our model was evaluated based on crop cutting experiment data (CCE data) of PMFBY (Pradhan Mantri FasalBimaYojana)forthecropseason kharif-2023
Results and Discussion:
Followingweretheresultsandconclusionfordifferentmethods/modelsusedforestimationof yield of soyabean crop in BeeddistrictsofMaharashtra,Revenue-Circlewise.
1) Semi Physical Approach-NPP :
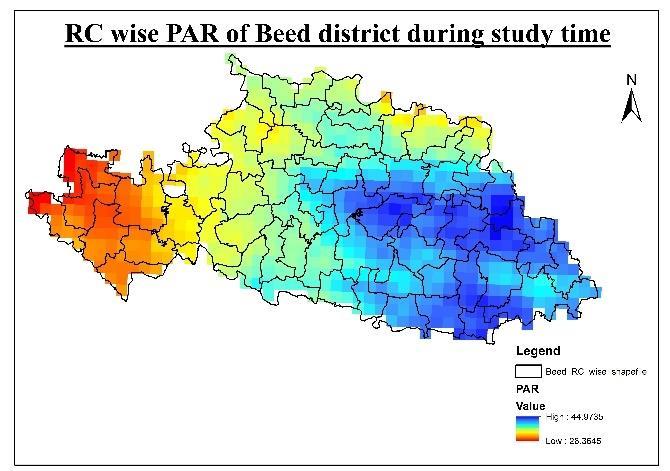
Fig. 3: PAR for Beed during kharif 2023
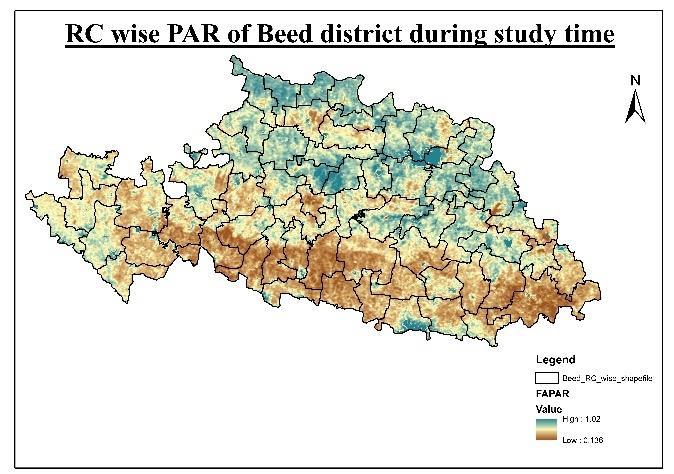
Fig.4: FAPAR for Beed during kharif 2023

International Research Journal of Engineering and Technology (IRJET) e-ISSN:2395-0056
Volume: 11 Issue: 03 | Mar 2024 www.irjet.net p-ISSN:2395-0072

International Research Journal of Engineering and Technology (IRJET) e-ISSN:2395-0056
Volume: 11 Issue: 03 | Mar 2024 www.irjet.net p-ISSN:2395-0072
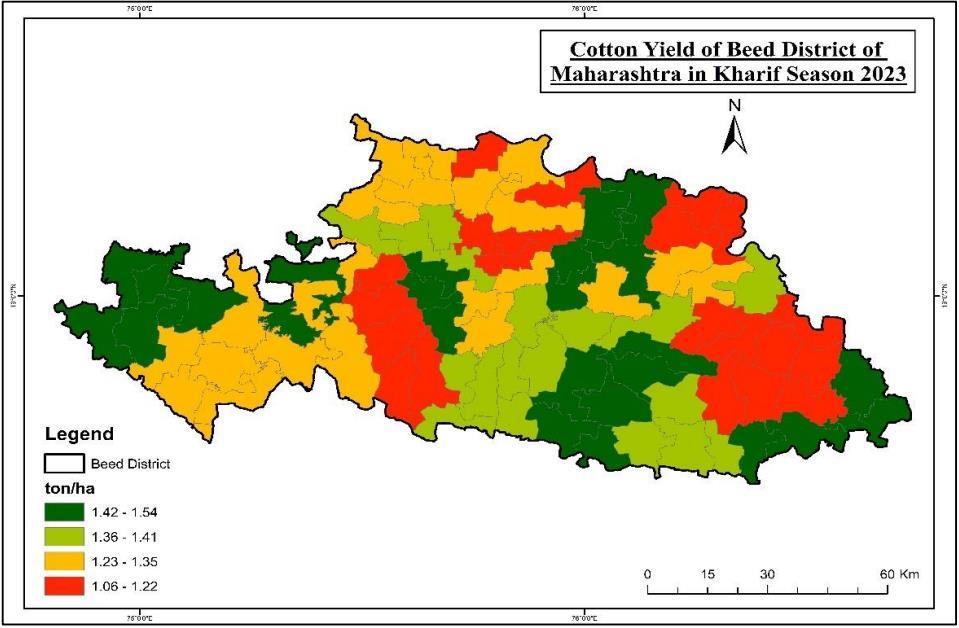
The average cotton yield across Beed District for the kharif 2023 season was approximately 1.33 tonnes per hectare.
Yields varied significantly across different regions within Beed District, ranging from 1.06 to 1.54 tonnes per hectare.
Some of the top yielding areas include Pachegaon, Manjarsumba, and Neknoor, with yields ranging from 1.45 to 1.54tonnesperhectare.
Lower yields were observed in areas like Mohkhed, Nagapur, and Pimpalgaon, with yields ranging from 1.06 to 1.09tonnesperhectare.
Thereseemstobevariabilityinyieldconsistencyacrossthedistrict,withsomeareasshowingstableproduction while others exhibit fluctuations. Various factors such as soil quality, irrigation practices, and agricultural techniquesmaycontributetothedifferencesincottonyieldsacrossdifferentregions.Sameresultswerereported byXiao,X.,et.al(2006)andYao,Y.,et.al(2021)
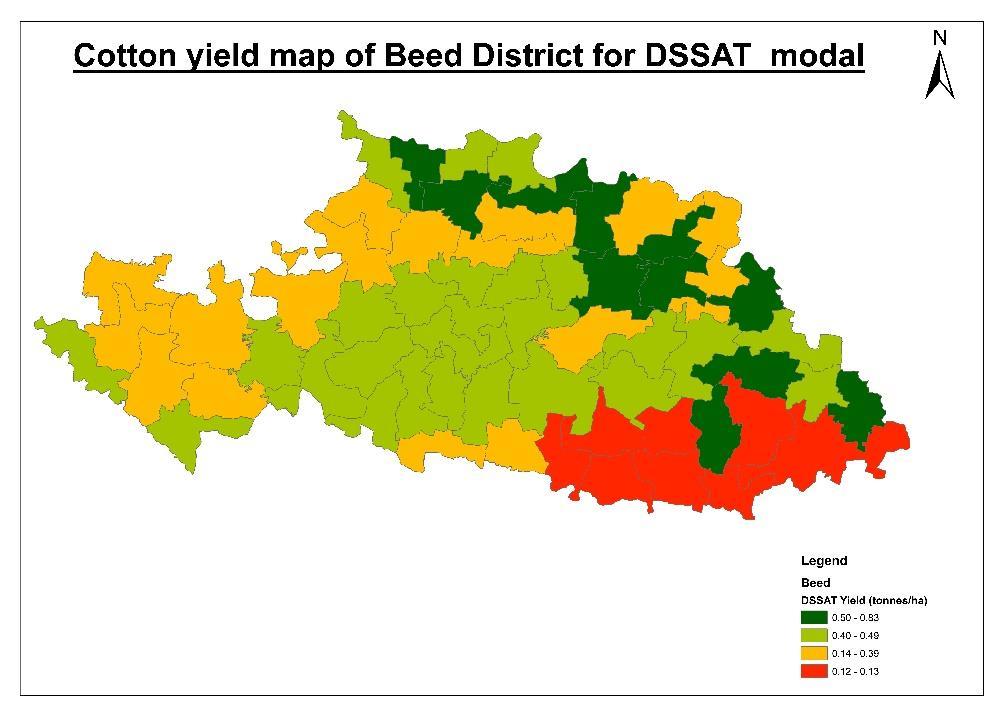
TheaveragecottonyieldforBeedDistrictinthekharifseasonof2023was0.437tonnesperhectare,withyields varyingfrom0.12to0.83tonnesperhectareacrossdifferentregions.
Notable high-yielding areas include Dharmapuri, Majalgaon, and Jategaon, while lower yields were observed in Pimpalgaon,Nagapur,andYusufwadgao.
Yieldconsistencyvariesacross thedistrict,withsomeareasshowingstability inproduction whileothersexhibit variability.
Factors influencing yield disparities encompass soil quality, irrigation practices, fertilization methods, and pest managementstrategies.
Opportunitiesforimprovementlieintheadoptionofenhancedagriculturalpractices,infrastructuredevelopment, and modern technology to bolster yields and enhance livelihoods for farmers in Beed District. Jadhav,S.D et.al (2018),Bhosale,A.D.,et.al(2015)andDeshmukh,S.D.,et.al(2013)alsoelaboratedsameresultsforsoybean.
2024, IRJET | Impact Factor value: 8.226 | ISO 9001:2008 Certified Journal | Page1392

International Research Journal of Engineering and Technology (IRJET) e-ISSN:2395-0056
Volume: 11 Issue: 03 | Mar 2024 www.irjet.net p-ISSN:2395-0072
3) Machine learning
CCE yield and different indices under study showing accuracy 78 % in Machine learning model. By the method (LR)(logisticregression)accuracyisshowinghighestvalue.
The average cotton yield across Beed District for the kharif 2023 season was approximately 0.731 tonnes per hectare.
Yields varied significantly across different regions within Beed District, ranging from 0.57 to 0.89 tonnes per hectare.
SomeofthetopyieldingareasincludeNithrud,Dharmapuri,andMajalgaon,withyieldsranging from0.78to0.89 tonnesperhectare.
LoweryieldswereobservedinareaslikeMadalmohi,Pimpalgaon,andNagapur,withyieldsrangingfrom0.57to 0.64tonnesperhectare.
Thereseemstobevariabilityinyieldconsistencyacrossthedistrict,withsome areasshowingstableproduction whileothersexhibitfluctuations.
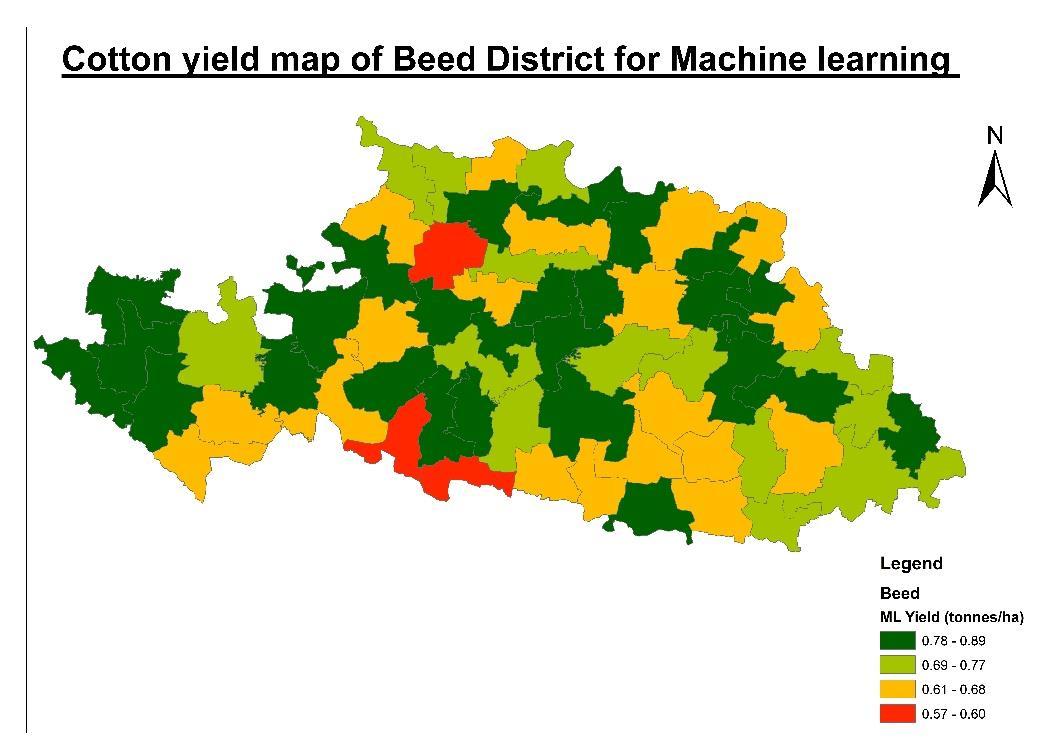
10: Cottonyield in T/ha by ML for Latur during kharif 2023.
Various factors such as soil quality, irrigation practices, and agricultural techniques may contribute to the differencesincottonyieldsacrossdifferentregions.
4) Ensemble Model:
The Ensemble Yield represents a combination of all above three predictive models or methods to estimate soybean cropyield.

International Research Journal of Engineering and Technology (IRJET) e-ISSN:2395-0056
Volume: 11 Issue: 03 | Mar 2024 www.irjet.net p-ISSN:2395-0072
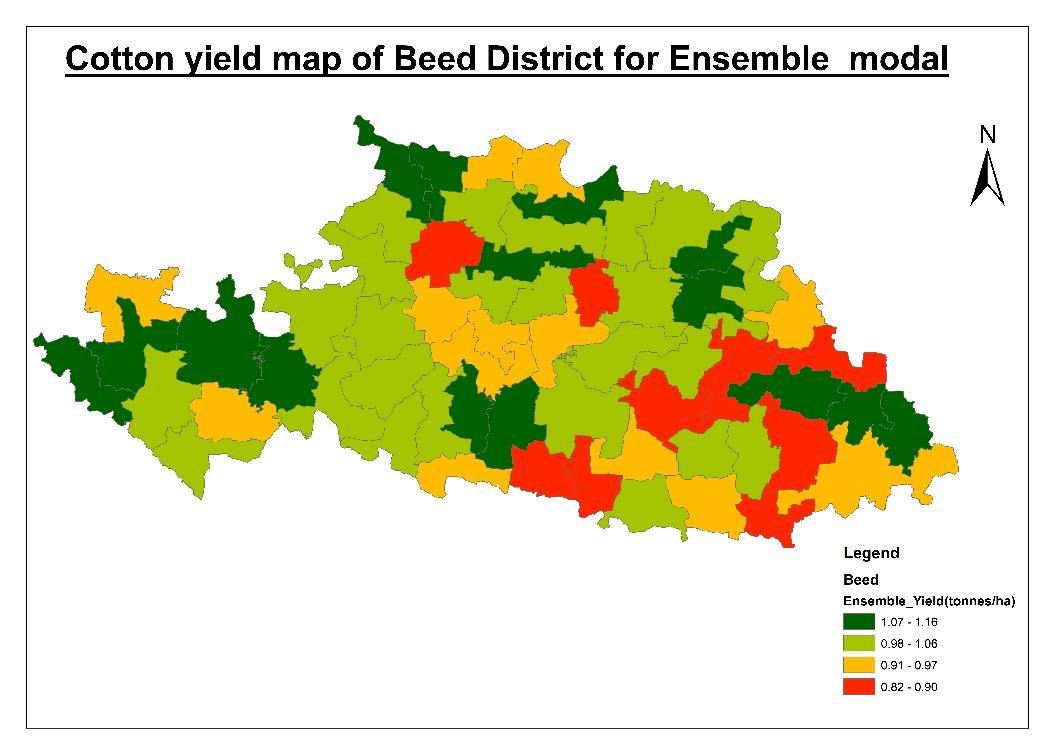
Fig. 11: Cottonyield in T/ha by Ensemble Model for Beed during kharif 2023.
Statisticalapproachgiveweightageduringkharif2023asfollowingtodifferentmodels.
The average cotton yield across Beed District for the kharif 2023 season was approximately 0.992 tonnes per hectare.
Yields varied significantly across different regions within Beed District, ranging from 0.82 to 1.16 tonnes per hectare.
SomeofthetopyieldingareasincludeDharmapuri,Jategaon,andMajalgaon,withyieldsrangingfrom1.09to1.16 tonnesperhectare.
LoweryieldswereobservedinareaslikeNagapur,Pimpalgaon,andMadalmohi,withyieldsrangingfrom0.87to 1.09tonnesperhectare.
Thereappearstobevariabilityinyieldconsistencyacrossthedistrict,withsomeareasshowingstableproduction whileothersexhibitfluctuations.
Various factors such as soil quality, irrigation practices, and agricultural techniques may contribute to the differences in cotton yields across different regions. Same results were given by Md Didarul Islam et.al (2023), LiujunXiaoet.al.(2022)andAyanDasaet.al(2023)inbothMachinelearningandensembleapproach.

International Research Journal of Engineering and Technology (IRJET) e-ISSN:2395-0056
Volume: 11 Issue: 03 | Mar 2024 www.irjet.net p-ISSN:2395-0072
Table 4: Estimated Yield of Cotton crop in Tones/Hectors with different Models and percent error with ensemble model for year 2023.

International Research Journal of Engineering and Technology (IRJET) e-ISSN:2395-0056
Volume: 11 Issue: 03 | Mar 2024 www.irjet.net
Shirur(Kasar) Tintarwani
InTable4,theyieldestimatedbyvariousmethods and ActualfieldCCEyieldispresented. Thepercentageerrorofyield bytheMachinelearningmodelwithfieldCCE,whichisprovidedinthelastcolumn. Outof62pointsonly19pointswere showing more than ±30% error. Average RMSE was -1 As per mentioned in deliverables in YESTECH manual given by PradhanMantriFasalBimaYojana, theerror(nRMSE)betweentheobservedandmodeledyieldshouldnotbemorethan ±30%Fordistrictlevel.WhichindicatesthattheprocessadoptedforRCwiseyieldestimationforcottoncropisacceptable inBeeddistrict
Conclusion: This study investigated the effectiveness of various models for predicting cotton crop yields in Beed, Maharashtra, for the kharif season of 2023. The research compared the performance of three models: the Potential Production (NPP) model, the Decision Support System for Agrotechnology Transfer (DSSAT) model, and a Machine Learningmodel.
The evaluation revealeddistinctstrengths and limitationsin eachindividual model. While eachcapturedspecific aspects ofcropgrowthdynamics,theMachineLearningmodeldemonstratedsuperioradaptabilityandpredictiveaccuracy.
To overcome the limitations of individual models and enhance prediction reliability, the study explored an ensemble approach. This approach combined the strengths of all three models, creating a holistic framework that leverages their individualcapabilities.

International Research Journal of Engineering and Technology (IRJET) e-ISSN:2395-0056
Volume: 11 Issue: 03 | Mar 2024 www.irjet.net p-ISSN:2395-0072
The ensemble model yielded promising results, demonstrating a close alignment with field data. This highlights the potential of such ensemble models to significantly improve the accuracy of crop yield predictions. By minimizing uncertaintiesassociatedwithindividualmodels,thecombinedapproachprovidesamorereliablefoundationforinformed decision-makingintheagriculturalsector.
Inconclusion,thisstudypresentsacompellingcasefortheintegrationofNPP,DSSAT,andMachineLearningmodelsinto an ensemble framework for crop yield prediction. This approach offers a promising avenue for advancing prediction methodologies and ultimately empowers farmers and policymakers with valuable insights to support sustainable agricultural practices in Maharashtra. The findings serve as a foundation for further research and refinement, aiming to continuouslyimprovetheaccuracyandactionablenatureofthesepredictions.
References:
Ayan Das, Mukesh Kumar, Amit Kushwaha, Rucha Dave, Kailash Kamaji Dakhore, Karshan Chaudhari, & Bimal Kumar Bhattacharya. (2023). Machine learning model ensemble for predicting sugarcane yield through synergy of optical and SAR remote sensing. Remote Sensing Applications: Society and Environment, Volume 30, April 2023,100962.https://doi.org/10.1016/j.rsase.2023.100962
Bhosale, A. D., Waskar, D. P., & Shinde, P. B. (2015). Performance of DSSAT model for simulating soybean yield under rainfed condition in Vertisols of central Maharashtra. International Journal of Agriculture, Environment and Biotechnology,8(3),604-610.
Deshmukh,S.D.,Waskar,D.P.,&Shinde,P.B.(2013).ApplicationofDSSATmodelforsoybeanyieldpredictioninVertisols ofwesternMaharashtra.InternationalJournalofCurrentMicrobiologyandAppliedSciences,2(8),555-562.
Hoogenboom,G.,C.H.Porter,K.J.Boote,V.Shelia,P.W. Wilkens,U.Singh,J.W.White,S.Asseng,J.I.Lizaso,L.P. Moreno, W. Pavan,R.Ogoshi,L.A.Hunt,G.Y.Tsuji,andJ.W.Jones.(2019).TheDSSATcropmodelingecosystem.In:p.173216 [K.J. Boote, editor] Advances in Crop Modeling for a Sustainable Agriculture. Burleigh Dodds Science Publishing,Cambridge,UnitedKingdom.https://dx.doi.org/10.19103/AS.2019.0061.10
Hoogenboom,G.,C.H.Porter,V.Shelia,K.J.Boote,U.Singh,W.Pavan,F.A.A.Oliveira,L.P.Moreno-Cadena,T.B.Ferreira,J.W. White, J.I. Lizaso, D.N.L. Pequeno, B.A. Kimball, P.D. Alderman, K.R. Thorp, S.V. Cuadra, M.S. Vianna, F.J. Villalobos,W.D. Batchelor, S.Asseng,M.R.Jones,A.Hopf,H.B.Dias,L.A.Hunt,andJ.W. Jones.(2024).Decision Support System for Agrotechnology Transfer (DSSAT) Version 4.8.2 (www.DSSAT.net). DSSAT Foundation, Gainesville,Florida,USA.
Jadhav,S.D.,Waskar,D.P.,&Shinde,P.B.(2018).EvaluationofDSSATmodelforsoybeanyieldpredictionunderdifferent sowingdatesandirrigationlevelsinVidarbharegionofMaharashtra.JournalofAgriSearch,6(4),37-42.
Jones,J.W.,G.Hoogenboom, C.H.Porter, K.J.Boote, W.D. Batchelor,L.A.Hunt,P.W.Wilkens,U.Singh,A.J.Gijsman,andJ.T. Ritchie. (2003). The DSSAT cropping system model. European Journal of Agronomy, 18, 235-265. https://doi.org/10.1016/S1161-0301(02)00107-7
Liujun Xiao, Guocheng Wang, Hangxin Zhou, Xiao Jin, & Zhongkui Luo. (2022). Coupling agricultural system models with machinelearningtofacilitateregionalpredictionsofmanagementpracticesandcropproduction.Environ.Res. Lett.,17(2022),114027.https://doi.org/10.1088/1748-9326/ac9c71
Md Didarul Islam, Liping Di, Faisal Mueen Qamer, Sravan Shrestha, Liying Guo, Li Lin, Timothy J. Mayer, & Aparna R. Phalke. (2023). Rapid Rice Yield Estimation Using Integrated Remote Sensing and Meteorological Data and MachineLearning.RemoteSensing,15(9),2374.RemoteSensing|FreeFull-Text|RapidRiceYieldEstimation UsingIntegratedRemoteSensingandMeteorologicalDataandMachineLearning(mdpi.com)
Monteith,J.L.(1982).Solarradiationandproductivityintropicalecosystems.JournalofAppliedEcology,19(3),657-666.
UpasanaSingh,GargiGaydhaneandAshutoshPawar(2023)ASemi -PhysicalApproachusingRemoteSensingbasedNet Primary Productivity (NPP), Spatial, Spectral & Temporal Paddy Yield Model Development for the State of Assam.InternationalJournalofScienceandResearch(IJSR).12(8),1175-1785.
VNMKVDiary2023KrishiDainandini2023publishedbyVasantraoNaikMarathwadaKrishiVidyapeeth,Parbhaniduring 2023.

International Research Journal of Engineering and Technology (IRJET) e-ISSN:2395-0056
Volume: 11 Issue: 03 | Mar 2024 www.irjet.net p-ISSN:2395-0072
Xiao, X., Boles, S., Frolking, S., Li, C., Babu, J. Y., Salas, W., & Moore III, B. (2006). Mapping paddy rice agriculture in South andSoutheastAsiausingmulti-temporalMODISimages.RemoteSensingofEnvironment,100(1),95-113.
Yao,Y.,Li,Z.,Tian,F.,&Tao,F.(2021).RemoteSensing-BasedEstimationofMaizeYieldUsingaSemi-PhysicalApproach:A CaseStudyintheNorthChinaPlain.FrontiersinPlantScience,12,662.
Prasad, N.R., Patel N. R., Abhishek Danodia, Manjunath K. R. (2022) Comparative performance of semi-empirical based remotesensingandcropsimulationmodelforcottonyieldpredictionModelingEarthSystemsandEnvironment 8(6)(10.1007/s40808-021-01180-x)
© 2024, IRJET | Impact Factor value: 8.226 | ISO 9001:2008 Certified Journal | Page1398