
International Research
2395-0056
Volume: 11 Issue: 01 | Jan 2023 www.irjet.net p-ISSN: 2395-0072
International Research
2395-0056
Volume: 11 Issue: 01 | Jan 2023 www.irjet.net p-ISSN: 2395-0072
Manager, Machine Learning and Automation, Gap Inc.
Student Department of Computer Science, Stanford University
Abstract -
Purpose: This study aims to enhance demand forecasting accuracy in supply chain management using advanced techniques like genetic algorithm-optimized deep neural networks and fuzzy clustering. Accurate demand prediction enables informeddecision-makingforinventoryplanning,risk mitigation, and operational efficiency.
Methodology: The study adopts an empirical approach utilizing sales datasets to develop machine learning and deep learning models that effectively capture fluctuations in demand across products with varying levels of volatility. The products are classified into categories using fuzzy clustering based on demand variability metrics.
Results:Theoptimizeddeepneuralnetworkmodel,fine-tuned by a genetic algorithm, achieved the highest precision with under 3% mean absolute percentage error in forecasting demand variations, outperforming methods like linear regression and Temporal Fusion Transformer networks.
Practical Implications: The findings demonstrate the vital role of AI/ML in enhancing supply chain resilience through improved demand forecasting. By proactively adapting to demand changes, businesses can optimize inventory and productionplanning, leading toincreasedprofitability,agility, and sustainability.
Originality: To the best of the author's knowledge, this is the first study incorporating genetic algorithm-optimized deep learning and fuzzy clustering to categorize retail products based on demand volatility signatures, thereby significantly improving forecast accuracy.
Key Words: Machine Learning, Supply Chain Risk, Deep Learning, Temporal Fusion Transformer (TFT), Artificial NeuralNetwork(ANN),GeneticAlgorithm(GA)
Thisdocumentistemplate.Weaskthatauthorsfollowsome simpleguidelines.Inessence,weaskyoutomakeyourpaper lookexactlylikethisdocument.Theeasiestwaytodothisis simplytodownloadthe templateand replace(copy-paste) thecontentwithyourownmaterial.Numberthereference itemsconsecutivelyinsquarebrackets(e.g.[1]). However,
the authors name can be used along with the reference number in the running text. The order of reference in the runningtextshouldmatchwiththelistofreferencesatthe endofthepaper.
Supply chain volatility presents significant challenges for businesses, especially in terms of its impact on demand forecasting accuracy (O'Neal, 2021). This directly affects inventoryplanning,riskmitigationandoveralloperational efficiency. While the complexity of this issue is acknowledged(Wan&Evers,2011),prioracademicworks haveexhibitedcertainlimitations.
Although trend forecasting has shown to increase supply chainstability(Miyaoka&Hausman,2008),jointforecasting modelsemployed byAviv(2002)relyonlimiteddata and statistical methods. Advanced AI/ML applications for enhancing resilience have been underexplored. Despite attempts to reduce inventory fluctuations and costs using movingaveragetechniques(Yuanetal.,2020),thebullwhip effectpersistsindistributionnetworks.
Whilemachinelearninghasbeenrecognizedforimproving supplychainefficiency(Aameretal.,2020),itsincorporation specificallyforpharmaceuticaldemandforecastinghasbeen recent (Yani & Aamer, 2022). Moreover, the impact of enhanced predictions on decentralized networks requires careful evaluation (Miyaoka & Hausman, 2008). Although informationsharingbetweenparallelsupplychainsboosts forecastingaccuracy(Zhang&Zhao,2009),corresponding gainsforindividualmembersremainsunclear.
Thisstudyaimstoaddressprevailinggapsbyadoptingan empiricalapproachtodevelopoptimizedmachinelearning models that capture complex demand fluctuations across retailproducts.Thecoreobjectivesare:
Toclassifyproducts intocategories based on demand variabilityandlifecyclestageusingfuzzyclustering.
To evaluate various state-of-the-art forecasting techniques in predicting future sales for differently volatileproductgroups.
To determine the feasibility of tailoring forecasting models based on the unique volatility signatures identifiedthroughclustering.
By combining advanced clustering with tuned predictive models, this study endeavors to significantly improve forecast precision. Enhanced demand prediction will empower businesses to make data-driven decisions for inventoryplanning,riskassessmentandcoordinatingsupply chainactivities.
The paper is structured as follows: Section 2 reviews relevant literature, Section 3 explains the research methodology, Section 4 presents the experiments and results, and finally Section 5 provides the conclusion and implications.
Improvingsupplychainresilienceisacrucial objectivefor businesses and advanced demand forecasting techniques playacriticalroleinachievingthisgoal.Accurateprediction of demand enables businesses to ensure theavailabilityof correctpartsandproductsatalltimes(O'Neal,2021).Trend forecastinghasbeenfoundtoincreasesupplychainstability, reduce stockouts, and reduce the bullwhip effect (Wan & Evers,2011).Jointforecastingandreplenishmentprocesses enablesupplychainmemberstoobservemarketsignalsand forecast future demand, leading to improved forecasting accuracy (Aviv 2002). The moving-average forecasting technique has been demonstrated to reduce the bullwhip effectandincreaseprofitabilityinclosed-loopsupplychain networks(Yuanetal.,2020).
Theutilizationofmachinelearningindemandforecastinghas been acknowledged as a valuable contributor to the enhancement of supply chain management efficiency Accurate demand forecasting is essential to mitigate the bullwhip effect and improve supply chain performance (Aameretal.,2020).Disruptivetechniquessuchasmachine learningcanbeemployedtoenhancetheresilienceofsupply chains,particularlyinthepharmaceuticalindustry(Yani& Aamer, 2022). However, it must be acknowledged that improved forecasts can have both positive and negative consequences on decentralized supply chains. Although improved forecasts can lead to better coordination and reducedcosts,theycanalsodetractfromtheperformanceof individual supply chain members (Miyaoka & Hausman, 2008).
The influence of external demand information on parallel supplychainsisalsoexamined.Utilizingthedemandhistory ofothersupplychainscanenhancetheforecastingaccuracy forbothsuppliersandretailers(Zhang&Zhao,2009).Inthe retail industry, various demand forecasting methods and algorithmshavebeenexplored,underscoringtheimportance of accurate demand forecasting for effective supply chain management(Vikasetal.,2021).Severaldemandforecasting technologies, such as the moving average, exponential smoothing,andminimummeansquareerrormethods,have beenanalyzedtoassesstheirimpactonthebullwhipeffectin
two-levelsupplychaindistributionnetworks(Yuan&Zhu, 2016).
Arecentstudyfoundthatincorporatingbasestockpolicies with"stale"forecastsinatwo-stagesupplychaincanleadto improved fulfillment and reduced production-level fluctuations(Miyaoka&Hausman,2004).Additionally,the impact ofstochastic lead- times on the bullwhip effecthas been investigated, underscoring the importance of considering lead-time variability in demand forecasting (Michna et al., 2020). Other forecasting methods, such as autoregressiveintegratedmovingaverageandexponential smoothing, have been suggested to enhance forecasting accuracyinsupplychains(Wagner,2010).Theevolutionof ARMA demand in supply chains has significant practical implicationsforquantifyingthebullwhipeffect,coordinating forecasting, and evaluating information-sharing (Zhang, 2004).
Riskisaninherentaspectoflifethatcarriesconsequences; however, when it specifically arises in supply chains, it is susceptible.Junaidetal.(2019)aimedtoidentify,assess,and developcriteriaformanagingsupplychainrisk.Theseresults suggest that
etal.(2019)investigatedtheinfluenceofinformationsharing onforecastingaccuracyindifferentmarketsizes,types,and consumerintegration,usingmachinelearningalgorithmsto adapt to supply chain members' needs. Weskamp et al. (2019) examinedpostponement conceptsandpresented a casestudyoftheapparelindustry,illustratingthebenefitsof the model and conducting a sensitivity analysis regarding demanduncertaintyandcorrelation.Geetal.(2019)focused on several core components of supply chain management, including vendor management, demand forecasting, inventory management, and order fulfillment. The supply chainmanagementfieldhasundergonesignificantchanges with the emergence of new business scenarios and advancementsinbothalgorithmdesignandcomputational power.
Foodsupplychainsarecurrentlyfacingincreaseduncertainty inbothsupplyanddemandandaresusceptibletounexpected disruptions.Todesignaresilientfoodsupplychainthatcan withstanddemanduncertaintyandepidemicdisruptions,a comprehensive two-stage scenario-based mathematical modelhasbeenproposed(Gholami-Zanjaniet.al.,2020).To improveefficiencyandreduceemissionsinthedownstream oil industry, the Chinese government is promoting a multiproductpipelinenetworkreform(Yuanet.al.,2020).
An official framework was constructed to procure comprehensive design-scale information necessary for evaluation,incorporatingdemandforecastinganddemand reallocation within a pipeline network optimal planning model.(Siagianet.al.,2021)exploredtheimpactofsupply chainintegrationonbusinessperformancethroughsupply
chain resilience, supply chain flexibility, and innovation systemsinIndonesia'smanufacturingcompanies.Thisstudy found that supply chain integration enhances business performancethroughinnovation,supplychainflexibility,and supply chain resilience in the context of the COVID-19 pandemic.(Tariganet.al.2021)investigatedtheinfluenceof internalintegration,supplychainpartnership,supplychain agility,andsupplychainresilienceonsustainableadvantage. These findings provide valuable insights for managers to improve sustainable advantage by enhancing supplychain agility,resilience,andpartnerships.
Manufacturersandretailersarekeyplayersinsupplychain management.However,inaccuratedemandinformationfrom retailerscannegativelyaffectsupplychains.Toaddressthis issue, Sardar et al. (2021) proposed a machine-learning approachforon-demandforecastinginthecontextofsmart supply chain management. The pandemic has accelerated digitalizationtrendsandtheuseoffunctionalmaterialsinthe textile industry, presenting an opportunity to overcome supply chain disruptions and other challenges. IvanoskaDacikjetal.(2023)discusstheadvancementsindeveloping smarttextilesthroughtheuseofelectrospunnanofibersand nanogeneratorsformonitoringandsensingpurposes.Mittal etal.(2008)developedaphysics-basedmethodthatutilizes nonlinear differential equations and a tailored objective function for forecasting a company's throughput. Their approachhighlightedthepotentialofphysics-basedtactics for forecasting. Mittal et al. (2023) study focuses on the intricacies and vulnerabilities inherent in supply chains, whichareofteninfluencedbyexternaldisruptionssuchas pandemics, conflict scenarios, and inflation. The aim is to deviseanAI-drivensystemthatcanaccuratelyappraisethese intricacies within the domain and mitigate their vulnerabilitieseffectively.
Inconclusion,advanceddemand-forecastingtechniquesplay a crucial role in enhancing supply chain resilience. By employing accurate prediction methods, businesses can optimizeinventorylevels,minimizestockouts,andmitigate bullwhip effects. Several techniques, including trend forecasting,collaborativeforecasting,machinelearning,and forecasting technologies, have been explored to enhance forecasting accuracy and supply chain performance. However,itisessentialtoconsiderthepotentialimpactsof improvedforecastsondecentralizedsupplychainsandthe significance oflead time variability indemandforecasting. Precisedemandforecastingisvitalforeffectivesupplychain management.
Theprimaryaimofthisstudyistoinvestigatetheinfluenceof demandvolatilityontheperformanceofforecastingmodels commonlyusedinsupplychainmanagement.Ourobjectiveis toexaminethefeasibilityofincorporatingdemandvariability into a robust forecasting framework, considering how this
volatilitychangesovertheproductlifecycleandinrelationto thekeyproductoffercharacteristics.Thegoalistodevelopa hybridforecastingapproachthatcanaccountforsignificant differences in volatility across products and time periods, therebyenablingthecreationofamorecomprehensiveand accuratesystemforsupplychainplanningandmanagement.
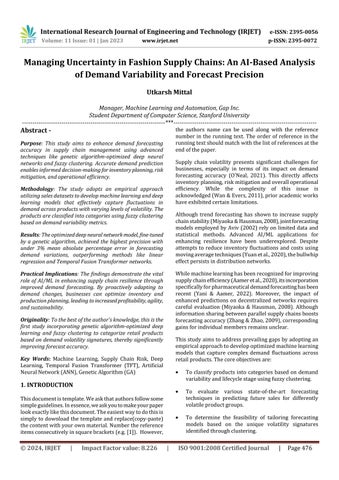
Toachievethisobjective,theresearchmethodologyoutlined inthisstudyadoptsatwo-prongedapproach,asshownin Figure1.Theinitialphaseinvolvesclusteringproductsinto groupsbasedonlifecyclestage,marginofvalue,andmultiple demand volatility metrics. By categorizing the products in this manner, homogeneous volatility profiles can be identified within each cluster. The second phase involves developing tailored forecasting models for each defined productcluster.Thisallowsuniquevolatilitysignaturesand demand behaviors to be incorporated into each clusterspecificmodelthroughthemodelstructureandparameters. Bycombiningadvancedclusteringtechniqueswithclustertuned forecasting models, the hybrid approach aims to capture variability in a robust manner, beyond the capabilitiesoftraditionalone-size-fits-allforecastingsystems.
The performance and viability of the proposed hybrid methodologywereevaluatedthroughanempiricalanalysis usingreal-worldretailsalesdata.
The data used for this analysis were sourced from a large retailer that produces numerous product lines across multiplecategories.Thecompanyprovidesacomprehensive datasetthatincludesfiveyearsofaggregatedpoint-of-sale demanddataandcurrentandhistoricalpricinginformation. Thedemanddataarecompiledacrossallthecompany'ssales channels, including brick-and-mortar stores, e-commerce, andwholesaleorthird-partyretailpartners,encompassing 10,000individualstock-keepingunits(SKUs).
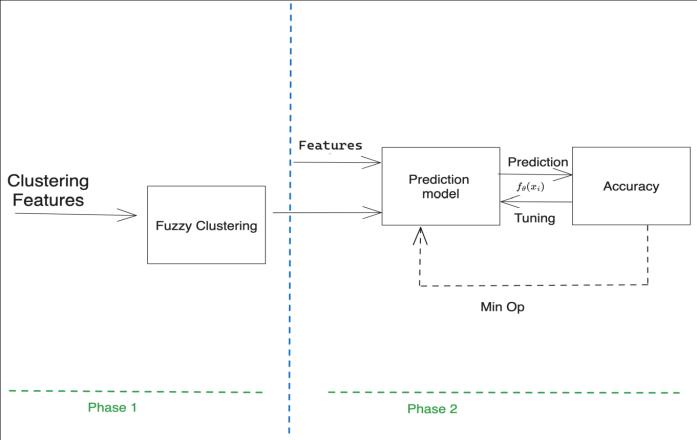
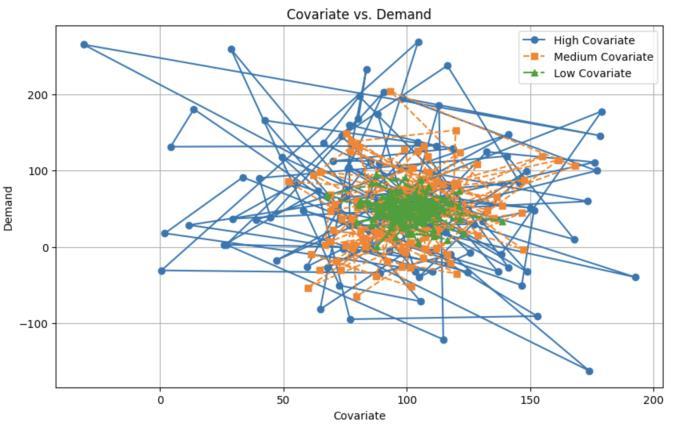
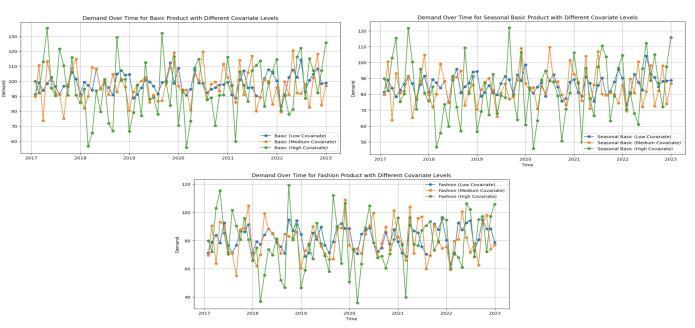
A crucial aspect of the data is that demand levels vary significantlybasedontheproductlifecyclestage.Productsin
the introduction and growth phases typically have higher demand than those in the maturityand decline phases do. This discrepancy is primarily attributed to how product offeringscontributetothemeasurementofvariation(MoV) at eachlifecyclestage.Newer productsbring greater MoV, whiledemandtapersforagingproductsasMoVdecreases. The variation of the demand with different covariates is demonstratedinFig2andFig3.
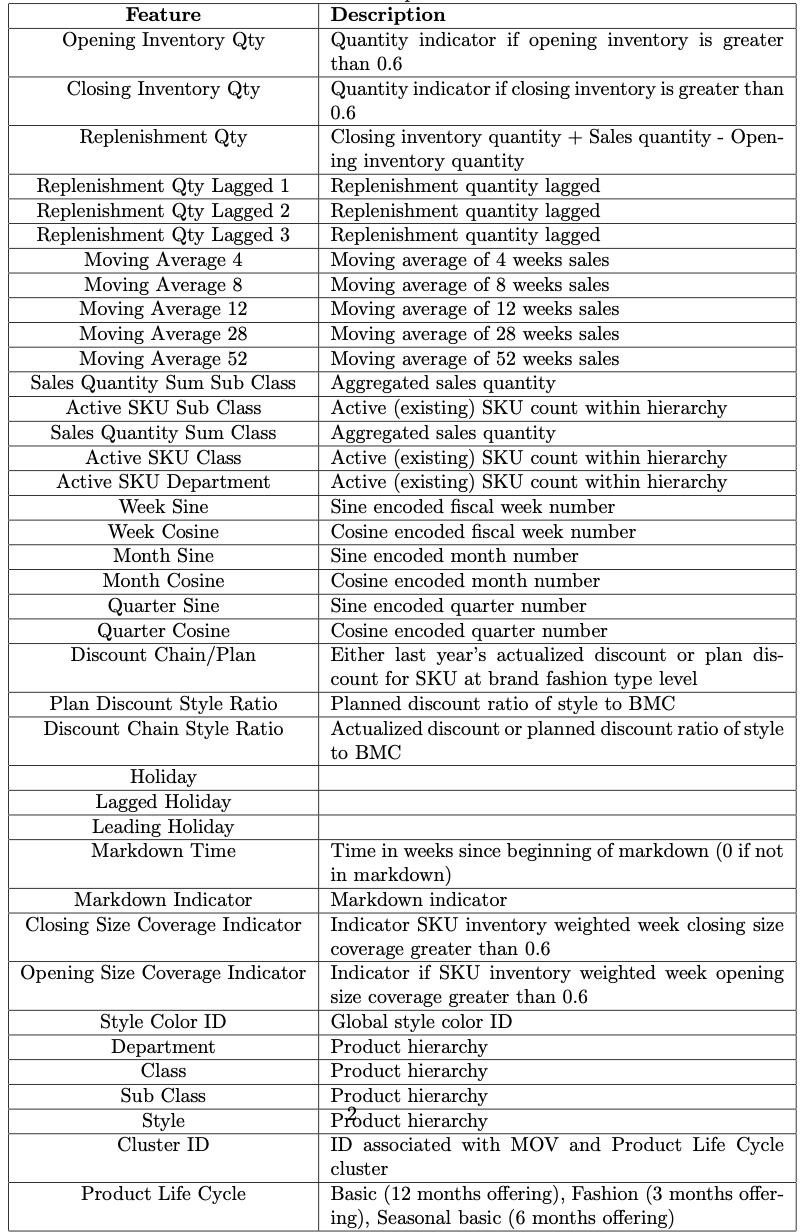
The large timespan and extensive number of SKUs representedinthedataprovidearobustreal-worlddataset foranalyzingdemandpatternsandlifecyclecurvesacrossa broadrangeofretailfashionproducts.Thiswillenablethe modelingofdemandduringkeytransitionallifecyclephases and provide insights into optimal forecasting approaches basedonthelifecyclestage.Thefollowingdatafeatures (Table1)wereusedtoforecastthedemand.
The product data were initially grouped into primary, secondary, and tertiary clusters based on the product life cycle and measure of variance (MoV). The products were thenassignedmembershipgradestoeachcluster,withthe primaryrepresentingthehighestMoVproductsandtertiary
representingthelowestMoVproducts.Thisclassificationis crucial for further analysis, as it allows for a distinct examinationofthedemandvariationandproductlifespansin eachcluster,whichimpactsdemandforecastingdifferently.
The feature set comprises a range of variables related to inventorylevels,salestrends,productattributes,discounts, andholidays.Theinventoryindicators,suchastheopening and closing inventory quantities, provide insights into the current stock levels and is used in combination with sales data to determine the inventory turnover rate and the numberofweeksofsupplyonhand.Highinventorylevels (exceeding 0.6 quantity indicator) indicate excess stock builduporpoorsalesvelocityforspecificproducts.
Thesalesaggregatesatthedepartment,class,andsub-class levelsallowfortheanalysisofbroaderdemandtrendsand performance for various product groupings. Issues with lower aggregate sales for certain departments can be identifiedforfurtherinvestigation.
Themovingaveragesofsaleswithdifferentlookbackperiods (4,8,12,28,and52weeks)capturebothshortandlong-term salestrendcycles.The28-and52-weekaveragessmoothout weekly/monthlyfluctuations,whilethe4-weekaverageacts asamomentumindicatorofrecentsaleschanges.Comparing the moving averages at different cycles highlights sales trajectory.
Themarkdownfeatureshelpoptimizepromotionalpricing andanticipatediscountingeffects.Thetimesincemarkdown
started(mkdtime)providescontextonwhereaproductisin themarkdowncadence.Markdownindicators(mkdind)flag thestartofdiscountingperiods.ClusterIDsgroupproducts with similar demand profiles and markdown optimization needs.
Theholidayindicatorsaccountforseasonaldemandspikes, while the lagged holiday values represent post-holiday demand drop-off. Incorporating this seasonality into the model intuitively provides more accuracy. The product attributes(style,color,seasonalitycodes)allowforcustom forecastingbyproductsegmentandcharacteristics.
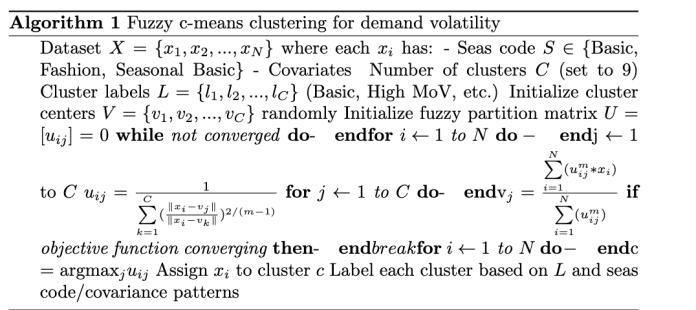
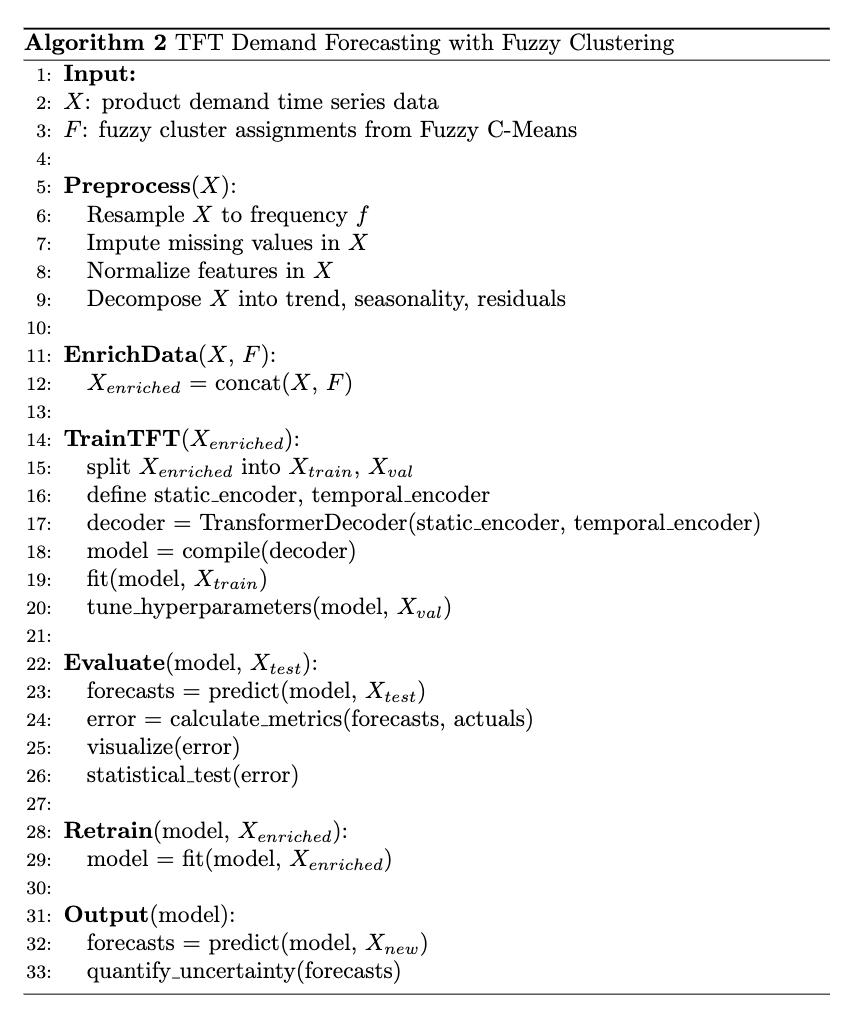
The product categorization process commences by implementingaFuzzyC-meansclusteringalgorithm,which assignseachproductamembershipgradeforeachcluster. This"softclustering" methodallowsproductstobelongto multipleclusters,butwithvaryingdegreesofmembership. Theresultingfuzzyclusterassignmentsarethencombined with additional numeric and categorical features such as saleshistory,color,andotherproduct-specificattributesto
createanenricheddataset.Thisenricheddatasetservesas input for the subsequent time series forecasting models designedtopredictfutureproductdemand.
The time series models evaluated for their forecasting accuracy include the Temporal Fusion Transformer (TFT) model, which is robust to outliers, and the Deep Artificial Neural Network (ANN) model. The TFT model uniquely combines multiple decision tree models, each built on detrended time series segments, to provide a reliable prediction. The model's performance is optimized using hyperparametersthataretunedusingRandomizedSearchto identify the optimal number of trees, seasonality Fourier order,andothersignificantparameters.
TheDeepANNmodelisoptimizedusingaGeneticAlgorithm, which fine-tunes the number of nodes, dropout rate, and other topology parameters by mimicking the process of natural selection. The evaluation of these models utilizes various accuracy metrics like Mean Absolute Error (MAE), Mean Absolute Percentage Error (MAPE), and Root Mean SquareError(RMSE),whicharecalculatedonavalidationset to ensure the model's accuracy. Statistical testing is then employed to determine the significance of accuracy improvements.
Basedonacomprehensiveevaluation,theTemporalFusion Transformer and the Deep ANN models have exhibited remarkable efficacy. Specifically, the neuro evolved ANN model has consistently recorded the least error across multiple experimental trials. As a result, these exceptional modelsareretrainingontheentiredatasettogeneratethe most dependable and robust predictions. This thorough process thus ensures optimal product categorization and precisedemandforecasting,whicharecrucial for effective inventorymanagementandbusinessplanning.
8. Evaluation metrics:
The three error measurements of root mean square error (RMSE),meanabsolutepercentageerror(MAPE),andmean absolute error (MAE) are used to evaluate the predictive accuracy of the models. RMSE is computed by taking the square root of the average squared differences between predictedandactualvalues,anditmeasuresthemagnitudeof the error. MAPE is the mean of the absolute percentage errors,calculatedbytakingtheabsolutedifferencebetween eachpredictionandactualvalue,dividingbytheactualvalue, andaveragingthesepercentages,anditexpressesaccuracyas a percentage of the error. Finally, MAE is the mean of the absolute differences between predictions and actuals, providinganabsolutemeasureofthetypical magnitudeof the errors. These three metrics offer a comprehensive assessmentofthedeviationsbetweenthemodels'predicted valuesandthetrueempiricalvalues.AnalyzingRMSE,MAPE, and MAE enables a robust evaluation of the models' predictivecapabilities.
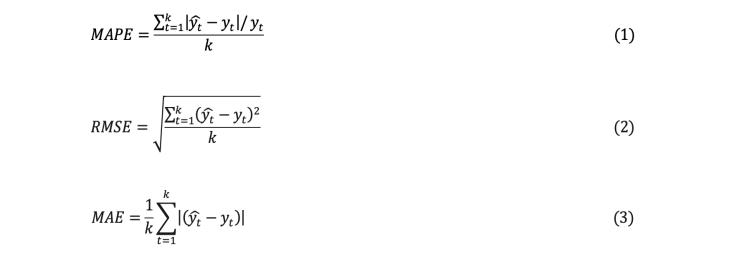
n=thenumberofobservations
yhat=thepredictedvalue
y=theactualvalue
Σ = b observationsfrom1tok
9. Experiments:
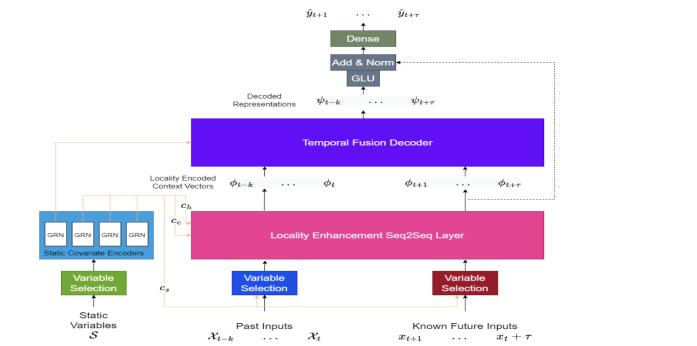
TheTemporalFusionTransformer(TFT)isahighlyadvanced modelthatemploystheTransformerarchitecturetoprocess the complex temporal dynamics present in multiple time sequences.Itcomprisesfivecriticalcomponents,eachwitha distinctfunction.Firstly,thegatingmechanismisutilizedto eliminateunnecessaryelementsandcustomizethedepthand complexity of the network to suit various datasets and conditions.Secondly,thevariableselectionnetworkselects the relevant input variable for each time step. Thestaticcovariateencoderplaysadualrolebyassimilating static features into the network and regulating temporal dynamicsthroughtheencodingofcontextvectors.Fourthly, the TFT is equipped with temporal processingcapabilities that extract both short- term and long-term temporal associationsfromobservationsortime-varyinginputsknown inadvance.Thisisachievedthroughsequence-to-sequence layersforlocalprocessing,aswellasanovelinterpretable multi-head attention block for long-term term extraction. Finally, the model utilizes multi-level prediction interval prediction,whichemploysquantilepredictiontodetermine the range ofpotential targetvalues within each prediction interval. This comprehensive structure, despite its complexity,allowstheTFTtoeffectivelycapturetheintricate temporaldynamicspresentinmultipletimesequences.
The Artificial Neural Network (ANN) comprises 144 input neurons,twohiddenlayerswith150and60sigmoidneurons respectively, and two output neurons for class prediction. Thelayersarefullyconnectedandcontainmorethan17,000 trainable weights. These weights are optimized utilizing a GeneticAlgorithm(GA),whereineachsolutionembodiesall ANN weights in three separate one-dimensional vectors. Thesevectorsarereshapedintoweightmatricesduringthe evaluationoffitness.TheGAemploystournamentselection, single-point crossover, and Gaussian mutation to evolve a populationof100solutionsfor100generations,withtheaim of discovering the globally optimal set of weights that maximizespredictionaccuracy.
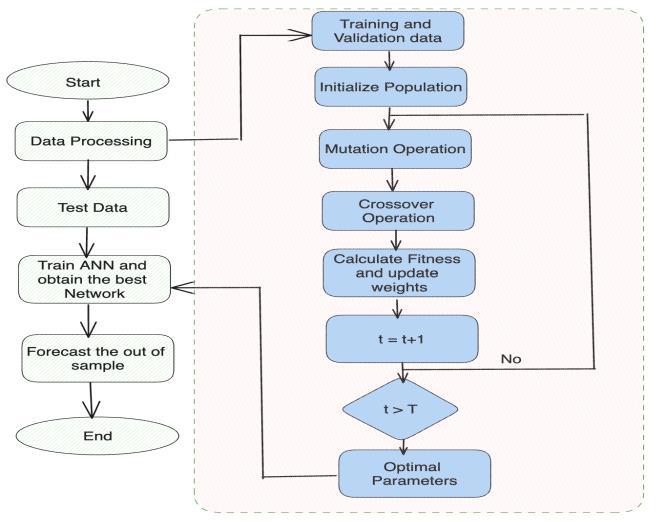
Table 2 displays the performance of two models, TFT (Temporal Fusion Transformer) and GA Optimized ANN (Genetic Algorithm Optimized Artificial Neural Network), across three different covariate conditions: High, Medium, andLow.Themodels'performanceisevaluatedusingthree metrics: MAPE (Mean Absolute Percentage Error), MAE (Mean Absolute Error), and RMSE (Root Mean Squared Error).FortheTFTmodel,theMAPEpercentagesrangefrom 4.91% to 10.04%, the MAE ranges from approximately 83,560to189,110,andtheRMSErangesfromaround92,460 to183,138.Asthecovariateconditionsdecreasefromhighto low, the MAPE, MAE, and RMSE values tend to decrease, indicating an increase in forecast accuracy. For the GA Optimized ANN model, the MAPE percentages range from 3.1%to5.83%,theMAErangesfromapproximately76,834 to 121,363, and the RMSE ranges from around 89,274 to 131,487.Similarly,asthecovariateconditionsdecreasefrom high to low, the MAPE, MAE, and RMSE values tend to decrease,indicatingbetterforecastaccuracy.
Thethreeproductcategoriesexamined-Basic,Seasonal,and Fashion - exhibited varying levels of forecast error. The Fashioncategoryhadthehighestforecasterror,likelydueto the volatile nature of fashion trends. The Low Covariate dataset, coupled with the GA Optimized ANN model, producedthemostpreciseforecastsoverall.
When comparing the two models, the GA Optimized ANN model outperformed the TFT model in all covariate conditions,asindicatedbyitslowervaluesofMAPE,MAE, andRMSE.ThissuggeststhattheGAOptimizedANNmodelis moreaccurateinitsforecasts.
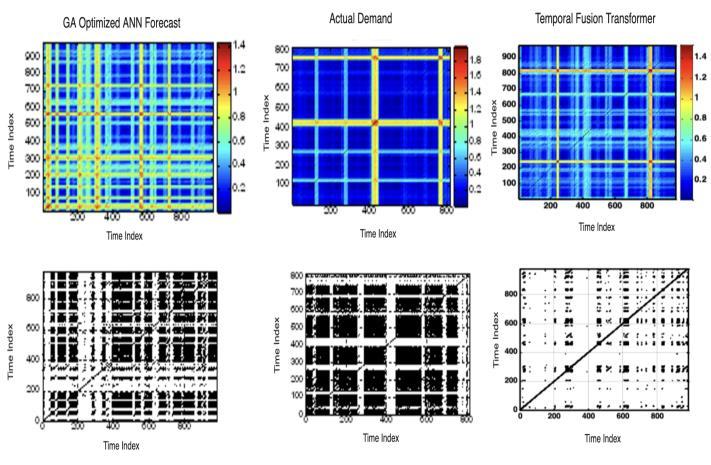
The patterns along the vertical segments between two consecutive marked time indices are similar and nearly shiftedversionsofeachother,suggestingthattherecurrence patternsfromtheGAoptimizedANNmodelcloselycapture thedynamicsoftheactualdatacomparedtotheTFTmodel.
This article presents a study that aims to enhance supply chain resilience through the implementation of advanced demandforecastingtechniquesutilizinggeneticalgorithmoptimized deep artificial neural networks and fuzzy clustering. The research adopts an empirical approach, constructingmachinelearninganddeeplearningmodelsto predict demand fluctuations. The results indicate that the optimized deep neural network regression model, refined using a genetic algorithm, outperforms other models in forecastingdemand.Thefindingsunderscorethesignificant role of machine learning and deep learning techniques in improving prediction accuracy and providing valuable insightsforstrategicplanningandprocurement.Thestudy classifies products into three categories based on market availabilityandvariability,anditevaluatestheaccuracyof variousstate-of-the-artforecastingtechniquesinpredicting demandseriesacrossdifferentlevelsofvariability.Overall, the study showcases the potential of artificial intelligence methods to strengthen supply chain resilience through improveddemandforecasting.
TherecurrenceplotsinFig.7showthecomplexandirregular texture patterns of demand from the GA optimized ANN, actuals,andTFTmodel.TheplotfromtheGAoptimizedANN modelandtheactualdemandexhibitscomplexandintriguing patterns,whiletheTFTmodelrevealshighnoise.Theblue andyellowshadesintheplotindicatethenonstationaritiesin the signal. The GA optimized ANN model captures the underlying patterns of the measured demand data more accuratelythantheTFTmodel.Thecolormapindicatesthe recurrencepointsidentifiedatdifferentneighborhoodsizes.
Thestudyaimstoenhancetheprecisionofdemand forecasting in supply chain management using advancedtechniques.
The study adopts an empirical approach and constructs Machine Learning and Deep Learning modelstopredictdemandvariations.
The optimized Deep ANN Regression model, finetunedusingaGeneticAlgorithm,outperformsother modelsinforecastingdemand.
AfuzzyclusteringandGeneticAlgorithm-optimized Deep ANN model categorizes products based on variationsindemand.
The findings provide crucial knowledge for management involved in strategic planning and procurement.
[1] O'Neal, T. R. (2021). Sortie-based aircraft component demandratetopredictrequirements.JournalofDefense Analytics and Logistics, 5(2), 214-223. https://doi.org/10.1108/jdal-10-2021-0009
[2] Wan,X.andEvers,P.T.(2011).Supplychainnetworks withmultipleretailers:atestoftheemergingtheoryon inventories, stockouts, and bullwhips. Journal of Business Logistics, 32(1), 27-39. https://doi.org/10.1111/j.2158-1592.2011.01003.
[3] Yuan,X.,Zhang,X.,&Zhang,D.(2020).Analysisofthe impact of different forecasting techniques on the inventorybullwhipeffectintwoparallelsupplychains withacompetitioneffect.JournalofEngineering,2020, 1-28.https://doi.org/10.1155/2020/2987218
[4] Aamer, A. M., Yani, L. E., & Priyatna, I. A. (2020). Data analytics in the supply chain management: Review of machine learning applications in demand forecasting. Operations and Supply Chain Management: An International Journal, 1-13. https://doi.org/10.31387/oscm0440281
[5] Yani, L. P. E. and Aamer, A. M. (2022). Demand forecastingaccuracyinthepharmaceuticalsupplychain: a machinelearning approach. International Journal of PharmaceuticalandHealthcareMarketing,17(1),1-23. https://doi.org/10.1108/ijphm-05-2021-0056
[6] Miyaoka,J.,andHausman,W.H.(2008).Howimproved forecasts can degrade decentralized supply chains. Manufacturing&Amp;ServiceOperationsManagement, 10(3), 547-562. https://doi.org/10.1287/msom.1070.0181
[7] Zhang, X. and Zhao, Y. (2009). The impact of external demand information on parallel supply chains with interacting demand. Production and Operations Management, 19(4), 463-479. https://doi.org/10.1111/j.1937-5956.2009.01114.
[8] Vikas,U.,Sunil,K.,Hallikar,R.S.,Deeksha,P.,&P,R.K. (2021).Acomprehensivestudyondemandforecasting
methodsandalgorithmsforretailindustries.Journalof University of Shanghai for Science and Technology, 23(06), 409-420.
https://doi.org/10.51201/jusst/21/05283
[9] Yuan,X.G.,andZhu,N.(2016).Bullwhipeffectanalysis in two-level supply chain distribution network using different demand forecasting technology. Asia-Pacific Journal of Operational Research, 33(03), 1650016.
https://doi.org/10.1142/s0217595916500160
[10] Miyaoka, J., and Hausman, W. H. (2004). How a base stock policy using "stale" forecasts provides supply chainbenefits.Manufacturing&Amp;ServiceOperations Management, 6(2), 149-162.
https://doi.org/10.1287/msom.1030.0034
[11] Michna,Z.,Disney,S.M.,&Nielsen,P.(2020).Theimpact of stochastic lead times on the bullwhip effect under correlated demand and moving average forecasts. Omega, 93, 102033.
https://doi.org/10.1016/j.omega.2019.02.002
[12] Wagner,M.G.(2010).Forecastingdailydemandincash supply chains. American Journal of Economics and Business Administration, 2(4), 377-383.
https://doi.org/10.3844/ajebasp.2010.377.383
[13] Zhang,X.(2004).Evolutionofarmademandinsupply chains. Manufacturing &Amp; Service Operations Management, 6(2), 195-198.
https://doi.org/10.1287/msom.1040.0042
[14] Junaid, M., Xue, Y., Syed, M. W., Li, J. Z., & Ziaullah, M. (2019).Aneutrosophic ahp andtopsis framework for supplychainriskassessmentinautomotiveindustryof Pakistan.Sustainability,12(1),154.
[15] G ž V ž ė E &N v V (2019) Forecasting accuracy influence on logistics clusters activities: The case of the food industry.Journal of CleanerProduction,240,118225.
[16] Weskamp,C.,Koberstein,A.,Schwartz,F.,Suhl,L.,&Voß, S. (2019). A two-stage stochastic programming approach for identifying optimal postponement strategies in supply chains with uncertain demand.Omega,83,123-138.
[17] Ge, D., Pan, Y., Shen, Z. J., Wu, D., Yuan, R., & Zhang, C. (2019). Retail supply chain management: A review of theoriesandpractices.JournalofData,Informationand Management,1(1-2),45-64.
[18] Gholami-Zanjani, S. M., Klibi, W., Jabalameli, M. S., & Pishvaee, M. S. (2021). The design of resilient food supply chain networks prone to epidemic disruptions.International Journal of Production Economics,233,108001.
[19] Yuan,M.,Zhang,H.,Wang,B.,Zhang,Y.,Zhou,X.,&Liang, Y. (2020). Future scenario of China's downstream oil reform:Improvingtheenergy-environmentalefficiency of the pipeline networks through interconnectivity.EnergyPolicy,140,111403.
[20] Siagian,H.,Tarigan,Z.J.H.,&Jie,F.(2021).Supplychain integrationenablesresilience,flexibility,andinnovation to improve business performance in COVID-19 era.Sustainability,13(9),4669.
[21] Tarigan, Z. J. H., Siagian, H., & Jie, F. (2021). Impact of internal integration, supply chain partnership, supply chainagility,andsupplychainresilienceonsustainable advantage.Sustainability,13(10),5460.
[22] Sardar, S. K., Sarkar, B., & Kim, B. (2021). Integrating machine learning, radio frequency identification, and consignmentpolicyforreducingunreliabilityinsmart supplychainmanagement.Processes,9(2),247.
[23] Ivanoska-Dacikj, A., Oguz-Gouillart, Y., Hossain, G., Kaplan,M.,Sivri,Ç.,Ros-Lis,J.V.,...&Sarac,A.S.(2023, April).AdvancedandSmartTextilesduringandafterthe COVID-19 Pandemic: Issues, Challenges, and Innovations. InHealthcare(Vol. 11, No. 8, p. 1115). MDPI.
[24] Mittal, U., & Panchal, D. (2023). AI-based evaluation system for supply chain vulnerabilities and resilience amidstexternalshocks:Anempiricalapproach.Reports in Mechanical Engineering,4(1), 276–289. https://doi.org/10.31181/rme040122112023m\\
[25] Mittal,U.,Yang,H.,Bukkapatnam,S.T.S.,&Barajas,L.G. (2008).Dynamicsandperformancemodelingofmultistagemanufacturingsystemsusingnonlinearstochastic differential equations. 4th IEEE Conf Autom Sci Eng CASE200848090:498–503.

Utkarsh Mittal is a machinelearning manager at Gap Inc., a globalretailcompany.Hehasmore than ten years of experience in machinelearningautomationand isaleaderinbigAI-baseddatabase j H v M ’ degree in industrial engineering with a Supply Chain and Operations Research major from Oklahoma State University, USA. He is closely associated with research groups and editorial boards of high-profile International Journals and research organizations and is
passionateaboutsolvingcomplex business challenges and encouraging innovation through upcoming technologies. He is a SeniormemberofIEEEComputer Society