DESIGN AND SIMULATION OF SOLAR BASED FAST CHARGING STATION FOR ELECTRIC VEHICLE USING MATLAB
Saima Shafi Choudhary1, Er Baljit Kaur 2Post Graduate Student, Electrical Engineering Dept., IET Bhaddal Punjab India. Assistant Professor, Electrical Engineering Dept. IET Bhaddal Punjab India.

Abstract - Thetransitiontowardssustainabletransportation solutions has led to an increased demand for electric vehicles (EVs). One of the critical challenges in EV adoption is the availability of efficient and fast-charging infrastructure. This paper presents the designand simulationofa solar-basedfast charging station for electric vehicles using MATLAB. The proposed system integrates solar photovoltaic (PV) panels, power electronics, energystorage, andchargingmanagement techniques to provide a reliable and sustainable solution. The design process involves selecting appropriate PV panel configurations and sizing them to generate the required power for fast charging. To ensure continuous power availability, an energy storage system, such as batteries, is integratedinto the system. Thepowerelectronicscomponents, including DC-DC converters and inverters, are designed to efficiently manage power flow between the PV panels, energy storage, and the EV charging units. Advanced control strategies are implemented to regulate the charging process, considering factors like battery state of charge, EV battery specifications, and grid interactions.
Key Words: Electric Vehicle Charging Station, Solar EV charging, Wireless EV Charging System, MATLAB EV charging station.
1. INTRODUCTION
With the growing demand for sustainable transportation, electricvehicles(EVs)haveemergedasapromisingsolution to reduce greenhouse gas emissions and combat climate change.ToencouragetheadoptionofEVs,theestablishment of efficient and eco-friendly charging infrastructure is crucial. One innovative approach is the design and simulationofasolar-basedfastchargingstationforelectric vehicles. The goal of this project is to create a charging station that harnesses solar energy to provide fast and renewablechargingsolutionsforEVowners.Byintegrating solar power into the charging station, we aim to reduce dependency on the conventional grid and decrease the carbonfootprintassociatedwithEVcharging.Duringrecent years,therehavebeenchangesinEcuadorabouttheenergy matrix.Newhydropowerprojectshavebeencarriedoutto reduceCO2emissionsthatpollutetheenvironment.This,in turn,hasopenedrecenttechnologiesinwhichthecountry wantstobeinvolved,suchaselectricvehicles[1],[2]which contribute,amongotherthings,toareductioninpollutionby greenhouse gases [3]. The electric vehicle (EV) revolution
refers to the ongoing global transformation in the automotive industry, characterized by a significant shift towards the adoption of electric vehicles powered by electricityinsteadoftraditionalinternalcombustionengines fueled by gasoline or diesel. This revolution is driven by various factors and has far-reaching implications for the environment, energy consumption, and the automotive sector. The primary driver of the EV revolution is the growing awareness of the environmental impact of fossil fuel-powered vehicles. Electric vehicles produce zero tailpipeemissions,reducinggreenhousegasemissionsand improving air quality in urban areas. Significant advancements in battery technology have led to improvements in EV range, charging speed, and costeffectiveness. Lithium-ion batteries have become the dominanttechnologyforEVs,makingthemmorepractical andattractivetoconsumers.Manygovernmentsaroundthe world have implemented policies, incentives, and regulations to promote the adoption of electric vehicles. These measures include financial incentives, tax credits, rebates,andstricteremissionsstandardsforconventional vehicles.Thecostofbatteryproductionhasbeendecreasing steadily over the years, making electric vehicles more affordableforconsumers.Aseconomiesofscalecontinueto drive down battery costs, EVs are becoming more competitive with internal combustion engine vehicles in terms of upfront prices. Technological advancements in electric drivetrains, charging infrastructure, and autonomous driving features have made electric vehicles more appealing and convenient to consumers. Growing public awareness of climate change and environmental issues,coupledwithapositiveperceptionofEVsasfuturistic andeco-friendlyvehicles,hasdrivenconsumerinterest in electricmobility.
2. RELATED WORK
Therehavebeenvariousresearchstudies,pilotprojects,and developments related to solar-powered microgridconnectedwirelesselectricvehicle(EV)chargingsystems. Belowaresomekeyexamplesofexistingworkinthisarea: With the increasing interest in green technologies in transportation,plug-inhybridelectricvehicles(PHEV)have proven to be the best short-term solution to minimize greenhousegasemissions[1].In[2]Electricvehiclecharging infrastructure is hitting the stage where its impact on the performanceandoperationofpowersystemsbecomesmore
andmorepronounced.ConceptofV2G(VehicletoGrid)that electricvehiclescouldactasanewpowersourceforthegrid wasproposed[3].AsolarPVpowersystemconsistsofaPV Module,aDC-DCboostconverter,andanAdaptiveNeuroFuzzy Inference System (AN FIS) based MPPT controller developedinMATLAB/Simulink[4].[5]presentsawireless charginginfrastructurebasedonInductivePowerTransfer (IPT) for semi-fast charging of light-duty (LD) EVs. [5][6] presentsanactivebalancingtopologyforlarge-scalebattery packsinaheavyelectricvehicle.Inordertoinvestigatethe performanceofthesystem,abatterypackandBidirectional Flyback Converter (BiFLC) based active balancing circuit equippedwithSwitchMatrix(SwM)havebeensimulatedby using MATLAB/Simulink. A charge transfer bus, which is supplied by the first cell of the battery pack, is used to transferenergybetweenthesource/destinationcells.Thus, theneedfortheauxiliarycircuit/batteryiseliminated.the existing research fails to adopt differentiated dynamic electricity price to guide the orderly charging of electric vehiclesanddissipatethephotovoltaicoutput,astrategyof vehicle and network interaction based on electric vehicle (EV)chargingloadspacetransferisproposed[7].Finally,the effectivenessoftheproposedmethod[8][9]isverifiedbya practical example. Implementation of a suitable DC-DC converterforchargingthebatteryplaysacrucialroleinthe pathwayofelectricvehicle(EV)production[10][11]
3. OBJECTIVES AND PROBLEM FORMULATION.
The design objectives of a solar grid-connected electrified roadforwirelesschargingofelectricvehiclesaimtocreatea sustainable and efficient charging infrastructure that integrates renewable energy with smart transportation solutions.Theprimaryobjectiveistoharnesssolarenergy through photovoltaic(PV) panelsintegratedinto the road infrastructure.Thisrenewableenergywillbeusedtocharge electric vehicles wirelessly, reducing dependency on nonrenewable energy sources and lowering greenhouse gas emissions[11][12].ThesolarPVarraysmustbedesignedto maximizeenergygenerationefficiency,consideringfactors likesolarpanelorientation,tiltangle,andshadinganalysisto optimizesolarexposurethroughouttheday.Theelectrified road should be connected to the electrical grid, allowing surplusenergygeneratedbythesolarpanelstobefedback intothegridwhenthedemandisloworstoredforlateruse. Additionally,whensolarenergyproductionisinsufficient, thegridcansupplyadditionalpowertomeetthechanging demands of electric vehicles. The wireless charging technologyusedontheroadshouldbeefficientandcapable of delivering power wirelessly to vehicles in a safe and controlledmanner.Itshouldsupportvariouselectricvehicle models and charging standards. Implementing smart charging solutions can optimize the charging process by consideringfactorslikeenergydemand,electricitypricing, and grid conditions. Smart charging can also prioritize chargingforvehiclesbasedontheirbatterylevelsandusage patterns.
The primary objective of this project is to develop a solar grid-connectedelectrifiedroadsystemthatenableswireless chargingofelectricvehicles(EVs)whiletheyareinmotion orstationery.Thegoalistocreateasustainableandefficient charginginfrastructurethatpromoteswidespreadadoption ofEVsandreducesthedependenceontraditionalfossil-fuelbased transportation. The project aims to design and implementasolarphotovoltaic(PV)arraysystemalongthe road's surface or in adjacent structures to harvest solar energy. The challenge lies in optimizing the PV system's efficiency, considering factors like varying sunlight conditions, shading, weather patterns, and the road's availablesurfaceareaforsolarpanels.Efficientintegration ofthesolarenergygeneratedwiththeexistingpowergridis crucialtoensureacontinuousandreliablepowersupplyfor the charging system. The development of a robust and efficient wireless charging system is a core aspect of the project.Thewirelesscharginginfrastructuremustbeableto transferpowereffectivelytoEVsmovingatvariousspeeds while ensuring safety and minimizing energy losses. The system should also support bi-directional power transfer, allowing EVs to feed excess energy back to the grid when needed, contributing to grid stability. Designing an electrified road surface that can accommodate wireless chargingwithoutcompromisingroadsafetyandintegrityisa significantchallenge.Theprojectshouldconsidertheroad's durability,abilitytowithstandheavytraffic,andtheimpact of weather conditions on the charging efficiency. Safety standards and protocols for electrified roads must be establishedtopreventaccidentsandensurepublictrustin technology. Achieving high charging efficiency is vital to minimize energy losses during wireless charging. Additionally,theprojectshouldaddressthegrid'scapability to manage the increased load from multiple EVs charging simultaneously, especially during peak hours. Energy storagesystems,suchasbatteriesorsupercapacitors,might be integrated to buffer the grid and improve charging efficiency.Theprojectshouldperformacomprehensivecost analysis, considering the installation, maintenance, and operationalcostsofthesolargrid-connectedelectrifiedroad system. An economic feasibility study will help determine thereturnoninvestmentandassessthesystem'spotential forcommercialdeployment.Evaluatingtheenvironmental benefits of the solar grid-connected electrified road is essential.Theprojectshouldconductalife-cycleassessment tocomparethesystem'scarbonfootprintwithconventional chargingmethodsandinternalcombustionenginevehicles. Additionally, addressing potential environmental impacts, suchaslanduseandrecyclabilityofcomponents,iscrucial forlong-termsustainability.Theprojectneedstoconsider existing regulations and policies related to road infrastructure, electric vehicle charging, and renewable energy integration. Identifying any legal barriers or incentivescanhelpguidetheproject'simplementationand ensurecompliancewithrelevantstandards.
4. METHODOLOGY.
Thewirelesschargingsystemforelectricvehiclestypically consistsoftwomaincomponents:
4.1. Charging Pad Transmitter Coil:
This component is installed on the ground or inside a charging station. It is responsible for generating an alternatingmagneticfieldusinganalternatingcurrent(AC) powersourceasshowninfigurebelow.
The process of wireless power transfer in electric vehicle charginginvolvesthefollowingsteps:


1. ThechargingstationisconnectedtoanACpower supplyorasolarconnectedmicrogrid.
2. The AC power from the supply is converted to a higher frequency AC using power electronics, typicallyintherangeoftenstohundredsofkilohertz.
3. Thehigh-frequencyACisfedintothechargingpad transmitter coil, which generates an alternating magneticfieldaroundit.
4. When the electric vehicle is parked over the charging pad, the receiver coil in the vehicle's undercarriage is brought into proximity with the magnetic field. As a result of electromagnetic induction, an electrical current is induced in the receivercoil.
5. Theinducedcurrentinthereceivercoilisrectified andconverted to direct current (DC)using power electronics.
6. TheDCelectricityisthenusedtochargetheelectric vehicle'sbattery,whichpowersthevehicle'selectric motor.
5. RESULTS.
Designingandsimulatingasolarenergy-basedfastcharging station for electric vehicles using MATLAB would involve variousstepsandcomponents,suchassolarpanels,battery storage,powerelectronics,andcontrolsystems.
structures
4.2. Vehicle Receiver Coil:
Thiscomponentisintegratedintotheelectricvehicleandis positionedunderneaththevehicle'schassis.Thereceivercoil isdesignedtopick upthemagneticfieldgenerated bythe charging pad and convert it back into electrical energy as showninfigurebelow.
Theexperimentalandsimulatedresultsobtainedduringthe projectworkarebrieflyexplained.
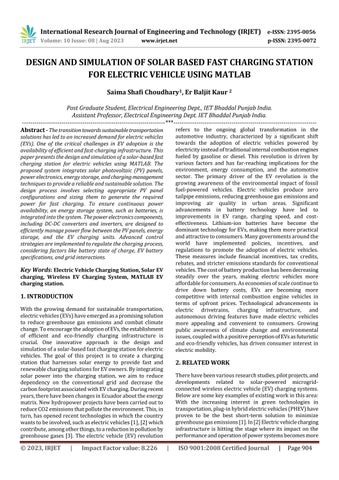
Figure 1:Simulationmodelofthewirelesspower transmitterandReceiverina3-DimensionalCoordinate system.
Figure 2: Theproposedsystemisintendedfortherearof anEV.Eachchargingpadiscomposedoftwocoils:adc andaccoil.
Figure 3: PVCellOutputPowervs.Intensityand Temperature
Iph:Photocurrent,thecurrentproducedbythePVcellwhen illuminated.
I0: Saturation current, a parameter related to the cell's intrinsicproperties.
n:Idealityfactor,representingthenon-idealbehaviorofthe cell.
Rs: Seriesresistance,representinginternallosses.
Rsh: Shuntresistance,alsorelatedtointernallosses.
k: Boltzmannconstant,involvedinthetemperatureeffect.
T: TemperatureinKelvin.
q: Elementarycharge,relatedtoelectronmovement.
A: AreaofthePVcell.
G: Sunlightintensity(W/m^2),rangingfrom0to1000.
Tc: TemperatureinCelsius,rangingfrom0°Cto100°C.
Figure 3. calculates the output power of the PV cell for different combinations of sunlight intensity (G) and temperature(Tc).Foreachcombination
solarpanels.ThisenergyisusuallymeasuredinWatt-hours (Wh) or kilowatt-hours (kWh). Each point on the y-axis correspondstotheamountofenergygeneratedbythesolar panelsduringaspecifictimeinterval.Thelineonthegraph representsthetrendofgeneratedsolarenergythroughout theday.Ittypicallyrisesasthesuncomesup,reachesapeak around midday when sunlight is the strongest, and then decreasesasthesunsets.Thislinehelpsvisualizehowsolar energy generation varies based on daylight hours and sunlightintensity.
Figure4.(b).showshowmuchenergyisusedtochargean electric vehicle over a specific period. Like the previous graph,thex-axisrepresentstime,andthey-axisrepresents energy,usuallymeasuredinWatt-hours(Wh)orkilowatthours(kWh).Likethepreviousgraph,thex-axisrepresents time intervals, usually in hours. The points on the x-axis correspond to different times throughout the day. The vertical axis represents the cumulative amount of energy usedtochargetheelectricvehicle.Thisisthetotalenergy transferredtothevehicle'sbattery.Itincreasesovertimeas the vehicle charges. The line on the graph represents the trendofchargedenergyovertime.Itstartsatzero(whenthe charging begins) and increases as the vehicle's battery charges.Theslopeofthelineindicatesthechargingrate;a steeperslopeindicatesfastercharging.
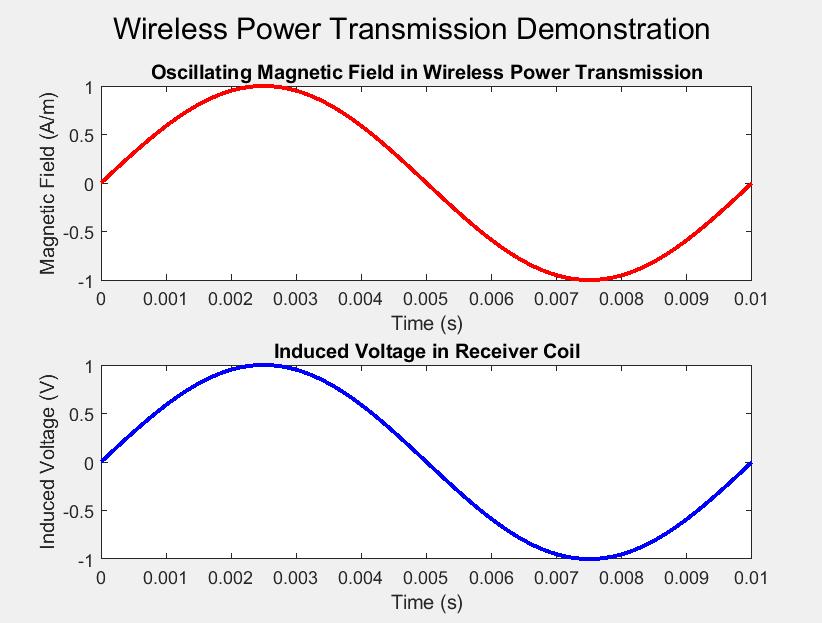
Figure 4: SolarEnergyGenerationandVehicleCharging. a).GeneratedSolarEnergyvs.Time.b).VehicleCharged Energyvs.Time

Figure 4. (a). illustrates how the amount of solar energy producedbysolarpanelschangesoveraspecificperiod.The x-axisrepresentstime,usuallymeasuredinhours,whilethe y-axis represents the amount of energy generated by the solar panels, typically measured in Watt-hours (Wh). The horizontal axis represents time. Each point on the x-axis correspondstoaspecifictimeinterval,ofteninhours.The verticalaxisrepresentstheamountofenergygeneratedby
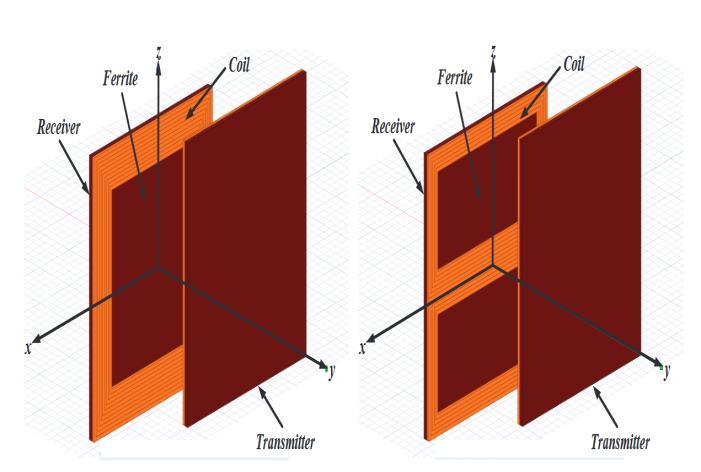
Figure5(a)generatesanoscillatingmagneticfield, which represents the electromagnetic waves generated by the transmitter coil in a wireless power transmission system. Themagneticfield'sstrengthvariessinusoidallyovertime. Thisfieldiswhatinducesthevoltageinthereceivercoil.
In Figure 5 (b). The induced voltage in the receiver coil is calculatedusingFaraday'slawofelectromagneticinduction. Theinducedvoltageisproportionaltotherateofchangeof
Figure 5. WirelessPowerTransmissiona).Oscillating MagneticFieldinWirelessPowerTransmission.b). InducedVoltageinReceiverCoil.themagneticfieldstrength.Asthemagneticfieldoscillates,it inducesacorrespondingvoltageinthereceivercoil.
Comparingdifferentpowertransfertechniquesforasolarbasedwirelesselectricvehiclechargingsystemcaninvolve various parameters and factors. Figure 5.6. illustrates a graphical comparison of two hypothetical power transfer techniques: Inductive Power Transfer (IPT) and Resonant InductiveCoupling(RIC).
For example, if a battery's maximum capacity is 100 kWh anditcurrentlyholds50kWh,theSoCwouldbe50%.
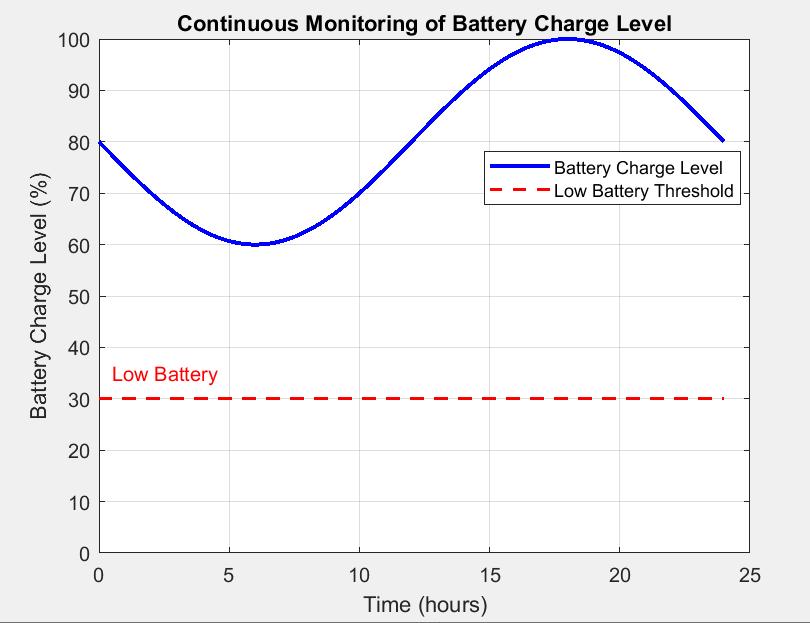
Battery charge level is a critical parameter in electric vehiclesandotherbattery-poweredsystems.Ithelpsusers understand how much energy is available for use and whetherthebatteryneedscharging.Monitoringthebattery's charge level helps prevent over-discharging, which can damage the battery, and ensures the vehicle or system is operatedwithinitssafeandefficientrange.
In Figure 6 (a). The x-axis represents time, typically measuredinseconds.They-axisrepresentspower,typically measuredinwatts(W).Twolines,oneinred(IPT)andone inblue(RIC),representthepowerprofilesoftwodifferent power transfer techniques. These profiles show how the powerbeingtransferredbetweenthechargingstationand theEVchangesovertime.Thisgraphillustratesthedynamic nature of power transfer using these techniques. You can observe the fluctuating power levels over the given time interval.InFigure6(b).Thex-axisrepresentsthetwopower transfer techniques, namely "IPT" (Inductive Power Transfer)and"RIC"(ResonantInductiveCoupling).Theyaxisrepresentsefficiency,oftenindecimalform(e.g.,0.85 for85%).Twobars,onecorrespondingtoIPTandtheother to RIC, show the efficiency of each technique. This graph allows you to quickly compare the efficiency of the two techniques. Higher efficiency indicates a more effective utilizationofthetransferredpower.
In Figure 7 (a). Battery charge level, often referred to as State of Charge (SoC) is illustrated, which indicates the amount of energy stored in a battery compared to its maximumcapacity.It'susuallyexpressedasapercentage.
In Figure 7 (b). The low battery threshold is a predefined value of battery charge level, usually expressed as a percentage,belowwhichthesystemconsidersthebatteryto belowoncharge.It'sacriticalpointusedtotriggervarious actions, such as warnings to the user, energy-saving measures,orinitiatingcharging.Forinstance,alowbattery threshold set at 20% might indicate that the battery is running low, prompting the user to charge the vehicle or takemeasurestoconserveenergy.
5. CONCLUSIONS
ThisstudyshowcasesthesuccessfulintegrationofMATLABbased simulation techniques in designing a fast-charging stationforelectricvehicles.Thesimulationresultsprovide valuableinsightsintothestation'sperformance,efficiency, safety, and grid compatibility. As the world transitions towardsamoresustainabletransportationecosystem,the developmentofreliableandefficientcharginginfrastructure, as demonstrated in this study, plays a pivotal role in acceleratingtheadoptionofelectricvehicles.
REFERENCES
[1].M.C.Kisacikoglu,A.Bedir,B.Ozpineci,andL.M.Tolbert, “PHEV-EVchargertechnologyassessmentwithanemphasis on V2G operation,” Oak Ridge Nat. Lab., Tech. Rep. ORNL/TM-2010/221,Mar.2012.
2023, IRJET | Impact Factor value: 8.226 | ISO 9001:2008 Certified Journal | Page908
Figure 6:ComparisonofPowerTransferTechniquesfor Solar-BasedWirelessEVCharginga).Comparisonof PowerTransferTechniquesb).EfficiencyComparison
Figure 7: ContinuousMonitoringofBatteryChargeLevel a).BatteryChargeLevelb).LowBatteryThreshold
[2]. D. Berjoza and I. Jurgena, “Analysis of distribution of electric vehicle charging stations in the Baltic,” Eng. Rural Develop.,vol.14,no.January,pp.258–264,2015.
[3]I.Zenginis,J.S.Vardakas,N.Zorba,andC.V.Verikoukis, “Analysisandqualityofserviceevaluationofafast-charging stationforelectricvehicles,”Energy,vol.112,pp.669–678, 2016.
[4]P.Fan,B.SainBayar,andS.Ren,“Operationanalysisof fastchargingstationswithenergydemandcontrolofelectric vehicles,” IEEE Trans. Smart Grid, vol. 6, no. 4, pp. 1819–1826,2015.
[5] K. Yunus, H. Z. De La Parra, and M. Reza, “Distribution grid impact of plug-in electric vehicles charging at fast chargingstationsusingstochasticchargingmodel,”inProc. 14thEur.Conf.PowerElectron.Appl.,Aug2011.
[6]E.Akhavan-Rezai,M.F.Shaaban,E.F.El-Saadany,andA. Zidan,“Un-coordinatedchargingimpactsofelectricvehicles on electric distribution grids: Normal and fast charging comparison,” in IEEE Power Energy Soc. General Meeting, July2012.
[7]Q.Yang,S.Sun,S.Deng,Q.Zhao,andM.Zhou,“Optimal sizingofPEVfastchargingstationswithmarkoviandemand characterization,”IEEETrans.SmartGrid,inpress.
[8]C.FarkasandM.Telek,“Capacityplanningofelectriccar charging station based on discrete time observations and map(2)/g/cqueue,”Period.Polytech.,Electr.Eng.Comput. Sci.,vol.62,no.3,pp.82–89,2018.
[9] E. Wood, S. Raghavan, C. Rames, J. Eichman, and M. Melaina, “Regional charging infrastructure for plug-in electricMassachusetts,”Nat.RenewableEnergyLab.(NREL), Golden,CO,Tech.Rep.DOE/GO-102016-4922,2017.
[10] E. Wood, C. Rames, M. Muratori, S. Raghavan, and M. Melaina, “Na- tional plug-in electric vehicle infrastructure analysis,”Nat.RenewableEnergyLab.(NREL),Golden,CO, Tech.Rep.DOE/GO-102017-5040,2017.
[11] U.S. Dept. Transport., “Smart city challenge,” https://www. transportation.gov/smart city, [Online; accessed09-Aug-2018].
[12] Alternative Fuels Data Center, “Electric vehicle infrastructure projection tool (evi-pro) lite,” https://www.afdc.energy.gov/evi-pro-lite,[Online;accessed 09-Aug-2018].
[13]H.Zhang,Z.Hu,Z.Xu,andY.Song,“Optimalplanningof PEV charging station with single output multiple cables charging spots,” IEEE Trans. Smart Grid, vol. 8, no. 5, pp. 2119
2128,2017.
[14]Y.Xiang,J.Liu,R.Li,F.Li,C.Gu,andS.Tang,“Economic planning of electric vehicle charging stations considering traffic constraints and load profile templates,” Applied Energy,vol.178,pp.647–659,2016.