Fuzzy Logic Modelling for Disease Severity Prediction in Cotton Crop using Weather Parameters
Kiran Devi1, Vikash Siwach2, Manju Singh Tonk3, Anu41,2,3,4 Department of Mathematics & Statistics, COBS&H, CCS HAU, Hisar
Abstract - The relationship between weather parameters and disease severity has long been established. Disease severity measurement in crops is a major challenge, as it plays a crucial role in yield estimation and determining the control factors necessary to enhance crop productivity. Mathematical models assist in disease severity assessment and management. Fuzzy logic models provide a flexible framework for dealing with imprecise and uncertain input, making them suited for modelling complicated relationships in real-world systems. Cotton leaf curl disease (CLCuD) is a viral disease that affects cotton plants and it is a significant threat to cotton production in many regions in India In this study, a fuzzy logic system (FLS) based model has been proposed for prediction of disease severity based on potential weather variables such as temperature, relative humidity, sunshine and rainfall etc. which are indicators of disease severity. This model has been using comprehensive weather dataset and corresponding disease severity levels for model formulation, training and validation. Different performance indicators, including accuracy, precision, recall, and F1-score, were used to evaluate the model's predictive ability. Furthermore, sensitivity analysis was performed to identify the most influential weather parameters in disease severity prediction. The experimental results demonstrated that the developed FLS achieved significant accuracy in predicting disease severity based on weather parameters. The model exhibited the ability to capture complex non-linear relationships between weather conditions and disease severity, providing valuable insights for disease management.
Key words: Fuzzy logic system, Cotton leaf curl disease, Disease severity, Weather parameters, Sensitivity analysis etc.
1. INTRODUCTION
A mathematical paradigm for thinking in the presence of uncertainty and ambiguity is fuzzy logic [1]. It's particularly helpful when dealing with complex and imprecise data that can't be expressed easily using standard binary logic. Fuzzy logic, rather than using firm true or false values, provides a mechanism to handle and manipulate this uncertain data. Control systems, pattern recognition, decision-making systems, expert systems, and automotive systems are all applications of fuzzy logic models. They're employed in a variety of applications, including industrial process control, robotics, image processing, voice recognition, and automobile control systems [2]. Fuzzy logic is a versatile and robust methodfordealingwithuncertaintyandimprecisioninavarietyoffields.
Agriculture has a crucial part in the Indian economy because it directly or indirectly supports more than half of the country's population [3]. The agricultural sector in India is noted for its size and production, which can be linked to the country's unique agro-climatic conditions. Despite its economic importance, farmers encounter numerous hurdles in increasing crop yields. Numerous efforts have been made to identify the primary causes causing poor crop productivity. Pest and disease modelling using diverse methodologies is one key approach to reducing the influence on agricultural yields[4] Usingcutting-edgetechniques,agriculturalforecastingapproaches,includingpestanddiseaseforecasting,have been developed recently [5], [6] In addition, internet-based forecasting tools and decision support systems have been introduced to successfully predict and manage crop diseases [7], [8]. Furthermore, advances in dispersal modelling and projected meteorology have aided in disease warnings and allowed farmers to adopt preventive actions [9], [10], [11] These collaborative activities aim to assist Indian farmers in overcoming barriers and increasing crop yield in a sustainablemanner.
Indiaistheworld'ssecond-largestproducerofcotton,afterChina.CottonhasbeencultivatedinIndiaforcenturies,andit plays a significantroleinthecountry'sagricultural sectorandeconomy [12].Thecountryaccountsforabout25%ofthe globalcottonproduction.Theproductionof cottoninIndiahasbeensteadilyincreasingovertheyears.Inthe2020-2021 season, India produced approximately 30 million bales (each weighing 170 kilograms) of cotton. India cultivates various cotton varieties, including both hybrid and genetically modified (GM) cotton. Cotton cultivation in India faces several challenges,includingpestsanddiseases,waterscarcity,fluctuationsinmarketprices,andtheavailabilityofqualityseeds [13]. Pest management, irrigation facilities, and access to credit for farmers are areas of continuous focus for improving cottonproduction.

Asevereviralhazardtoplantsinthecottoncrop,cottonleafcurldisease(CLCuD)offersaconsiderablechallengeto cotton production in numerous Indian states. The adverse effects of this disease result in reduced crop yield and significant economic losses for farmers. Understanding the contributing factors to disease severity is essential for implementing effective disease management and crop protectionstrategies [15]. Management of CLCuD involves a combination of cultural, chemical, and genetic strategies [16]. Cultural practices such as crop rotation, removal of infected plants, and timelysowingcanhelpreducethediseaseincidence.Chemicalcontrolthroughtheuseofinsecticidestomanagewhitefly populations is also employed, although it must be done judiciously to avoid the development of insecticide resistance. Additionally,thedevelopmentandcultivationofgeneticallymodified(GM)cottonvarieties,suchasBtcotton,whichcarry genes for resistance against CLCuD, have proven effective in mitigating the disease's impact. Ongoing research and monitoring are essential to understand the epidemiology of CLCuD, identify new virus strains, and develop improved management strategies. By addressing the challenges posed by CLCuD, researchers and farmers aim to sustain cotton productionandsafeguardthelivelihoodsofthoseinvolvedinthecottonindustry.
Theassessmentofdiseaseseverityincropshaslongbeenintertwinedwiththeinfluenceofweatherparameters,asthey play a vital role in quantitatively predicting yield and determining the necessary control factors to enhance crop productivity[17].Mathematicalmodelshaveemergedasvaluabletoolsfordiseaseseverityassessmentandmanagement, providing a means to capture complex relationships within real-world systems [18]. Weather parameters are most important factor for disease severity in crops, predicting crop yield and implementing effective control measures [19]. Predicting disease severity in cotton crops is also crucial for cotton farmers and the industry [20]. It enables timely interventions to mitigate yield losses and optimize resource allocation based on disease severity. Understanding disease severitypatternshelpsimprovepestmanagementstrategiesandreducecosts,contributingtotheeconomicsustainability ofcottonfarming[21].Diseaseseveritypredictionsaidincropplanninganddecision-making,ensuringoptimalyieldsand minimizingtheimpactofdiseases.Furthermore,accurateseveritypredictionsfacilitatebreedingprogramsfordeveloping disease-resistant cotton varieties, enhancing the long-term viability of cotton production. Disease severity prediction is important in effective disease management, maximizing profitability, and ensuring the success of the cottonindustry. Accurately measuring disease severity in crops presents a significant challenge for agricultural researchers and practitioners.
Fuzzy logic plays a significant role in the prediction of disease severity [22] particularly when dealing with complex and uncertaindata.Fuzzylogicisamathematicalframeworkthatallowsyoutorepresentanddealwithunclearandill-defined data. When exact mathematical models aren't appropriate or practical, it offers a flexible approach to modelling and decision-making. When applied to the prediction of disease severity, fuzzy logic models utilize fuzzy sets and linguistic variablestocapturetheinherentuncertaintyandimprecisionintherelationshipbetweendisease-relatedfactors,suchas weatherparameters,anddiseaseseverity[23].
2. MATERIALS AND METHODS
2.1 DATA
In the developed fuzzy model data were taken from the website Indian Council of Agricultural Research [Ministry of AgricultureandFarmersWelfare]ofcottoncropintheregionHAU,hisar.Weused4 years’datafrom2019to2022inthis paper for the developed model the data include weekly maximum and minimum temperature( c), weekly morning and evening relative humidity (%), weekly rainfall(mm), weekly sunshine(hours), CLCuD incidence (%), Percent Disease Intensity (PDI) on the weekly basis. Further, we divide the data into two parts for training and testing of the developed fuzzylogicmodel.
2.2 Fuzzy Logic System
The fuzzy logic model, which was introduced by Zadeh in 1965, is a mathematical procedure that aims to replicate the humanthoughtprocessusingan'IF-THEN'rulesystem.Thisapproachpermitsforthetranslationofhumanreasoninginto a formal mathematical framework. According to Zadeh [24], successful fuzzy modelling relies on four fundamental componentswhicharerespectively:
(i) Fuzzification:Fuzzificationistheprocessoftransformingtraditionalinputsintofuzzyinputs.Itentailsusingfuzzysets with membership functions to express data as fuzzy values. Typically, these fuzzy sets map data to a region of interest withintherangeof[0,1].ThefuzzysetF Uisgivenby:
WhereaisanyelementofUand ( )isthemembershipfunctionofainF
(ii) Fuzzyrule:Thefuzzyrulebase'ssetofrulesismeanttoaddressawidevarietyofpossiblefuzzyinteractionsbetween input and output variables. The IF-THEN expressions in Equation 2 represent these rules [25]. The quantity of input parametersandtheircorrespondingmembershipfunctionsdeterminesthenumberofrulesinthebase.
(2)
where are the input variables and bis the output variable The linguistic input variables are assumed the terms ,andtherulekusetheindexi.Thelinguisticoutputvariableisassumedtheterm .
(iii) Fuzzy inference engine: As the tactical element in charge of processing all accessible fuzzy rules from the rule base, thefuzzy inference engineplays acritical role.Itsprimaryfunctionistodetermine howtotransforma setofinputsinto the corresponding outputs. It accomplishes this by utilizing IF-THEN rules in conjunction with the connectors "OR" or "AND" to construct critical decision rules [24]. Among the frequently used strategies for the fuzzy inference system, Mamdani [26] and Takagi and Sugeno [27] both proposed two noteworthy methods. Due to their efficiency in handling fuzzy rule-based systems and producing useful output from ambiguous or inaccurate input data, these techniques are widelyused.
(iv) Defuzzification: Defuzzification is the process of converting the inference engine's fuzzy outputs into numerical outputs[28].
2.3 Developing the fuzzy model

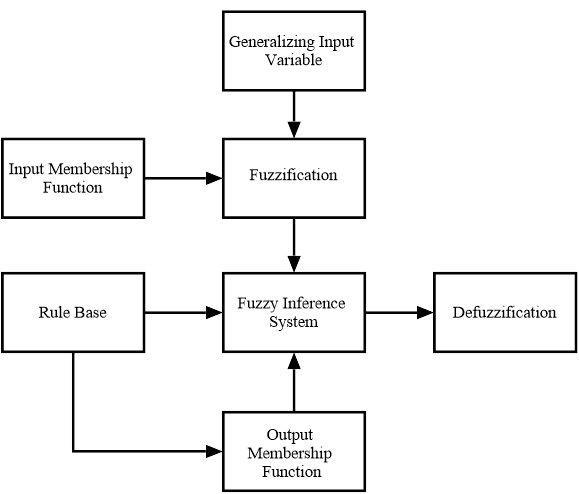
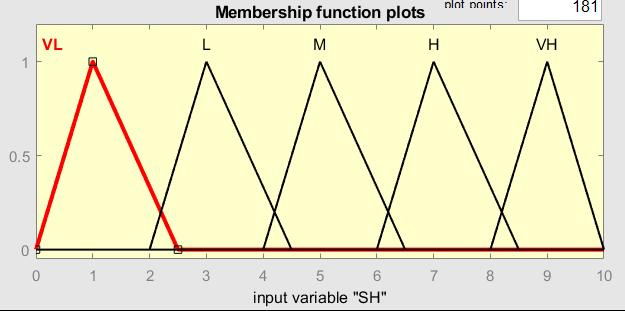
The fuzzy framework was built with the Mamdani minimum-maximum inference engine and the MATLAB fuzzy logic toolbox (Mathworks, 2018). The following input and output variables were taken into account in this model: maximum temperature (Temp Max), minimum temperature (Temp Min), morning relative humidity (RH(M)), evening relative humidity (RH(E)), rainfall RF, sunshine (SH), CLCuD incidence, and PDI. Linguistic phrases were created to explain the inputvariables'fuzzy inputs inorderto representtheinputvariables. Thesedesignations, whichcoveredall conceivable input variations, included "very low" (VL), "low" (L), "medium" (M), "high" (H), and "very high" (VH). Similar to CLCuD incidence,andtheoutputvariableforPDIwasdividedintosevenclassestoaccountforallpossiblefuzzyoutputs:immune (I),highlyresistant(HR),resistant(R),moderatelyresistant(MR),moderatelysusceptible(MS),susceptible(S),andhighly susceptible (HS). The input and output parameters of the fuzzy model were both described by triangular membership functions. The expert's knowledge and the experimental conditions were taken into account while determining the numberandrangeofmembershipfunctions.Aruleeditorwasusedtodevelopthefuzzymodel,whichproduced89rules that represented all of the interactions between the input and output variables. Finally, the Center of Gravity (COG) approach,apopulardefuzzificationtechnique,wasemployedtoprovideareal-valued(numerical)output.


1. If(Temp maxis VH) and (Temp minis H) and (RH(M) isVL) and(RH(E)is VL) and (RF is VL) and(SHis VH) then(DiseaseincidenceisVL)(PDIisI)


2. If(TempmaxisVH)and(TempminisVH)and(RH(M)isVL)and(RH(E)isVL)and(RFisVL)and(SHisVH) then(DiseaseincidenceisVL)(PDIisI)
3. If(Tempmax isH) and(TempminisVH) and(RH(M)isM) and(RH(E)isL) and (RF isL) and(SHisH) then (DiseaseincidenceisVL)(PDIisHR)
50.If(TempmaxisL)and(TempminisH)and(RH(M)isVH)and(RH(E)isM)and(RFisVL)and(SHisH)then (DiseaseincidenceisVH)(PDIisHS)
89.If(TempmaxisVL)and(TempminisL)and(RH(M)isVH)and(RH(E)isM)and(RFisVL)and (SHisL)then (DiseaseincidenceisVH)(PDIisS)
2.4 Criteria for evaluation
The predictive performance of the model was assessed using various performance metrics such as accuracy, precision, recall, and F1-score. Sensitivity Analysis (SA) is a valuable tool for evaluating and comprehending the influence and relativesignificanceofparametersinsidethe modellingprocess.Itisbeneficialtodeterminehowchangesininputvalues affectthemodel'soutputvalues.Thecosineamplitudemethod(CAM)wasemployedinthisstudytoidentifythevariables influencing CLCuD that are most responsive to modification [25]. The level of sensitivity for each input factor was determinedbydeterminingthestrengthofthemagnitude betweentheoutputandthespecificinputparametersunder evaluation. A larger CAM value show the greater impact on output parameters. Consider the 'n' data samples that were gatheredfromthedatasetsthatmadeupthecommondataarrayA,whichisdesignatedas
InthedataarrayA,eachmember isavectorwithlengthm,so
In this case, it is important to think of each data pair and as a point in an m-dimensional space, where each point needs m coordinates for a complete representation. The following equation is used to calculate and depict how strongly certaindatapairsarerelated.
3. RESULTS.AND.DISCUSSION
3.1 Fuzzy Framework
Inthisstudy,wedevelopedafuzzylogicmodeltopredicttheoccurrenceoftheCottonLeafCurlDisease(CLCuD)basedon variousweatherparameters.Themodelachievedanimpressiveaccuracyof90%,indicatingitsabilitytocorrectlyclassify instances as either diseased or non-diseased with a high level of precision. Furthermore, the model exhibited a recall of 100%, suggesting that it effectively identified all true positive cases of CLCuD, thereby minimizing the chances of false negatives. The high precision of 80% implies that when the model predicted an instance to be CLCuD positive, it meant that it was correct 80% of the time. This is crucial in the context of agricultural disease prediction, as false positive predictionscouldleadtounnecessaryandpotentiallycostlytreatmentsforhealthycrops.Themodel'sabilitytoachievea recallof100%isparticularlynoteworthysinceitmeansthatitdidnotmissanycasesofCLCuD,avoidingtheriskoffalse negatives,whichcouldhavedevastatingconsequencesforcrophealthandyield.TheF1scoreprovidesafairevaluationof themodel'soverallperformancebyaccountingforbothfalsepositivesandfalsenegatives.ThehighF1scoreindicatesthat thefuzzylogicmodelstrikesagoodbalancebetweenprecisionandrecall,effectivelycapturingthetrade-offbetweenthese twometrics.TheF1scoreforthismodelwasfoundtobe88%.
3.2 Sensitivity Analysis

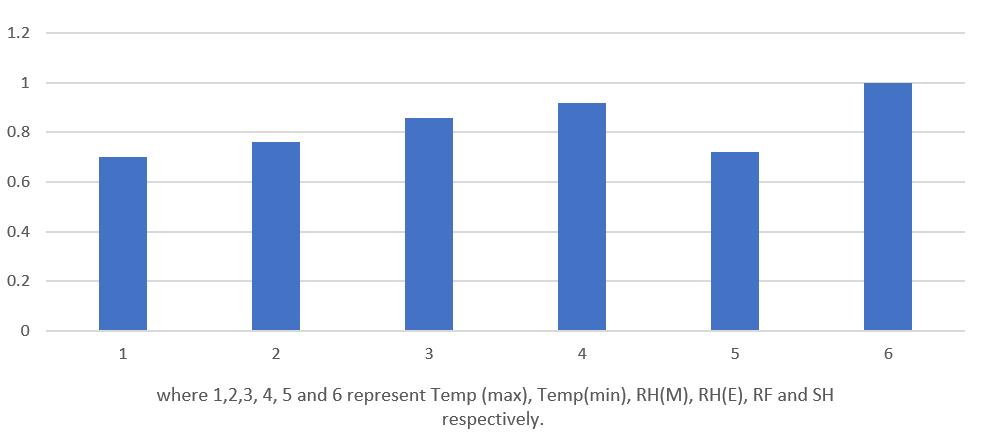
ByutilizingEq.5,acomprehensivesetofsensitivityanalyses(SAs)wasperformedonbothinputandoutputparameters. The CAM method was employed to determine the values of representing the relationships between the predicted values of disease by the fuzzy model and the associated input factors. The results, depicted in Fig. 4, illustrate that the obtained valuesforallinputswereconsistentlycloseto1.Thisindicatesthatallinputfactorsplayanimportantrolein contributingtothedevelopmentofthefuzzymodels.Furthermore,theseresultsemphasizethatalltheinputswerecrucial inpredictingthedisease,andnoparametershouldbeoverlookedordisregarded.
4. FUTURISTIC APPROACH
It is essential to acknowledge the limitations of the study. While the model demonstrated promising accuracy, precision, recall,andF1score,itsperformancecouldstill beaffectedbyvarious factors.Forinstance,theavailabilityand quality of historicaldata,thechoiceoffuzzylogicmembershipfunctions,andtheselectionofweatherparameterscouldallinfluence themodel'soutcomes.Tofurtherenhancethemodel'spredictivecapabilities,futureresearchcouldfocusonincorporating additionaldatasources,suchassoilmoisturelevels,cropmanagementpractices,andgeneticfactorsofthecottonplants. Furthermore, combining ensemble approaches or incorporating machine learning algorithms with the fuzzy logic model mayimproveaccuracyandrobustness.
5. CONCLUSION
The fuzzy logic model successfullypredicted theoccurrenceofCLCuD based on weather parameters with anaccuracyof 90%,aprecisionof80%,arecallof100%,andanF1scoreof88%.Theseresultsunderlinethepotentialoffuzzylogicasa valuable tool in agricultural disease prediction, providing farmers and policymakers with valuable insights to make informed decisions and mitigate the impact of diseases on cotton crops. Nevertheless, continuous refinement and validation of the model are necessary to ensure its reliability and applicability in real-world scenarios. Additionally, the sensitivity analysis carried out in this work offered insightful insights into the robustness of the fuzzy logic model to changesinmeteorologicalfactors.Inthecontextofdiseasepredictionincottoncrops,theresultsofthesensitivityanalysis togetherwiththemodel'sperformanceindicatorsleadtoathoroughreviewandadeeperunderstandingofitscapabilities andlimitations
6. REFERENCES
[1]L.A.Zadeh,“Fuzzysets,”InformationandControl,vol.8,no.3,1965,pp.338-53.
[2]Belohlavek,Radim,JosephW.Dauben,andGeorgeJ.Klir,“FuzzyLogicandMathematics:AHistoricalPerspective,”New York,2017;onlineedn,OxfordAcademic,22June2017,doi:10.1093/oso/9780190200015.001.0001
[3] L. Praburaj, “Role of Agriculture in the Economic Development of a Country,” Shanlax International Journal of Commerce,vol.6,no.3,2018,pp.1-5.
[4] M.Donatelli,R.D.Magarey,S.Bregaglio,L.Willocquet,J.P.M.Whish, and S.Savary, “Modelling the impacts of pests and diseasesonagriculturalsystems,”Agric.Syst,vol.155,2017,pp.213-224.
[5] K. Leksakul, P. Holimchayachotikul, and A. Sopadang, “Forest of off-season longan supply using fuzzy support vector regressionandfuzzyartificialneuralnetwork,”Comput.Electron.Agric.,vol.118,2015,pp.259-269.
[6] M.W. Shi, “Based on time series and RBF network plant disease forecasting,” Procedia Eng., vol. 15, 2011, pp. 23842387.
[7] W. Pavan, C.W. Fraisse, and N.A. Peres, “Development of a web – based disease forecasting system for strawberries,” Comput.Electron.Agric.,vol.75,no.1,2011,pp.169-175.
[8] I.M. Small, L. Joseph, and W.E. Fry, “Development and implementation of the BlightPro decision support system for potatoandtomatolateblightmanagement,”Comput.Electron.Agric.,vol.115,2015,pp.57-65.
[9]K.A.Garrett,S.P.Dendy,E.E.Frank,M.N.Rouse,andS.E.Travers,“Climatechangeeffectsonplantdisease:genomesto ecosystem,”Annu.Rev.Phytopathol.,vol.44,2006,pp.489-509.
[10] P. Skelsey, G.J.T. kessel, A.A.M. Holtslag, A.F. Moene, and W. Van Der Werf, “Regional spore dispersal as a factor in diseaseriskwarningsforpotatolateblight:aproofofconcept,”Agric.For.Meteorol.,vol.149,2009,pp.419-430.
[11] W.Luo,S.Pietravalle,S.Parnell,F.van den Bosch,T.R.Gottwald,M.S.Irey, andS.R.Parker, “An improved regulatory samplingmethodfor mappingand representing plantdiseasefroma limited number of samples,” Epidemics,vol.4, no.2,2012,pp.68-77.
[12]D.S.Jadhav,S.S.More,S.D.Choudhari,andS.A.Chaudhari,“GrowthandInstabilityinArea,ProductionandYieldof CottoninIndia,”InternationalJournalofCurrentMicrobiologyandAppliedSciences,vol.11,2020,pp.1411-1417.
[13] M. Mollaee, A. Mobli, N. K. Mutti, S. Manalil, and B. S. Chauhan, “Challenges and opportunities in cotton production,”cottonproduction,2019,pp.371-390.
[14]A.Farooq,J.Farooq,A.Mahmood,A.Shakeel,K.A.Rehman,A.Batool,andS.Mehboob,“Anoverviewofcottonleafcurl virusdisease(CLCuD)aseriousthreattocottonproductivity,”AustralianJournalofCropScience,vol.5,no.13,2011, pp.1823-1831.
[15]M.U.Rahman,A.Q.Khan,Z.Rahmat,M.A.Iqbal,andY.Zafar,“GeneticsandGenomicsofCottonLeafCurlDisease,Its ViralCausalAgentsandWhiteflyVector:AWayForwardtoSustainCottonFiberSecurity,”FrontPlantSci.,vol.4,no. 8,2017Jul,doi:10.3389/fpls.2017.01157.PMID:28725230;PMCID:PMC5495822.
[16] J. A. Singh, S. Sohi, D. S. Brar, I. Denhdm, D. Russel, and R. Briddon, “Management of cotton leaf curl virus disease in India,”Proc. ICAC regional consultation insecticide resistance management in cotton. CCRI, Multan, 1999, pp. 277284.
[17]R.E.Gaunt,“Therelationshipbetweenplantdiseaseseverityandyield,”Annualreviewofphytopathology,vol.33,no. 1,1995,pp.119-144.
[18]L.M.Contreras-Medina,I.Torres-Pacheco,R.G.Guevara-Gonzalez,R.J.Romero-Troncoso,I.R.Terol-Villalobos,andR. A. Osornio-Rios,“Mathematicalmodelingtendenciesinplantpathology,”AfricanJournalofBiotechnology,vol.8,no. 25,2009.
[19]P.Sharma,B.K.Singh,andR.P.Singh,“Predictionofpotatolateblightdiseasebaseduponweatherparameters using artificial neural network approach,” In2018 9th International Conference on Computing, Communication and NetworkingTechnologies(ICCCNT),IEEE,2018July,pp.1-13.
[20] M. A. Khan, and H. A. Khan, “Cotton leaf curl virus disease severity in relation to environmental conditions,”Pak. J. Biol.Sci,vol.3,no.10,2000,pp.1688-1690.
[21]H.Saeed,M.Ehetisham-ul-Haq,M.Atiq,M.Kamran,M.Idrees,S.Ali,andS.Yasin,“Predictionofcottonleafcurlvirus disease and its management through resistant germplasm and bio-products,”Archives of Phytopathology and Plant Protection,vol.51,2018,pp.170-186.
[22] V. Tilva, J Patel, and C. Bhatt, “Weather Based Plant Diseases Forecasting Using Fuzzy Logic,” Nirma University InternationalConferenceonEngineering(NUiCONE),2013,pp.1-5.
[23] I. Hernandez, S. Gutierrez, S. Ceballos, F. Palacios, S. L. Toffolatti, G. Maddalena, and J. Tardaguila, “Assessment of downy mildew in grapevine using computer vision and fuzzy logic,” Development and validation of a new method, 2022
[24]L.A.Zadeh,“Theconceptofalinguisticvariableanditsapplicationtoapproximatereasoning I,”Inf.Sci.,vol.8,no.3, 1975,pp.199–249.
[25]T.J.Ross,“FuzzyLogicwithEngineeringApplications(2ndedn),”Wiley,Hoboken,2005
[26]E.H.Mamdani,“Applicationoffuzzyalgorithmsforcontrolofsimpledynamicplant,”In:Proc.Inst.Elec.Eng.,vol.121, no.12,1974,pp.1585
1588.
[27]T.Takagi,and M.Sugeno,“Fuzzy identificationof systemsanditsapplicationstomodelingandcontrol,”IEEETrans. Syst.ManCyberneticsSMC,vol.15,no.1,1985,pp.116–132.
[28] W. Van-leekwijck, and E.E. Kerre, “Defuzzification: criteria and classification,”Fuzzy Sets Syst., vol. 108, no. 2, 1999, pp.159–178.