International Research Journal of Engineering and Technology (IRJET) e-ISSN:2395-0056

Volume: 10 Issue: 07 | July 2023 www.irjet.net
p-ISSN:2395-0072

International Research Journal of Engineering and Technology (IRJET) e-ISSN:2395-0056

Volume: 10 Issue: 07 | July 2023 www.irjet.net
p-ISSN:2395-0072
1Structural Engineer, Assystem Stup;
2Honorary Professor, V R Siddhartha Engineering College, Vijayawada, AP, India ***
Abstract: Wind velocity is turbulent in nature and hence its variation with time is random. The interaction of the turbulentwindwiththebuildinggeneratesrandomvibrationsinthebuilding.Whenthefrequencyoftheturbulentwind forcecomesinlinewiththenaturalfrequencyofthebuilding,itproducesresonantamplificationofthebuildingresponse that is undesirable for structural safety and dwellers comfort. This paper probes the application of theory of random vibration in determining the peak along wind response of a conventional tall building, rectangular in configuration. Velocity power spectral density function is a focal point in mathematical modeling of turbulent wind velocity. Different expressions for velocity power spectral density function were proposed by Simiu, Harris and Kaimal. They are used to derivecorrespondingdisplacementpowerspectraldensityfunctions.Apeakinthedisplacementpowerspectraldensity functionplotisobservedatafrequencyequaltothenaturalfrequencyofthebuilding.The expectedvalueofpeakalong wind responseiscalculated usingprinciplesof random vibrationtheory.NumericcomputingsoftwareMATLABisused for solving the mathematical equations involved in the analysis. All the three velocity power spectral density functions produced nearly equal peak displacement at the tip of the building wherein, Harris velocity power spectral density function has an edge over the others A brief comparison of all the velocity power spectral density functions is also presented.
Keywords: Windanalysis,PowerSpectralDensityfunction,Randomvibration,Stochasticprocess,Tallbuildings,Along windresponse
1. Introduction
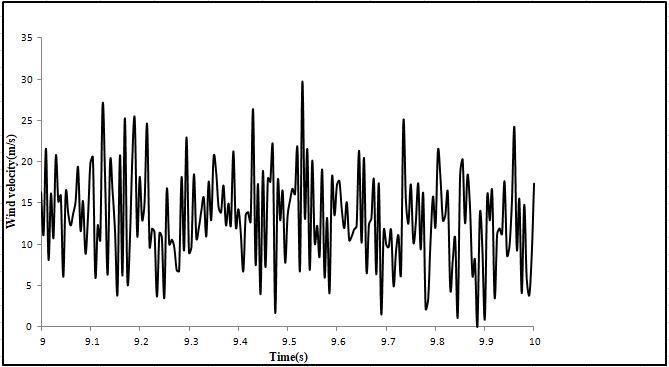
Tallbuildingsarevulnerabletoheavyswaycausedbythewind.Basically,windflowisdesignatedwithitsspeed orvelocity.Theflowof windina terrain can be described usingthe boundarylayer theory, where theground actsasa viscousboundarylayer.Thewindflowisnaturallyturbulent.But,thereisameanwindspeed,beithourlymeanor3-sec averaged,thatcarriestheturbulentwind.Thus,onecansaythat,thewindspeedisfluctuatingrandomlyaboutitsmean windspeed.Fig.1showsatypicalwindvelocitytimehistory.Thusonecanfindascopeinapplyingtherandomvibration theorytoanalyzeflow properties ofwind.As perthattheory, any periodic function havinga definiteperiodicitycanbe writtenassummationofsinesandcosinesofdifferentfrequencieswhichiswellknownasfourierexpansionofperiodic functions. It even can be extended to non periodic functions. A random process can explicitly be defined as a periodic function with infinite periodicity. A random process is said to be stationary if its statistical properties (mean, standard deviation, etc) doesn’t change with time [1]. Wind velocity time history is assumed to be a stationary random process aboutthemeanspeed.
Velocitypowerspectraldensityfunction(PSD)hasbeenapivotpointinmathematicalmodelingofwindvelocity. Asmentionedearlier,inatypicalwindvelocitytimehistory,thevelocityatanypointoftimecanbedecomposedasmean windvelocity(beithourlymean,3-secaveraged,etc)summedupwithfluctuatingcomponentofvelocityaboutthemean value.Now,usingfourierexpansion,this fluctuatingcomponent,atanyinstantoftimecanbewrittenas thesummation ofeddiesofdifferentfrequencies(circularfrequencies).Thuseacheddyhasadefinitewavenumber.Thevelocityofeddy perunitwavenumberiscalledasvelocitypowerspectraldensityfunction.Mathematicallyitisthespectrumofpowerof fourier coefficients of velocity fluctuations for different frequencies. Various expressions for velocity power spectral density function were proposed by many researchers, of which expressions proposed by Simiu, Harris and Kaimal are
usedhere.Thus,inanaveragewindstormof1hrduration,atagivenheight,theexpectedvalueofpeakwindvelocitycan be obtained using velocity power spectral density function from stochastic approach [2]. Extreme winds resulted from thunderstormsarenonstationaryandaredealtundernonstationaryrandomvibrationtheory[3].
As a consequence of stochastic wind velocity, the response of a structure to wind is also random with time. Henceonecandefinedisplacementpowerspectraldensityfunctionasthedisplacementproducedbyeacheddyperunit wavenumber. Aseachoftheseeddiespossessa unique frequency,theinteractionofeachoftheseeddyfrequencywith the natural frequency of the building can be visualized with the help of displacement power spectral density function. Thus,expectedvalueofpeakdisplacementresponse,whichisproducedasaresultofresonancebetweenthewindforce and flexibility of the building, is obtained using displacement power spectral density function. Displacement power spectraldensityfunctionscanbederivedfromvelocitypowerspectraldensityfunctionsusingthe principlesofrandom vibration.Manyinternationalcodeshaveimplicitlyspecifiedformulations,forcalculatingpeakresponse,intermsofGust factor or dynamic response factor, which represents the ratio of peak response to mean response of the building Australiancode[4]andIScodeof 2015 [5]hasdynamic responsefactor,Whereas, Canadiancodehasgusteffectfactor [6].

Codes have used those factors in calculating peak wind forces and hence those forces are displacement based andconservative. Stochastic methodisoneoftheseveral typesofmethodologiesto performthe numerical modeling of structures. Prominent researchers used rigorous methods for application to structural modeling that are based on Probabilistictheories,ArtificialNeuralNetworks [7]orLinearandNonLinearRegressionanalyses [8] Whilestochastic methodsaremoresuitablewhensmallerdataisavailable,ANNandRegressionmethodsaredataintensive. SaifulIslam etaldevelopedsimpleapproachforevaluatingthewindresponsestatisticsthatareimportantforbuildingserviceability [9]. In the next section, a tall building from Sitaram Vemuri and Srimaruthi Jonnalagadda., 2023 [10] is considered and peak along wind response of that structure is determined using theory of random vibration. Comparison of different velocitypowerspectraldensityfunctionsisalsopresented.Followedbythat,therewillbediscussiononresultsandthen finallyconclusionsarepresented
A tall building, rectangular in configuration from Sitaram Vemuri and Srimaruthi Jonnalagadda., 2023 [10] is considered. Along wind response of the structure is worked out in similar lines specified by Simiu, E and Robert, H.S., 1996.Table1givesthedetailsofthebuilding.

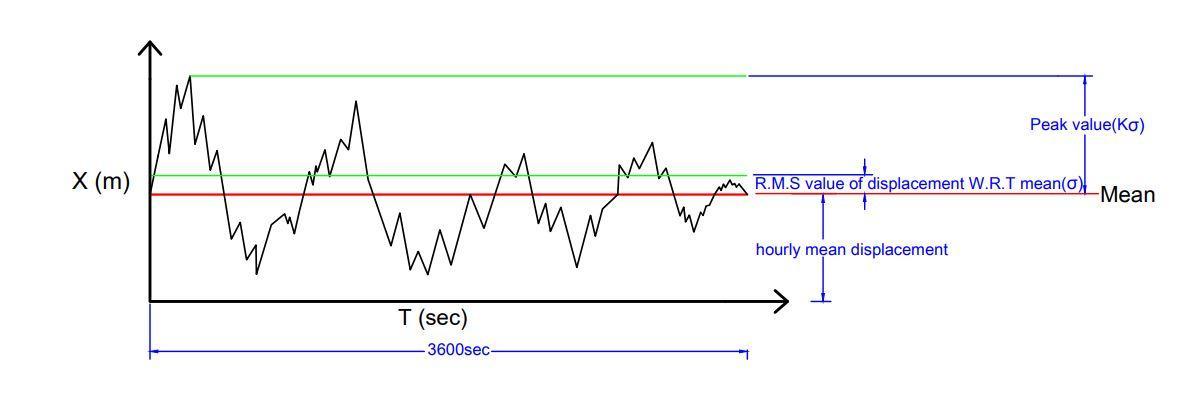
Fig. 2 shows a typical along wind response time history. From figure, it is clear that, response variation with time is fluctuatingaboutmeanresponse.Thus,thetotalpeakresponseisgivenbysummationofmean

responseandpeakvalueoffluctuatingresponseaboutthemean.Thisresponseanalysisisbasedontwoassumptions.1. The shape of fundamental mode shape is linear and 2. The response to wind loading is generally dominated by the fundamentalmode[1].Thesecondassumptionholdsiftheratiosofnaturalfrequenciesinthesecondandhighermodes tothefundamentalfrequencyaresufficientlylarge.Themeanresponseisgivenby,

Where, ‘ ’isthedensityofair=1.225kg/m3
‘ ’isthewindwarddragcoefficient.
‘ ’istheleewarddragcoefficient.

‘ ’isthewidthofthebuilding.
‘ ( )’isthemodeshape.
‘U(z)’isthehourlymeanwindspeedgivenbylogarithmiclaw.
‘ ’isthemodalfrequencyofith mode.
‘ ( )’isthemassofthebuildingperunitheight.
Thehourlymeanwindspeedisgivenbytheexpression,
Where, ‘k’istheKarmanconstant=0.4
‘ ’isthefrictionvelocityoftheterrain.
‘ ’istheheightofvariouslevelsofthebuilding. ‘ ’istheroughnesslengthforvariousterrains
‘ ’forvariousterrainsaregivenintableTable2.
Sincewehaveassumedthemodeshapeaslinear,theexpressionforthemodeshapeisgivenby,
After obtaining the peak responses along the height of the building, a mode shape correction factor is applied to this linear mode shape mentioned in (4), to obtain the actual mode shape and corresponding values of peak response. The massofthebuildingperunitheightisworkedoutfromthedensityofthebuilding. The peak expected value of the fluctuatingdisplacementaboutmeanisgivenby, =k
Where, ‘ ’ is the root mean square displacement with respect to mean and is represented in Fig. 2. It is also called as standarddeviationwithrespecttomeanvalue.‘k’istheexpectedvalueoflargestpeakfactorforfluctuatingdisplacement componentasshowninFig.2 Theexpectedvalueoflargestpeakfactorinagiven‘T’intervalisgivenby,
Here,‘T’istakenas3600secsinceaveragewindstormslastfor1hour.‘ ’fromrandomvibrationtheoryisgivenby,
andtheR.M.Svalueofdisplacementisgivenby,
‘
Where, ‘ ( )’isthedisplacementpowerspectraldensityfunction.
Thedisplacementpowerspectraldensityfunctionisgivenby,

Where, ‘ ( )’isthemodeshapedefinedinequation(4)
‘n’isthefundamentalnaturalfrequencyofthebuilding
‘ŋ’isthedampingratio.
‘ ’isthefrequencyofith harmoniceddy
isgivenby,
Where
‘ ’isthehourlymeanwindvelocityataheightof ⁄
‘H’istheheightofthebuilding.
‘ ’=min(B,H,D)
‘ ( )’isthevelocitypowerspectraldensityfunctionatheight‘z’.
‘ ( )’isthecoherencefunction.
Coherencefunctiongivesthemeasureoftheextenttowhichtworandomsignalsarecorrelated. Letsay,( ),( ) be two points on wind ward face of the building, z-axis being oriented along height of the building. When two wind velocity random signals hits the building at those two points, the effect of one on each other is dealt by coherence functionanditisgivenby,
Where, aretheexponentialdecaycoefficientsandareequalto10and16.

Equation (9) clearly shows that the displacement power spectral density function is dependent on velocity power spectral density function Different expressions for velocity power spectral density function are given by Simiu, Kaimal andHarris.
Simiu’svelocitypowerspectraldensityfunctionisgivenby,
Where, ‘n’istheeddyfrequenciesthatmakethefluctuatingvelocitycomponents.Where,
u(z)’beingthehourlymeanwindspeedgiveninequation(3)and, Kaimal’svelocitypowerspectraldensityfunctionisgivenby,
Where,
Whereas,Harrisvelocitypowerspectraldensityfunction,whichisindependentofheightisgivenby,
Where,
Where, ‘ ( )’ishourlymeanwindspeedat10mheightofthebuilding.
Fig.3depictsthevariationofalltheabovevelocityPSDfunctions,withfrequencyoftheeddy,attipofthebuilding.
Simiu's velocity PSD function
Kaimal's velocity PSD function
Harris velocity PSD function
The above equation (9) explicitly shows the conversion of velocity power spectral density function into displacement power spectral density function. Simiu’s, Kaimal’s and Harris velocity power spectral density functions are used to generate corresponding displacement power spectral density functions. Working out all the above formulations and usingMATLABforsolvingthequadrupleintegrals,peakdisplacementatthetipofthebuildingisobtainedusingequation (5).Peakdisplacementsatdifferentheightsofthebuildingcanbeobtainedbymultiplyingthepeakdisplacement atthe tip of the building with the mode shape with correction factor ‘ ’. Equation (21) gives the peak displacements as a functionofheightofthebuilding.Themodeshapecorrectionfactorequals‘0.4’forterraincategory-IV[1].
Displacement power spectral density functions corresponding to Simiu’s, Kaimal’s and Harris velocity power spectral density functions are determined at the tip of the building. The multiple integrals involved in determining the displacement PSD functions are solved with the help of MATLAB computing software. Fig. 4 shows the displacement powerspectraldensityfunctionvariationwithfrequencyoftheeddy,correspondingtodifferentvelocityPSDfunctions. In the figure, a peak is observed at a frequency of around 0.5Hz. It is due to the fact that the natural frequency of the building consideredis0.51Hzandeddyoffrequency0.51Hzproducesresonance.TheharrisdisplacementPSD function isdominatingalltheotherPSDfunctions.

Themeandisplacementresponseandpeakfluctuatingresponseareobtainedfromdisplacementpowerspectraldensity functionscorrespondingtothethreevelocityPSDfunctionsandresultsarecompared.TheresultsaretabulatedinTable 3.
It is observed that the peak tip displacement obtained using all the above velocity PSD functions are nearly same However,peaktipdisplacementobtainedusingHarrisPSDtookanedgeovertheothers.
Inthis paper,a tall building is considered andpeak alongwind response ofthestructureisworked outusing theoryof random vibration. The peak displacement is what the matter of concern for the design engineers to assess structural safetyanddwellerscomfort. So,thereisaneedtokeepacheckonresponseoftallbuildingstowindforces. So,aneffort

has been made in working out the peak along wind response of a 183m tall building. The envelope of wind response predictedbythismodelcouldbeusefultotallbuildings.Fortypicalcast-in-placeconcretehousingbuildingsinIndia[11], theinfluenceofwindisnegligibleasmostofthemareshortbuildings.
Thefollowingobservationsaremadefromthisstudy.
1. Velocitypowerspectraldensityfunctionplaysakeyroleindeterminingthepeakalongwindresponseofthe building
2. Simiu’sandKaimal’svelocityPSDfunctionisafunctionofheightofthebuildingwhereasHarrisvelocityPSD isindependentofheightofthebuilding.
3. For any eddy frequency, Harris velocity PSD function has the highest magnitude compared to other PSD functions.
4. EvenincaseofdisplacementPSDfunctions,HarrisdisplacementPSDfunctionholdshighovertheothers.
5. TheobtainedpeakalongwindtipdisplacementofthetallbuildingisalmostsameincaseofallthethreePSD functionsofwhich,HarrisPSDfunctiontookanedgeovertheothers.
[1] Simiu, E., and H.S Robert. 1996. Wind Effects on Structures (Fundamentals and applications to design), 3rd ed., John WileyandSons,USA.
[2] Nigam,N.-C.,andS.Narayanan.1994. Applications of Random Vibrations, 2nd ed.,NarosaPublishingHouse,NewDelhi.
[3] Chen, X. 2008. ”Analysis of Along wind Tall Building Response to Transient Nonstationary Winds.” J. Wind Eng. Ind. Aerodyn., 134,782-791.
[4] AustralianStandards.2011.“StructuralDesignactions,Part2-Windactions.”AS-NZS1170-2,Australia.
[5] BureauofIndianStandards(BIS).2015.“Designloads(OtherthanEarthquake)for buildingsandstructures-codeof practice.”IS875(Part3),NewDelhi.
[6] National Research Council of Canada (NRCC). 2015. “National Building Code.” Canadian Commission of Building and FireCodes,Ottawa.
[7] Jonnalagadda, S., Ross, B. E., and Khademi, A. 2016. “A modelling approach for evaluating the effects of design variablesonbridgeconditionratings.” Journal of Structural Integrity and Maintenance, 1(4),167-176.
[8] Jonnalagadda, S. 2016. “Artificial Neural Networks, Non Linear Auto Regression Networks (NARX) and Causal Loop Diagram Approaches for Modelling Bridge Infrastructure Conditions” (2016). All Dissertations. 1725. https://tigerprints.clemson.edu/all_dissertations/1725
[9] SaifulIslam,M.,E.Bruce,andB.C.Ross.1990.“DynamicResponseofTallBuildingstoStochasticWindLoad.” J. Struct. Eng.,116(11),2982-3002.
[10] SitaramVemuri.,andSrimaruthiJonnalagadda.2023.“WindAnalysisofTallBuildingsusingCodalprovisions, StochasticapproachandCFD.” International Journal of Advances in Engineering and Management., 5(7), 58-68.
[11] Srimaruthi Jonnalagadda., and Sitaram Vemuri. 2023. “Challenges in Traditonal Concrete Slab Construction forHousingBuildingsinDevelopingCountriesandCriticalNeedforNovelMethods.” International Journal of Advances in Engineering and Management., 5(5), 176-186
