Predicting Flood Impacts: Analyzing Flood Dataset using Machine Learning Algorithms
Naga Ravindra Babu M1 , B Naresh2 , A Satya Vamsi Kumar3, G Ganga Bhavani4 , A Sai Ram5 , G Chakradhara Rao6
1Assoc. Prof., Dept. of Computer Science, B V Raju College, Bhimavaram, AP, India
2Assoc. Prof., Dept. of Computer Science, B V Raju College, Bhimavaram, AP, India
3Asst. Prof., Dept. of Computer Science, B V Raju College, Bhimavaram, AP, India
4Asst. Prof., Dept. of Computer Science, B V Raju College, Bhimavaram, AP, India
5Asst. Prof., Dept. of Computer Science, B V Raju College, Bhimavaram, AP, India

6Asst. Prof., Dept. of Computer Science, B V Raju College, Bhimavaram, AP, India ***
Abstract - Floods are one of the most destructive and challengingto anticipate natural catastrophes.Thefrequency or severity of floods has grown in recent years due to climate change and urbanization, as have the associatedfatalitiesand financial losses. Machine learning-based flood forecasting models have slowly started to appear as a result of the fast expansionofcomputingpower. Richinformationisincludedin these models since they were trainedonhistorical data,which is advantageous for data analysis and use. Machine-learningbased models are more effective than the conventional physical flood forecastingmodelinachievingsatisfyingresults. This study provides a summary of contemporary machine learning-basedfloodpredictiontechniquestoillustraterecent developments in flood forecasting.
We list a range of current works in flood prediction and construct the model based on several methodologies.
For flood warnings, flood reduction, or flood prevention, machine learning (ML) models are useful. Machine-learning (ML) addresses have become more well-liked in this regard because to their minimal computing demands and predominance of observational data.
Key Words: Flood, human injure, urbanization, Random Forest,SupportVector,NeuralNetworketc.
1.INTRODUCTION
Thenumberofnaturalandman-madedisastershasgrown globally in recent years. The most common natural catastrophe is a flood, which happens when an excess of watersubmergesnormallydryground.Floodsaretypically caused by protracted periods of intense rain, rapid snowmelt,stormsurgesfromtropicalcyclones,ortsunamis incoastalareas.
Floods may wreak havoc across a large area, causing fatalities as well as damage to private property and vital public health facilities. Worldwide, more than 2 billion people were impacted by floods between 1998 and 2017. Mostatriskfromfloodsarethosewhoresideinfloodplains,
in non-flood proof structures, lack access to warning systems,orareunawareoftheriskofflooding[1].
75%ofthosewhopassawayinfloodcatastrophesdrown. Disasters caused by flooding are occurring increasingly often,andthistendencyispredictedtocontinue.Flooding increases the danger of drowning, especially in low- and middle-incomenationswhereresidentsliveinflood-prone locations and flood warning, evacuation, and protection systemsarestillunderdevelopedorinsufficient[2].
2. LITERATURE SURVEY
The author of this research analyzed several machine learning-based flood forecasting systems, including linear regression, decision trees, and SVM-based approaches, as well as deep learning-based algorithms like BP and LSTM models. The study shows that the applicability of various approaches varies. Furthermore, since the most recent algorithmsarelargelyinfluencedbythesophisticatedmodels in deep learning, this paper's conclusion from the current researchisthattheadvancementofdeeplearningtechnology hasasignificantimpactonfurtherimprovingtheaccuracyof floodpredictionperformance[3].
Basedonhistoricalrainfalldatasetsspanning33years,the goalofthisprojectwastodevelopamachinelearningmodel that can forecast floods in Kebbi state so that it may be appliedtootherNigerianstateswithhighfloodrisk.Inthis study, three machine learning algorithms Decision Tree, Logistic Regression, and Support Vector Classification (SVR) were assessed and their Accuracy, Recall, and Receiver Operating Characteristics (ROC) scores were compared.Whencomparedtotheothertwomethods,logistic regressionyieldsmoreaccuratefindingsandoffersexcellent performance accuracy and recall. The Decision Tree fared better than the Support Vector Classifier as well. Due to DecisionTree'sabove-averageaccuracyandbelow-average recallratings,itdidprettywell[4].
This study introduces an innovative method for using the ensemblemodeltoestimatewaterlevelinrelationtoflood
severity. Our method makes advantage of the most recent advancementsinmachinelearningandtheInternetofThings (IoT) to automate the analysis of flood data that might be valuableinthemitigationofnaturalcatastrophes.According toresearchfindings,ensemblelearningisa moreaccurate method of predicting the severity of flooding. With sensitivity, specificity, and accuracy of 71.4%, 85.9%, and 81.13%, respectively, the experimental findings show that ensemble learning utilising the Long-Short Term Memory modelandrandomforestoutperformedindividual models [5].
Thevariousmodelarchitecturesandtheirperformancesare shown in this research. Based on IoT data and weather forecasts, machine learning models using deep learning neuralnetworkshavebeenconstructedtoidentifypotential risks[6].

3. PROPOSED METHODOLOGY

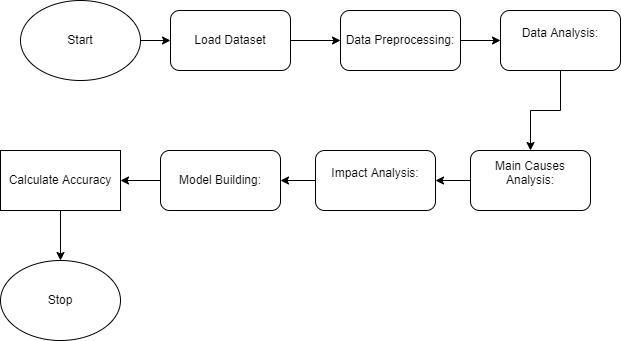
Basedonyourdatasetandthegoaloffloodprediction,here is a proposed methodology for analyzing and predicting flood-relatedoutcomesusingmachinelearning:
Training Phase: Thesystemistrainedusingthedatafrom thedatasetandthecorrectmethodofmodelfitting.
Testing Phase: The system is given inputs before its functionalityisevaluated.Itisputtothetest.
itscharacteristicsincludesimplesharingandcollaboration, freeaccesstocomputerresources.
3.1.2 Google Colab
Python projectsandprogrammes maybewrittenand run usingGoogleColab,alsoreferredtoasCollaborator. Wecan performhigh-levelprogramming,dataanalysis,andmachine learningalgorithmsthankstoit[8].
3.2 DATASET COLLECTION, PRE-PROCESSING, AND ANALYSIS
3.2.1 Data Collection
InthispaperthedataiscollectedfromKaggle.Thedataset cointainsalotofinformationlikestartingdateandenddate offloodsandheavyrainfalloccurred.Andalso thedataset cointains the information about number of days rain fall, numberhumansinjured,numberofdeathoccurred.
3.2.2 Pre-processing of Data
Pre-processingreferstochangingoreliminatinguncleanand rawdatabydetectingmissingorunnecessaryelementsof thedataandsubsequently.EncodingCategoricalVariables like"maincause," are encodethemintonumericalvaluesfor the machine learning algorithms to understand. One commonapproachisone-hotencoding,whereeachcategory is represented by a binary value (0 or 1) in separate columns.
3.2.3 Data Analysis
In this dataset, many columns data from across India has collected.Byusingthesecolumnsdataitisusedtopredict the human injured, human deaths, animal deaths can be predicted. By using this data set it is analysied how many human injured, human deaths, animal deaths can be forecasted.
4. IMPLEMENTATION
3.1.
Fig: 1 System Architecture of flood
TECHNOLOGIES USED:
3.1.1 Python:
For building websites and apps as well as doing data analysis, Python is a widely-liked and approachable programminglanguage.Wecanreadilyreusecodethanksto the distinctive features of this high level programming language.Pythonisnotlimitedtoanyoneareaofstudyand maybeusedtodevelopawiderangeoforiginalprojectsand programmes that are dynamic and interesting. Both the dynamictypingandgarbagecollectionaredone[7].Someof
The model is tested in this stage using the predefined machinelearningclassifiers.Therehavebeenafewmodels created,andtheircorrectnesshasbeenconfirmed.Forthis project,we'reusingthefourclassifiersindicatedbelow.
Decision Tree: Calculate the accuracy of the Decision Tree model by comparing the predicted labels to the true labels of the test data. Additionally, you can compute metrics such as precision, recall, and F1-score for a more comprehensiveevaluation.
Random Forest: Similar to the Decision Tree, compute the accuracy, precision, recall, and F1score of the Random Forest model based on the predictionsandtruelabelsofthetestdata.
SVM: ForSVM,usetheaccuracymetrictomeasure howwellthemodelperformsinclassifyingthetest data.
Gradient Boosting: Calculate the accuracy, precision, recall, and F1-score for the Gradient Boostingmodelusingthepredictedlabelsandtrue labelsofthetestdata.
Neural Network: Evaluate the Neural Network model'saccuracybycomparingitspredictedlabels tothetruelabelsofthetestdata.Additionally,you cancomputeothermetricssuchasprecision,recall, andF1-score.
Isolation Forest: For Isolation Forest, the typical evaluationmetricusedistheMeanSquaredError (MSE).Thismetricmeasurestheaveragesquared difference between the actual values and the predicted anomaly scores generated by the IsolationForestalgorithm.
5. RESULTS
The data from various cities in India, such as Arunachal Pradesh,Assam,Bihar,Chattisgarh,HimachalPradesh,Jammu & Kashmir, Kerala, Madhya Pradesh, Maharashtra, Meghalaya, Odisha, Punjab, Rajasthan, Sikkim, Tamilnadu, Telangana, Uttar Pradesh, Uttarakhand, West Bengal, Puducherry, Andhra Pradesh, Chhattisgarh, Gujarat, Jharkhand,Mizoram,Tripura,Nagaland,Andaman&Nicobar Islands, New Delhi, were collected. The data includes different variables, such as start date ,end date, Duration, Main_Cause,Districts,State,Human_fatality,Human_injured, Animal_Fatality, Description_of_Casualties/injured, Extent_of_damage.
The correlation coefficients between two sets of variables areshowngraphicallyinacorrelationmap.
SomeInsights:

According to a heatmap, Human_injured and Animal_Fatality have a significant positive linear linkwithacorrelationcoefficientof0.83between them.
A heatmap's Human_Injured and Main_Cause correlationcoefficientof0.072indicatesthatthere isamarginallypositivelinearassociationbetween thesetwovariables.


According to a heatmap, there is a somewhat positive linear link between Animal_Fatality and Human_injured,withacorrelationvalueof0.83.
Pair Plot for flood dataset
From the above graph it shown the different columns data in the graph
Apairplotisagraphicalrepresentationthatallowsyouto visualize the relationships and patterns between pairs of variablesinadataset.Itprovidesamatrixofscatterplots, whereeachscatterplotrepresentstherelationshipbetween
two variables. Here's a description of the pair plot for the flooddatasetcolumnsyouprovided:
1. 'Start_Date' vs. 'End_Date': This scatter plot will show the relationship between the start and end dates of the flood events. It can help identify any patternsortrendsinthedurationofthefloods.
2. 'Start_Date' vs. 'Duration': This scatter plot will display the relationship between the start date of thefloodsandtheirduration.Itcanrevealwhether thereisacorrelationbetweenthestartdateandthe lengthofthefloodevents.
3. 'Start_Date' vs. 'Human_fatality': This scatter plot will show how the number of human fatalities varieswiththestartdateofthefloods.Itcanhelp identify if there are any time-specific factors that contributetohigherorlowerhumanfatalities.
4. 'Duration'vs.'Human_fatality':Thisscatterplotwill illustratetherelationshipbetweenthedurationof thefloodsandthenumberofhumanfatalities.Itcan indicate whether longer-lasting floods are associated with a higher likelihood of human casualties.
Theheightofeachbarrepresentsthemagnitudeofhuman injuries, allowing for a visual comparison between states. The bar chart provides insights into the states that experienced a higher number of human injuries during floods, helping identify regions that were more severely affected.
By examining the chart, you can identify states with the highestandlowest counts ofhuman injuries,facilitating a better understanding of the impact of floods on human populationsacrossdifferentregions.
Fig:4 Human Injuries during flood by state
Thebarchartdisplaysthenumberofhumaninjuriesduring floods, categorized by state. The x-axis represents the different states, while the y-axis represents the count of human injuries. Each bar represents a state and its correspondingvalueindicatesthenumberofhumaninjuries reportedinthatstateduringfloodevents.
Fig:5 Human Fatality during Floods by State


The bar chart illustrates the number of human fatalities duringfloods,categorizedbystate.Thex-axisrepresentsthe different states, while the y-axis represents the count of human fatalities. Each bar corresponds to a state, and its heightrepresentsthenumberofhumanfatalitiesreportedin thatstateduringfloodevents.
The bar chart allows for a visual comparison of the magnitude of human fatalities across different states. It providesinsightsintothestatesthatexperiencedahigher number of human fatalities during floods, enabling the identificationofregionsthatweremoreseverelyimpacted.
By examining the chart, you can identify states with the highest and lowest counts of human fatalities, gaining a betterunderstandingoftheimpactoffloodsonhumanlifein differentregions.

Fig:6 Animals injuries during flood by state

Thebarchartdepictsthenumberofanimalfatalitiesduring floods, categorized by state. The x-axis represents the different states, while the y-axis represents the count of animal fatalities. Each bar corresponds to a state, and its heightindicatesthenumberofanimalfatalitiesreportedin thatstateduringfloodevents.


Thebarchartfacilitatesavisualcomparisonoftheimpactof floods on animal life across different states. It provides insightsintothestatesthatexperiencedahighernumberof animalfatalitiesduringfloods,enablingtheidentificationof regionswhereanimalsweremoreseverelyaffected.

By examining the chart, you can identify states with the highest and lowest counts of animal fatalities, gaining a betterunderstandingoftheimpactoffloodsonwildlifein differentregions.
The x-axis displays the different states, while the y-axis representsthedurationofthefloodsintermsofdays.Each bar corresponds to a state, and its height indicates the averageortotaldurationoffloodsreportedinthatstate.
Thebarchartallowsforavisualcomparisonoftheduration of floods across different states, providing insights into regionsthatexperiencedlongerorshorterfloodevents.It helpsidentifystateswiththehighestandlowestaverageor totaldurationoffloods,highlightingareasthatweremoreor lessaffectedbyprolongedflooding.
Byexaminingthechart,youcanidentifystateswiththemost extendedorshortestdurationsoffloods,facilitatingabetter understandingofthetemporalimpactoffloodsindifferent regions.
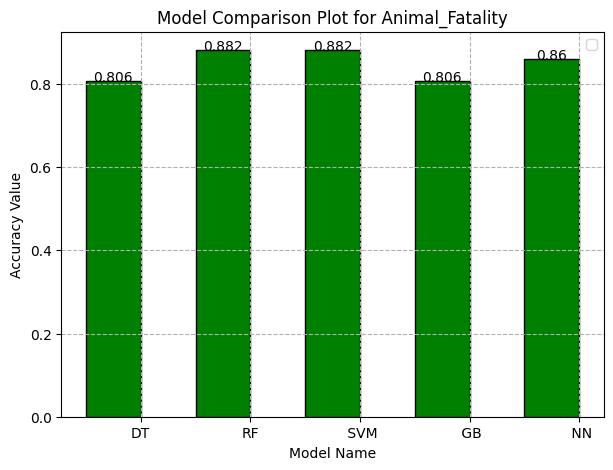
6. COMPARISON
By observing the below bar chat, the Random Forest ClassifierandSVMgivesthebestaccuracy88.2%amongall theremainingalgorithms.
By observing the below bar chat, the SVM gives the best accuracy81.7%amongalltheremainingalgorithms.
7. CONCLUSION
Inconclusion,theprojectdemonstratestheeffectivenessof machinelearningalgorithmsinanalyzingflooddatasetsand predicting flood impacts. The findings emphasize the importanceofusingadvancedalgorithmstoinformdecisionmaking processes in flood management and response, ultimatelyaidinginreducingtheadverseeffectsoffloodson humanlife,animalwelfare,andinfrastructure.
REFERENCES
[1]WorldHealthOrganization.(n.d.).Floods.Retrievedfrom https://www.who.int/health-topics/floods#tab=tab_1

[2] World Health Organization. (n.d.). Floods. In Health topics. Retrieved Month Day, Year, from https://www.who.int/health-topics/floods#tab=tab_2
[3]Di,Q.,Jinbo,Q.,&Mingti,C.(2022,October).Application of Machine Learning in Flood Forecast: A Survey. In 2022 International ConferenceonVirtualReality,Human-Computer Interaction and Artificial Intelligence (VRHCIAI) (pp. 177181).IEEE.
[4]Lawal,Z.K.,Yassin,H.,&Zakari,R.Y.(2021,December). Flood prediction using machine learning models: a case study of Kebbi state Nigeria. In 2021 IEEE Asia-Pacific Conference on Computer Science and Data Engineering (CSDE) (pp.1-6).IEEE.
Z. K. Lawal, H. Yassin and R. Y. Zakari, "Flood Prediction UsingMachineLearningModels:ACaseStudyofKebbiState Nigeria," 2021 IEEE Asia-Pacific Conference on Computer Science and Data Engineering (CSDE), Brisbane, Australia, 2021,pp.1-6,doi:10.1109/CSDE53843.2021.9718497.
[5]Khalaf,M.,Alaskar,H.,Hussain,A.J.,Baker,T.,Maamar,Z., Buyya, R., ... & Al-Jumeily, D. (2020). IoT-enabled flood severity prediction via ensemble machine learning models. IEEE Access, 8,70375-70386.
[6]Wang,Q.(2022,October).Machinelearningmodeldesign for IoT-based flooding forecast. In 2022 International Conference on Cyber-Enabled Distributed Computing and Knowledge Discovery (CyberC) (pp.97-103).IEEE.
[7] Python (programming language). (n.d.). In Wikipedia. Retrieved May 8, 2023, from https://en.wikipedia.org/wiki/Python_(programming_langu age)
[8]Google.(n.d.).Frequentlyaskedquestions(FAQ).Google Research.
https://research.google.com/colaboratory/faq.html
BIOGRAPHIES
NagaRavindraBabuMworkingas anAssociateProfessorinBVRaju College,Bhimavaram,APIndia.He havehandsonexperienceondoing webbasedprojectsusingPHPand MySQLandMLProjects.
BNareshworkingasanAssociate Professor in B V Raju College, Bhimavaram, AP India. He have handsonexperienceondoingweb based projects using PHP and MySQL.


A Satya Vamsi Kumar working as an Asst.,Professor in B V Raju College,Bhimavaram,APIndia.

G Ganga Bhavani working as an Asst.,ProfessorinBVRajuCollege, Bhimavaram,APIndia.


A Sai Ram working as an Asst.,ProfessorinBVRajuCollege, Bhimavaram,APIndia
GChakradara Rao working asan Asst.,ProfessorinBVRajuCollege, Bhimavaram,APIndia.
