Effect of Rack Friction, Column Friction and Vehicle Speed on Electric Power Steering (EPS) of Vehicle-A Methodology
1MTech Student, Dept. of Mechanical Engineering, NIT Warangal

2Deputy General Manager, Chassis Engineering, TATA Motors
3General Manager, Chassis Engineering, TATA Motors
4Professor, Dept. of Mechanical Engineering, NIT Warangal, Telangana, India ***
Abstract - In Passenger vehicle industry, Steering performance is of utmost importance in determining the vehicle dynamic behavior for active vehicle safety and crucial to understand the performance well before its deployment on the vehicle. In current scenario, with the introduction of advanced driver assistance system (ADAS), which comes with many add on features in the steering system such as pull drift compensation, lane keep assist, auto park assist etc., this requirement becomes more stringent for the accurate delivery of the programmed algorithms In this paper, the complete wheel-to-wheel steering model is developed for the simulation in Amesim platform with all the associated components With the validated model, the variation of the total torque required at the pinion gear at different vehicle speeds (0 to 160 kmph) is plotted. The friction torque at column, steering rack and motor is plotted to closely understand the change behavior with respect to time for the given input of steering angle and vehicle speed. At last, results are analyzed to develop the understanding between steering system’s components so that the necessary power can be requested fromthesystem inordernottocompromisewiththedesired forcetoturnthewheelonroad.
Key Words: Electric power Steering, Amesim, Friction, Vehicle, Simulation etc.
1. INTRODUCTION
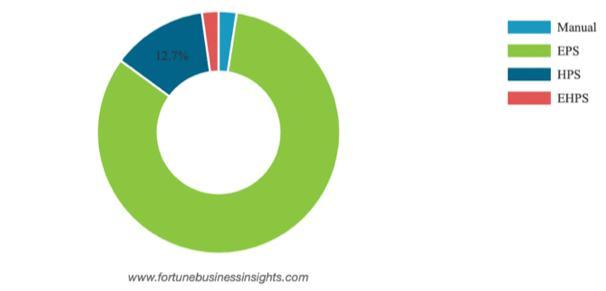
According to the report of fortune business insight, the global market for automobile steering systems which is divide into four categories: manual steering, electric power steering (EPS), electro-hydraulic power steering (EHPS) andhydraulicpowersteering(HPS) asmentioned in Fig-1 was valued at USD 17.1 billion in 2018, and it is anticipatedtoreachUSD25.4billionby2026[1] Because manufacturers are increasingly integrating EPS into vehicle models, the electric power steering category is expectedtodominatethemarket.
Furthermore, government restrictions for fuel efficiency have prompted a rise in the use of fuel-efficient vehicles which requires efficient steering systems. In addition, the consumerdemand for fuel-efficientvehiclesisanticipated
to fuel the growth of the automotive steering system market
To cater this requirement, other than many solutions on theengineandtransmissionetc.onepromisingsolutionis EPSsystemthatonlyactivateswhenthesteeringwheel is turned resulting in 3% better fuel efficiency than that of thevehicleequippedwithanequivalenthydraulicsystem. TheEPSsystemisthereforeuseslessenergyandresultin fuel saving and decreases the amount of carbon dioxide released into the atmosphere and thus making it more environmental friendly and energy-efficient [2] To improve the efficiency within EPS system further, the frictionwhichariseatdifferentpartofthesteeringsystem has to be at a value that gives the improved performance in terms of steering feel. Therefore, when it comes to the improvement, knowing the actual values and change behaviouroverarangeofdrivingmanoeuvreisimportant tounderstand.
To understand and monitor the performance of the steering system, many researchers have put their efforts right from the design, simulation to testing setups. The design requirement of EPS has been covered by A. Isah et al.[3]forpiniontypeassistconfiguration(P-EPS),column type assist configuration (C-EPS) and rack assist configuration (R-EPS). Botti et al. [4] in their paper has included wheel to wheel steering system model in the early design stages of a power steering system while Hao Chen et al. [5] developed 15 degree of freedom(DOF) vehicle model consisted of, wheels- 4DOF, vehicle body6DOF,suspension-rear-2DOF,suspension-front-2DOF,and
steering wheel-1DOF. For this work, entire system was divided into three sections. (1) Brush-Direct Current motor, which supplies assist torque; (2) Mechanical system, which includes the steering wheel, steering column and steering rack; and (3) Electronic Control Unit (ECU), which includes related sensors like steering angle sensor, steering torque sensor and motor current sensor etc.
ThecontrolmechanismisacrucialpartoftheEPSsystem through whichitoffersmoreassistanceasavehicleslows down and less assistance as it travels faster. When no steering assistance is needed, system operates with very littlepower[6].Manyresearchershavecontributedinthis domain.LinaFengetal.[7]didinvestigationsintocontrol mechanisms of brushless DC motors and discussed three distinct kinds of fundamental assist characteristics liner type, broken line type, and curve type are depicted in Fig.2.Outofthese,lineartypeofassistcharacteristicsare widely used for the development of power steering motor'storquecontrolstrategy
explained in section5 and lastly the paper is concluded in section6 by providing future scope and limitations of the work.
2. OBJECTIVE
To understand the steering system’s modeling methodologyin1D Amesim environment.

To know the impact of vehicle speed on the required piniontorque.
To know the impact and change behavior of component’s friction (column, rack and motor) for a given set of steeringangleandvehiclespeed
3. MODELING METHODOLOGY
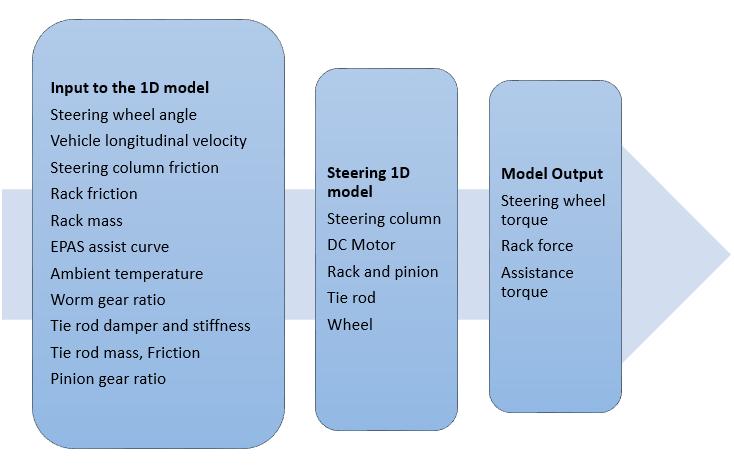
The steering system is responsible to turn the vehicle as per driver’s input. It contains the following parts: steering wheel, steering column, rack - pinion mechanism and assistance law. The parameters used as input, output and forthemodelingofthesteeringsystemareasfollow:
Fig -2: Assistcharacteristics
To predict the steering effort precisely, some work has been done on the prediction and calculation of friction torque in the past such as Kim et al [8] has proposed an analytical method to take tire friction torque into consideration for the evaluation of steering effort. In his test setup, he used strain gauge, linear displacement indicator, non-spinning torque sensor for the measurement of rack force, rack displacement, steering effort and tire friction torque respectively. However he neglected the friction within thesteeringsystemand thus the calculated value of steering efforts are smaller than actual measurement.M.M.Skarzynska [8]highlightedthe importance of reduction in friction and studied that steering friction is contributed from different parts of the systemsuchassteeringshaftfriction,columnfriction,and steering rack friction They concluded that to estimate steering wheel torque accurately, the steering column is oneofthekeycontributors.

Given this contexture, this study focuses on development ofsteeringsystemmodelin Amesim environmentwiththe detailed focus on friction contributing component of the EPS system. The rest of the paper proceeds in following sections: Section2 covers the objective of this present work. In Section3, the modeling methodology with the introductionof Amesim tooliscovered. Section 4 explains the working of the 1Dim EPS model. The results are
3.1 INTRODUCTION OF Amesim TOOL
Amesim stands for Advanced Modelling Environment for Engineering System Simulation This platform is used to model, analyze and predict the performance of the mechatronics system. In this work 1D mechanical and vehicle dynamics library of Simcenter Amesim platform is beingusedformodelsettingandtoperformthesimulation of the EPS logic. A brief understanding of the steering system components, principle of working and the corresponding library block to model in Amesim environmentareexplainedhereasfollows:
3.1.1 Steering column and Torque Sensor
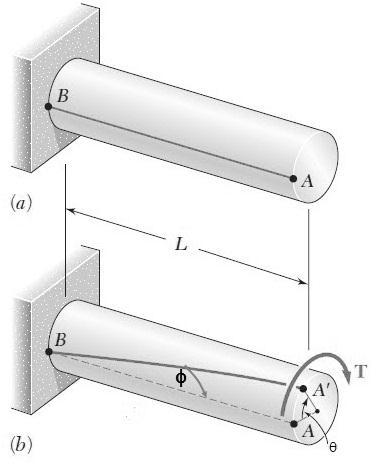
Torsion bar is used as the torque sensor in the column steering system connected between the driving source i.e. steeringwheelfromwherethedriverwillprovideinputto the system and load i.e. the tire at the road surface such thatitsperfectlyalignwiththeaxisofrotation.Torsionbar can be a simply metallic bar for measuring the torque transmitted from driver to load or load to driver with circularcrosssection.
Theprincipleinvolvedinmeasuringthetorqueisthetwist or thedeflectionin theshaft. Atorsional mechanical input istransformedintoanelectricaloutputsignalusingtorque sensorsandsenttothecontrollerasaninput.
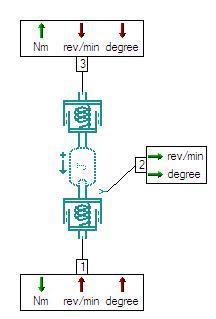
The modeling of the torsion bar is the important and crucial part in the entire electric power assist steering system. In the simulation model, it can comprise of a torsion spring connected to the steering column on one sideandthepinionontheotherasshownintheFig-5.
bar(a)beforedeflection(b)afterdeflection
Theangulartwist,thedifferencebetweentheangleatboth theendisdirectlyproportionaltothetorquedevelopedin thetorsionbarbetweeninputandoutputshaft,andthatis adirectmeasureofthetorquevalueinthesensor.
Themathematicalexpressioninvolved:
3.1.2 Rack-Pinion Mechanism
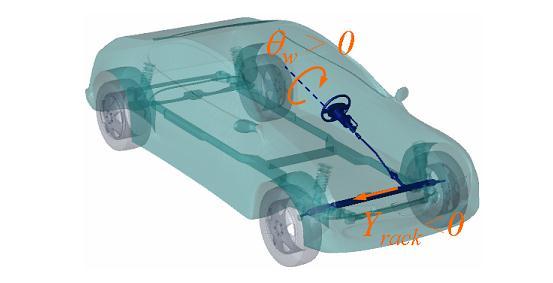
The transformation ratio between the steering angle and the rack displacement is represented by the rack-pinion model. The ratio must be negative because of the sign conventionsofexpressionframes:apositivesteeringangle (left turn) produces a negative rack displacement (rack goestotheright).
Aftersubstitutingthevalueofpolarmomentofinertia,
Where,
L=Torsionbaractivelength
T=Torque
G=Modulusofrigidityoftheshaftmaterial

=Outerradiusoftheshaft
=Innerradiusoftheshaft
=Angulardisplacementoftheshaft
Incaseofsolidshaft,
3.1.3 Assistance Law
In accordance with the steering torque at the torsion bar andthevehiclespeed,theassistancelawdeliversacurrent intensity instruction. However, the electric motor's torque constantparameter,whichconvertsthecurrentinstruction

into output torque, is all that is needed to model the electricmotor.
Theassistancelawisthefollowing:
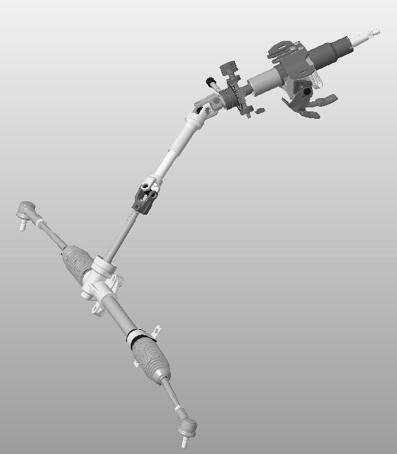
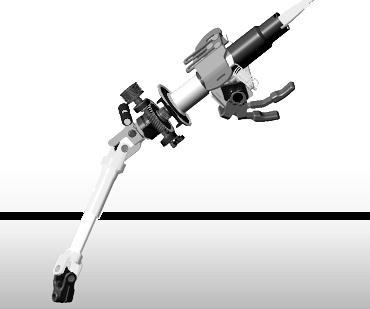
Fig9 shows how various components such as steering column,Electric motor, Torque sensor, Intermediate shaft, pinion shaft, Tie rod, Universal joints Rack and Pinion etc. ofElectricpowerassiststeeringmodelareconnectedinan EPSsystem.
Where
Iassist=motorcurrentcommandin[A]

Kassist=assistancegainin[A.(km/h)/(Nm)3]
Tsteer=steeringtorqueattorsionbarin[Nm]
Vvehicle=vehiclespeedin[km/h]
εisanoffsettoavoiddivisionbyzeroin[km/h]
the vehicle speed is given as the input for a range of 0 to 160kmphwhilekeepingthedamper,stiffness,frictionand othervaluesunchangedforonesetofsimulation
3.2 PART DECRIPTION
Table1: Steeringsystem-Partdescription
Bullet number
1 Uppercolumn Frictionvalue
2 Steeringtorquesensor TorsionBar Torque display(Nm) Spring,dampingvalue
3 Worm and worm wheel ofassistmotor Wormgearratio
4 Intermediateshaft Friction
5 Pinionshaft Frictionvalue
6 Tierod Friction,length
7 Universaljoint Friction
8 Rackandpinion Pinionradius
4. Amesim EPS MODEL WORKING
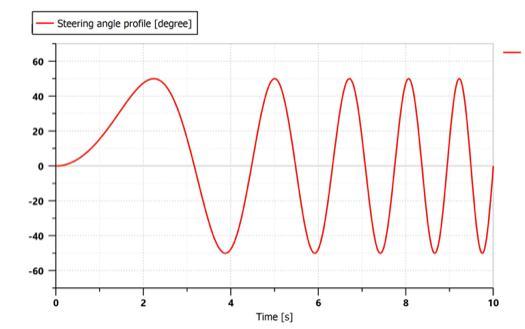
The 1Dimensionline diagram isused tobuildthe Electric power assist steering logic in Simcenter Amesim platform. The sinusoidal wave type input of 50 degree amplitude is provided as the steering profile. Steering column provides thefrictioninrectangularpattern.
Torquesensorisusedtomeasuretheresultingtorsionbar torque.Assistancecurveisusedtocalculatethecorrective
command based on vehicle speed and torque value measuredbytorquesensor.
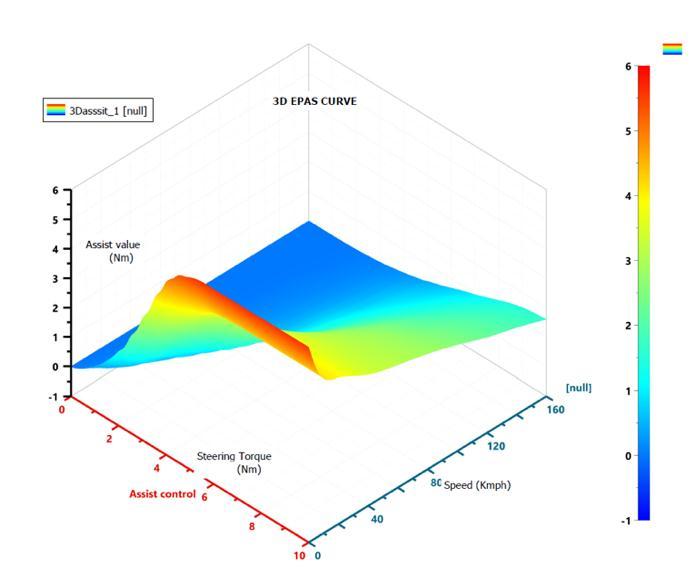
Foreachsetofvehicle,the3Dassistcurveisavailablethat willbeusedfortherespectivecurrent/voltagecalculation, the output from the assistance law will be treated as the input to the electric motor which will provide the compensationtorquecommand.
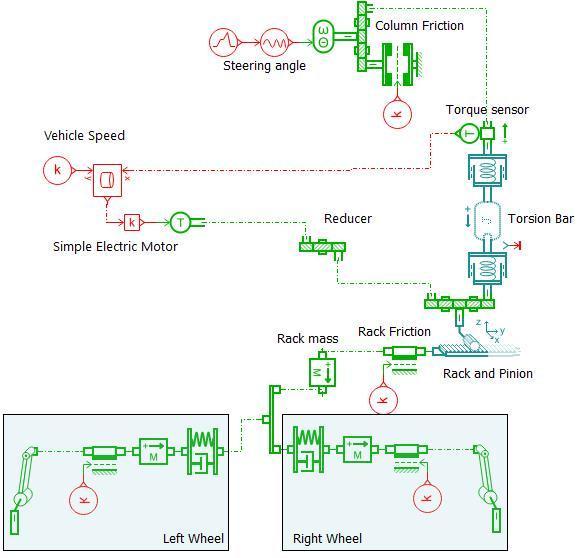
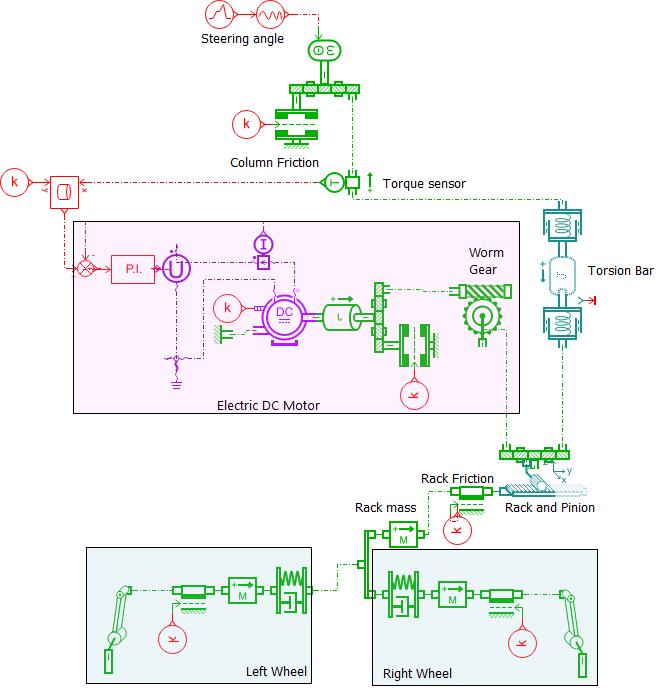
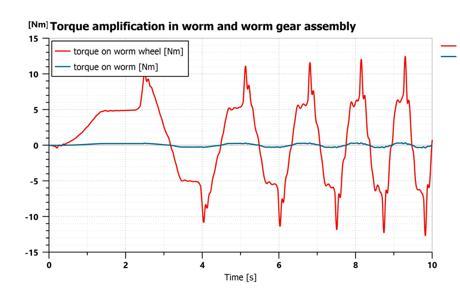
To amplify the torque command value, worm and worm wheel is used, where as per the gear law (G=26 for this study) torque increases at the larger gear. The amplified torque value and the torque applied from driver’s side is giventothepinionoftherack-pinionsetwheretherotary motionistransferredtothelinearmotionoftherack.


Because of the rack inertia and friction of the component and joint, the value of the force that will actually come on thetierodandwheelswillbeless.
The rack will be distributed to the left and right wheel in proportiontothewheelinertiaandstiffnessvalue.Inideal casethisdistributionisexactlysameonboththeside.

Simulation model development and validation is done as mentioned in the flow diagram with the given input of steeringangleprofile,assistcurveandvehiclevelocity.
Steering angle profile
In this work the steering angle considered as the input which varies sinusoidally with an amplitude of 50 degree oneachsideasshowninthechart1
Vehicle velocity
The prepared model is capable to analyse the model for a range of vehicle speed from 0 to 160 kmph. However, for the model validation, vehicle speed is maintained to 100kmph as per ISO 7401:2011 with 2% of maximum allowedfluctuationasmentionedinthechart3.
Assist curve
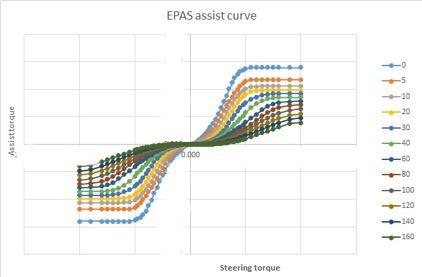
Assist curve is the another input to the EPS model, where basedonthevehiclespeedandsteeringeffort,thecurrent valueistherewhichisfedintotheDCelectricmotortoget theassisttorqueinputwhichthenmultipliedbytheworm gear ratio and the amplified torque then applied to the piniontoassistthedriver.
5. SIMULATION RESULTS AND DISCUSSION
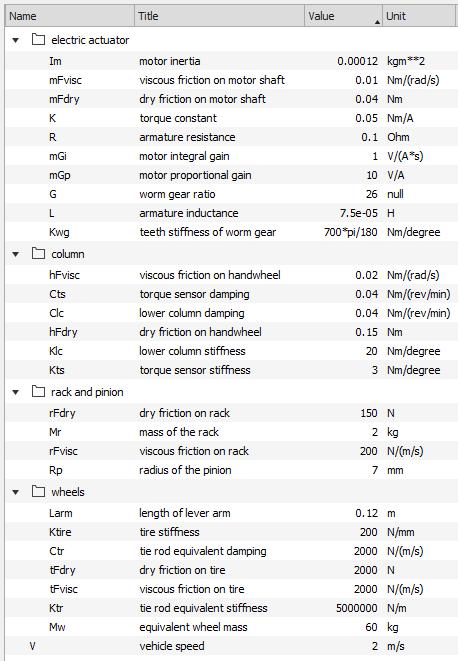
The detailed steering EPS model is analysed against the abovementionedboundaryconditionsandparameters. The output parameters such as angle at wheel, torque required at pinion, steering torque, motor friction, rack friction,columnfrictionfindingsareasfollows:
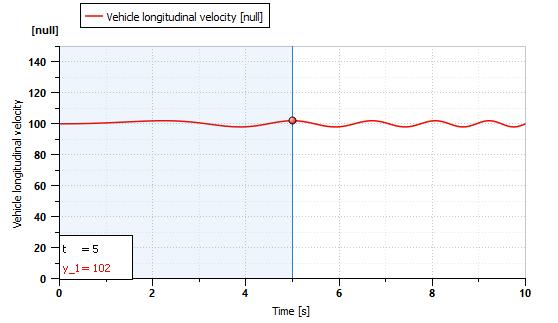
Chart –4: Angleatwheelvssteeringangle
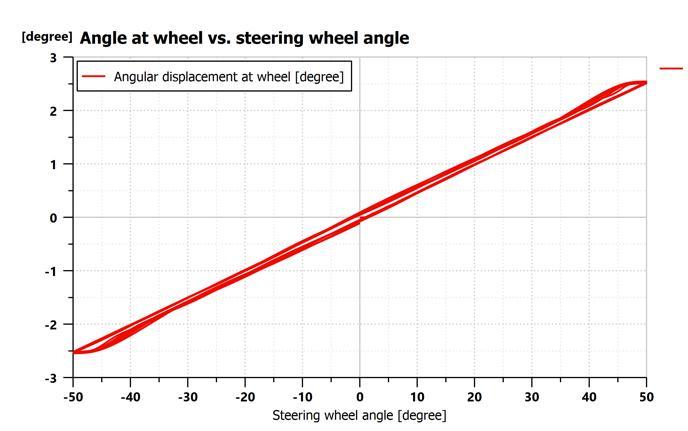
Inchart4,thegraphplottedbetweenthesteeringangleand angleatthewheel.Thisgraphsgivestheinformationabout

one of the geometric parameter i.e. the steering ratio. Steering ratio measures how much the steering wheel turns in relation to wheel turns in total and is defined as theratiobetweenthesteeringwheelangleandwheelangle onroad.

Steeringratio= 20
5.1 Effect of Vehicle Velocity
Table -2 Vehicle velocity vs torque requirement
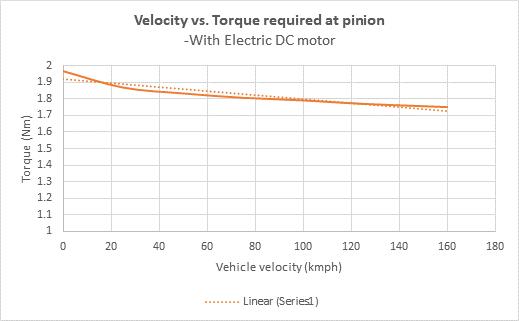
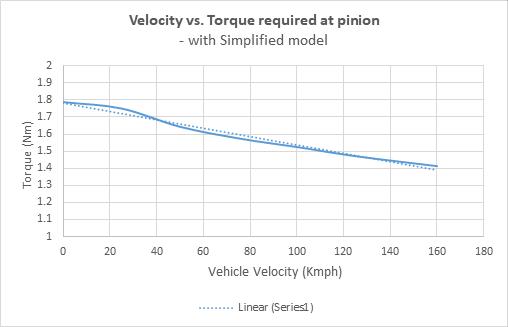
the model irrespective to the detailing as mentioned EPS1Dsketch.
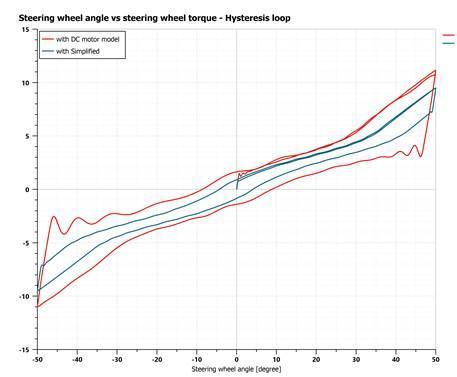
Chart1andchart2showthatthereisdownwardslopefor velocity vs pinion torque for both simplified and Electric DCmotormodel.However,becauseoftheaddedfrictionin detailed model, the required torque values are on higher side. To explain the above statement, chart 7 shows the hysteresis loop for steering angle vs steering torque for both the model. It is clearly evident that the area covered with the detailed electric model is greater than that the area covered in simplified model which signifies that becauseoftheaddedfriction,moretorqueisrequired.
Table2, shows the numerical output of the total torque required at different velocity which explains that as the velocityofthevehicleincreases,thetotaltorque (steering effort+electricassisttorque)keepsondecreasingforboth
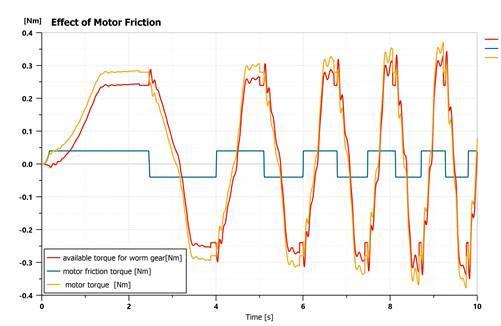
5.2 Effect of Motor Friction
Chart 9 represents the variation in the torque profile at the motor. The red color line represents the available torque for amplification at the worm and worm gear, which isthe resultantfromfriction torqueandthetorque correspondingtotheassistcurrentaspertheassistcurve providedinthemodel.
The torque applied on the rack and pinion comes from both the electric machine assistance and the driver through steering wheel. The magnitude of these two torque contributions are compared in chart 8, where the motortorqueismultipliedbythewormgearratioandthe amplified torque is the electric assistance torque applied onthepiniongear.
5.3
The summation of the steering effort and electric assist torqueisappliedatthepinionwhichconvertstherotating motionatpinionintolineardisplacementofrack.Therack isitselfhavingsomeinertiavaluewhichhaveanimpacton theavailablerack force whichfurtherdividesintotheleft andrightwheelthroughtierod.
Chart10showsthevariationoftherackfrictionforceand theavailablerackforcewithtime.
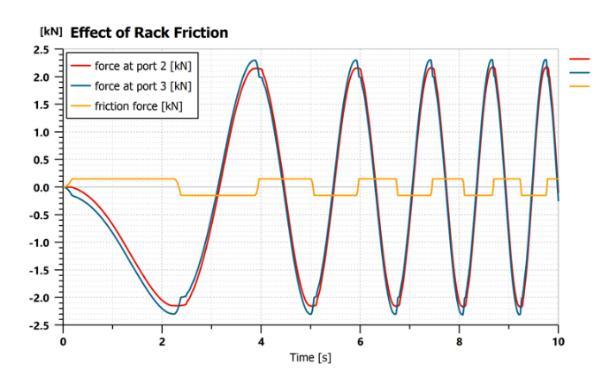
Thebluecolorlineistheactualavailablerackforceprofile.
5.4 Effect of column Friction
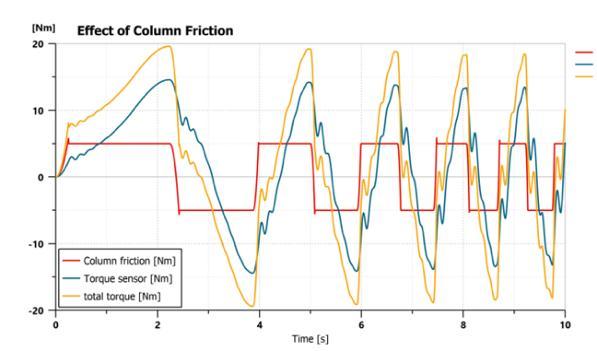
The chart 11 is plotted at v=160 kmph in the detailed model. The red color line shows the variation of the columnfrictioninrectangularpattern,changingitssignas perthesteeringangleprofileandbluecolorlineisforthe steeringeffort.However,thetotalsteeringforce(shownin yellow color) required at the steering wheel is the summation of the friction force and the one recorded by thetorquesensorthroughtorsionbar
6. CONCLUSIONS
In this work, the electric power assist steering system’s component are covered right from working principle to the modeling methodology. The law and mechanism of force and torque transferred are covered through 1Dimension model in Amesim environment with required setofinputparameters

Thetwodifferent1Dimmodelwithsimplifiedanddetailed model arepreparedandthe hysteresisgraphisplotted to know the comparison of added friction in the detailed model. However, the effect of the friction torque is evaluated at different point in the model to know the impact of motor friction, column friction and rack friction which can vary at different-different values to optimize the performance. Also, the performance of the dynamic behavior is evaluated with respect to vehicle longitudinal velocity which shows the decreasing pattern in total torquerequiredwiththeincreaseinthevehiclespeed.
The main focus of this work was to elaborate on the modeling Methodoly and highlight the way of evaluating the performance in the simulation environment. For this purpose, the dummy values of the passenger vehicle are taken into consideration. This work can be used as the benchmarktostartmodelingofthesteeringsystemandis capable to predict the performance of any new system with the slight change in the mass, stiffness, damping and CGvaluesetc.
Furthermore,toknowtheperformanceatthevehiclelevel suchasvehicletrajectory,roll,andpitchandyawrateetc., thesystemhastobeintegrated withthe completevehicle model either 15DOF or 18DOF, where along with the EPS model, the detailed model of tire, suspension, brakes, transmissionetc.arecovered.
ACKNOWLEDGEMENT
TheauthorsaregratefultoDr.ShoibIqbal,MihirBhambri, Richa Sachan, TATA Motors and authorities of National Institute of Technology Warangal for providing all facilities and support. This work is under copyright of TMPVL.
REFERENCES
[1] https://www.fortunebusinessinsights.com/industryreports/automotive-steering-system-market-101930
[2] Xue-Ping, Z., L. Xin, C. Jie and M. Jin-Lai, 2009, “Parametric design and application of steering characteristic curve in control for electric power steering,” Mechatronics,19:905-911.
[3] A.Isah,A.MohammedandA.Hamza,"ElectricPowerAssisted Steering: A Review," 2019 2nd International Conference of the IEEE Nigeria Computer Chapter (Nigeria Comput Conf), Zaria, Nigeria, 2019, pp. 1-6, doi: 10.1109/NigeriaComputConf45974.2019.8949620.
[4] Botti, J., Venizelos, G., and Benkaza, N., "Optimization of Power Steering Systems Vibration Reduction in Passenger Cars," SAE Technical Paper 951253, 1995,https://doi.org/10.4271/951253
[5] Hao Chen and Yali Yang, 2015. Study on Electric Power Steering System based on ADAMS and MATLAB.Journal of Software Engineering, 9: 868876.
DOI:10.3923/jse.2015.868.876
URL:https://scialert.net/abstract/?doi=jse.2015.868. 876.
[6] https://carbiketech.com/EPS,May25,2015.
[7] Lina Feng,Rongwei Shen,Xiaofei Wu, “Research on control strategy of the vehicle electric power steering system based on brushless DC motor, ” 3rd International Conference on Advances in Energy and Environmental Science 2015, doi:10.2991/icaees15.2015.94

[8] Kim, D. H., Tak, T. O., Kuk, M. G., Park, J. S., Shin, S. E., Song, S. J., … Cho, N. Y. (2007). Evaluation and
Experimental Validation of Steering Efforts Considering TireStaticFrictionTorqueandSuspensionandSteering Systems Characteristics. SAE Technical Paper Series.doi:10.4271/2007-01-3641
[9] M. M. Skarzynska, “Influence of steering column frictiononsteeringfeelAsimulatorstudy”
