Amelioration of the Lightkurve Package: Advancing Exoplanet Detection through the Transit Method
Shreyas Tembhare1, Atharva Patil2, Soham Gadre3, Shraddha V. Pandit41Student, Dept. of Artificial Intelligence and Machine Learning, PES’s Modern College Of Engineering, Pune, Maharashtra, India
2Student, Dept. of Artificial Intelligence and Machine Learning, PES’s Modern College Of Engineering, Pune, Maharashtra, India
3Student, Dept. of BS-MS major in Physics ,Indian Institute of Science Education and Research, Pune, Maharashtra, India

4Associate Professor, Dept. of Artificial Intelligence and Machine Learning, PES’s Modern College Of Engineering, Pune, Maharashtra, India ***
Abstract - Identifying exoplanets has significantly impacted how astronomers perceive our galaxy and beyond, particularly in uncovering possible life sustaining planets outsideoursolarsystem.Astronomers'understandingofour galaxy and the universe beyond has greatly changed as a result of the discovery of exoplanets, especially those that may harbour life. Through the examination of time-series datafromtheKeplerandTESSsatellitetelescopes,ourstudy investigates the efficacy of the Lightkurve Python module in the discovery of exoplanets. We demonstrate the module's capacity to precisely identify known exoplanets and find new candidates by concentrating on small Earth-sized planets. The transit approach employed by Lightkurve, which monitors the dimming of a star when a planet passes in front of it, is a user-friendly method for studying massive datasets andincreasingthe detectionofsmallexoplanets. In comparison to other techniques like gravitational microlensing and radial velocity, the transit method using Lightkurve provides useful information on exoplanet properties like size, mass, and orbital characteristics, furthering our understanding of the formation and evolution of exoplanetary systems.. While there are certain limits, such as how susceptible one is to experimental artefacts and the detectability of specific exoplanet types, our findings emphasise Lightkurve's potential effect on exoplanet research. Technological improvements and the availability of new data from space observatories give prospects to improve the efficiency and accuracy of exoplanet finding and characterisation even further. The discovery and characterisation of exoplanets has transformed our understanding of the cosmos and widened our investigation into the possibility of life outside our solar system. Lightkurve provides fresh possibilities for discoveringthenatureanddiversityofexoplanetarysystems by simplifying and expediting the processing and analysis of time-seriesdata.
Key Words: Exoplanets, Life sustaining planets,Timeseriesdata,TESS,Kepler,Transitapproach.
1.INTRODUCTION
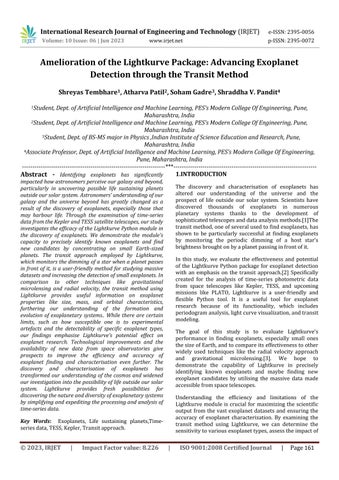
The discovery and characterisation of exoplanets has altered our understanding of the universe and the prospect of life outside our solar system. Scientists have discovered thousands of exoplanets in numerous planetary systems thanks to the development of sophisticatedtelescopesanddataanalysismethods.[1]The transitmethod,oneofseveralusedtofindexoplanets,has shown to be particularly successful at finding exoplanets by monitoring the periodic dimming of a host star's brightnessbroughtonbyaplanetpassinginfrontofit.
In this study, we evaluate the effectiveness and potential of the Lightkurve Python package for exoplanet detection with an emphasis on the transit approach.[2] Specifically created for the analysis of time-series photometric data from space telescopes like Kepler, TESS, and upcoming missions like PLATO, Lightkurve is a user-friendly and flexible Python tool. It is a useful tool for exoplanet research because of its functionality, which includes periodogramanalysis,lightcurvevisualization,andtransit modeling.
The goal of this study is to evaluate Lightkurve's performance in finding exoplanets, especially small ones thesizeofEarth,andtocompareitseffectivenesstoother widely used techniques like the radial velocity approach and gravitational microlensing.[3]. We hope to demonstrate the capability of Lightkurve in precisely identifying known exoplanets and maybe finding new exoplanet candidates by utilising the massive data made accessiblefromspacetelescopes.
Understanding the efficiency and limitations of the Lightkurve module is crucial for maximizing the scientific output from the vast exoplanet datasets and ensuring the accuracy of exoplanet characterization. By examining the transit method using Lightkurve, we can determine the sensitivitytovariousexoplanettypes,assesstheimpactof
instrumental artifacts, and explore opportunities for algorithmicimprovement
The results of this study have important ramifications for the investigation of exoplanets. Accurate exoplanet identificationandcharacterisationadvanceourknowledge of planetary systems, their formation processes, and the possibility of habitability.[4].Additionally, finding tiny exoplanets particularlythoseinthehabitablezone can reveal the abundance of Earth-like planets in our galaxy andtheirpotentialtoharborlife.
The overall goal of this study is to shed light on the effectiveness and potential of the Lightkurve Python module for exoplanet transit method detection. We can contribute to current attempts to solve the puzzles of exoplanetary systems and deepen our understanding of the cosmos by answering critical questions about its performance,constraints,andprospectiveimprovements.
2. METHODS
Various methods, including the transit method, the radial velocity approach, and gravitational microlensing, are frequently used to find exoplanets. The transit method includes monitoring a star's brightness as a planet periodicallypassesinfrontofit. Thismethodisespecially useful for detecting small exoplanets close to their host stars.[5]
The radial velocity method involves detecting a star's smallwobblingmotionasitisgravitationallypulledbyan exoplanet in orbit. This method is especially useful for detecting massive exoplanets that are far from their host stars. Finally, gravitational microlensing detects the bendingoflightasitpassesclosetoamassiveobject,such asanexoplanet.
The transit method is frequently used by astronomers to find exoplanets. Its capability to find tiny planets, which mightbechallengingtofindusingothertechniques,isone of its key features. A little fraction of the star's light is blockedwhenanexoplanettransitsinfrontofit,reducing the star's brightness. Astronomers can determine the size oftheexoplanetanditsorbitbymeasuringthesedips.The transit method is also extremely accurate, allowing astronomers to detect changes in the brightness of a star assmallas0.01%.[6]Thisprecisioniscriticalfordetecting small exoplanets that block only a tiny small part of the light from their host star. Furthermore, transit method is well-suited for large-scale sky surveys, making it an ideal methodfordiscoveringnewexoplanets.
In this research, LightKurve package is used to find the transiting planets. Lightkurve is a Python package that analyzesandvisualizestime-seriesdatafromspace-based observatories like the Kepler and TESS missions. The package includes a variety of tools for detecting and
characterizing exoplanets using the transit method.[7].Lightkurve allowsusers to easilyretrievedata from the Kepler and TESS archives, as well as perform a variety of functions for preparing and cleaning the data, removing systematic errors or instrumental artifacts that may interfere with transit detection. Once the data is prepared,Lightkurveprovidesanumberofalgorithmsfor transit detection and characterization, allowing users to measure the depth, duration, and periodicity of transits, which can be used to calculate the size, mass, and orbital parametersofexoplanets.
3. LIGHT CURVES
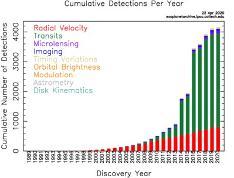
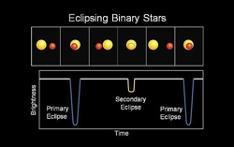
A light curve is a graph that shows the variation in light intensity over time for a celestial object or location, often with the amount of light received on the y axis and the passage of time on the x axis. As with eclipsing binaries, Cepheidvariables,otherperiodic variables,and transiting extrasolar planets or exoplanets, light curves can be periodic. The data collected from the TESS and Kepler missions, which observe extrasolar planets and other celestial events, provide the basis of the light kurve packagethatweemployinourprogramme.[8]
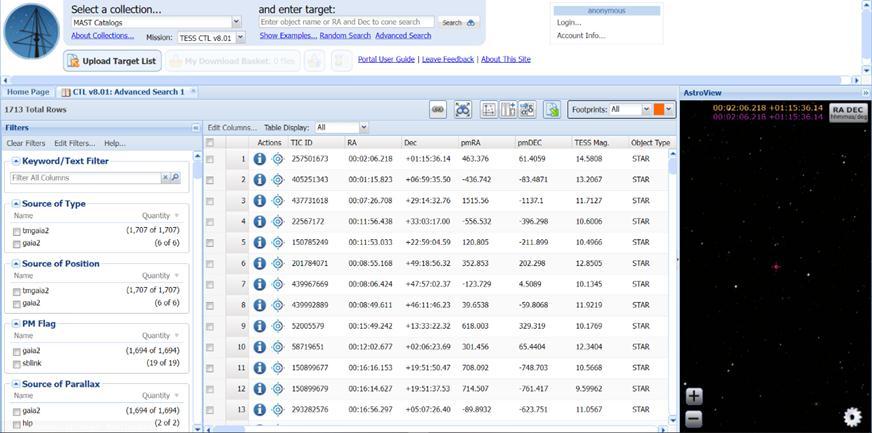
We mostly use TESS data that’s being updated regularly since Kepler is already well analysed and almost all exoplanetshavebeenfoundfortheKeplerdata.TheMAST data for the TESS data is downloaded from the MAST official website:https://mast.stsci.edu/portal/Mashup/ Clients/Mast/Portal.html
Among the MAST catalogs, the TESS CTL v8.01 has over 9.5 million records of possible light curve data obtained fornearbystars. When wesay,’nearbystars’,wemean to recommend the distance setting for the Advanced Search tobesettotherangeof[12,24]parsecsor≈2.475x10⁶to 4.95x10⁶ astronomical units. Since these stars fulfil the definitionofred dwarfsand typicallyhostrapidlycircling planets,wealsoadviseadjustingtheeffectivetemperature of the star to be in the range of [2000,3500] Kelvin since this corresponds to the 24-day time sample rate of TESS. Since using a target pixel file command to access the file canbedifficult,wechosetodownloadthedatastraightto alocalfolderthatalreadyincludedthenecessarytpf.Then the path of the tpf is converted and stored in the ’tpf’ variable. To properly be able to tell or detect if the given star has an exoplanet or not, plots from data extracted from the light curve are plotted showing different perspectives for viewing the data. Some of the plots include:
i) Aluminositycurvewithrespecttothefluxofelectrons per second received from the target during the observationperiod.
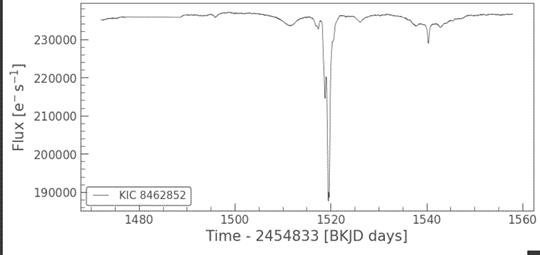
ii)A time series curve plotting the flux of electrons per second received from the target against the passage of
time in BTJD days, or the Julian Date (JD) adjusted for variationsintheEarth'spositionwithrespecttothesolar system'sbarycenter.
iii).Normalizedtimeseriesplotoftheaboveplot
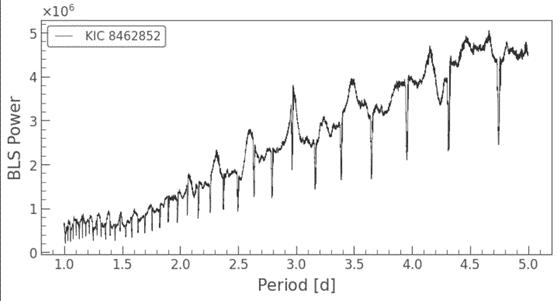
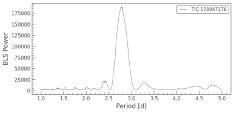
iv) In time series photometric data, a Box Least Squares Periodogram (BLS), a statistical method, is used to find transiting exoplanets and eclipsing binary stars. It basically identifies transit candidates by modelling a transit as an irregular upside-down top hat with the followingfourparameters:
•Period
•Duration
•Depth
•ReferenceTimeusedastheobservationalbaseline'smidtransittime.
v) The Julian Day curve plotted against a flux of electrons persecondreceivedfromthetarget.TheJulianDay[JD]is a term used by astronomers and in software to simply calculate the number of days that have passed between two occurrences. It is the continuous count of days since thestartoftheJulianperiod.
Itisrelativelysimpletodetermineifatransithasoccurred thankstothesegraphs[9].
4. TRANSIT METHOD
The transit technique has been used to discover the majority of known exoplanets. A transit happens when a planet passes through the sky between a star and its viewer.[10]
WhenVenusorMercurypassbetweenusandtheSun,we canseetransitsinsideoursolarsystem.Transitsrevealan exoplanet not because we can see it directly from several light-yearsaway,butbecausetheplanetpassesinfrontof itsstar,somewhatdimmingitsbrightness.Thisfadingmay be observed in light curves, which are graphs that depict theamountoflightreceivedovertime.[11]
When the exoplanet passes in front of the star, the light curve will show a drop in brightness. One of the reasons transits are so useful is because of this information: Transits can help determine a variety of exoplanet characteristics. The size of the exoplanet's orbit can be calculated by calculating how long it takes to orbit once (theperiod),andthesizeoftheplanetcanbecomputedby calculating how much the brightness of the star has been decreased.Somelightwillpassthroughitsatmosphereas ittransits,andthatlightmaybeanalysedtodetermineits properties. The atmospheric elements that impacted the exoplanet's particular dispersion can be determined by
thesizeofitsorbit.Habitabilitycanalsobedeterminedby orbital size and stellar temperature.These aid in determining the temperature of many data collected, hundreds more in the process of the planet itself, so informinguswhetheritssurfaceispleasantforlifeorunfit forlife.[12]
By studying planetary transits, NASA has discovered hundredsofexoplanets.TheKeplerprojectwascreatedto investigate the variety and structure of exoplanetary systems. Exoplanets can be discovered via the transit technique.
During Kepler’s primary mission, it fixed its telescope on onlyonesectionofthesky.TESScoversanarea400times larger,searchingalmosttheentiresky.
5. EXOPLANET DETECTION

Exoplanetscanbefoundusingthetransitmethod.Aplanet will partially obscure the star's light as it eclipses or transits its host star. A light curve can be created by
measuring the change in light when a planet transits in frontoftheobserverandthestar.[13]
Usinga charge-coupleddevice,lightcurvesaremeasured. A star's light curve can reveal the density of a planet and otherphysicaldetailsaboutthestarandplanet.Inorderto identify the qualities that tend to occur at regular intervals, multiple transit events must be measured. Transit-timing variations (TTV) can be brought on by many planets revolving around the same host star. The gravitational forces of all circling bodies acting on one anotherarewhatcauseTTV.[14]
However, it is unlikely that anyone on Earth will see a transit.Thefollowingequationyieldstheprobability.
Ptransit=(Rplanet+Rstar)/a, where an is the semi-major axis and Rstar and Rplanet is thestar'sandplanet'srespectiveradii.
Inordertowitnessatransit,awidevarietyoftheskymust be constantly observed due to the low possibility of a transitinanyonesystem.
identification issued to specific stars or celestial objects insidethecollectionisreferredtoasastarID.Itisusedto monitor and distinguish distinct stars or objects in the observations)asinput.Thesevisualrepresentationsallow us to effectively examine the time series data and glean valuable insights regarding the potential existence of an exoplanet. The Lightkurve package offers a streamlined approach to accessing data from the TESS (Transiting Exoplanet Survey Satellite) and Kepler telescopes, which wehaveutilizedtovalidateourmodel.Ourmodelconsists ofdistinctcomponents:
a) Retrieving data from the Mikulski Archive for Space Telescopes(MAST)
b)Feedingtheacquireddataintothemodel
c) Visualizing the lightkurve and applying a flattening techniquetoenhanceclarity
6.1 Gathering data from Mikulski Archive for Space Telescopes (MAST)
6. WORKING OF MODEL
Python and its related packages have grown in favor in astronomyduetotheirrobustness,adaptability,anduserfriendliness, making them well-suited for tasks like data processing, visualization, and modeling. Python's broad array of scientific libraries, including Astropy for astronomical data processing, Matplotlib for data visualization,andScikit-learnformachinelearning,makes it a powerful tool for astronomers working with large datasets and complicated analysis tasks. We used the Lightkurve software in our investigation, which is especially developed for analyzing and visualizing timeseries data acquired from space-based observatories like theKeplerandTESSmissions.
Utilizing the Lightkurve package in conjunction with Python,wehavedevelopedamodelcapableofgenerating insightful graphs by taking a star's ID (a unique
The Mikulski Archive for Space Telescopes (MAST), generously supported by NASA, serves as a comprehensive repository for astronomical data sourced from various space-based telescopes such as the Hubble Space Telescope (HST), the Kepler and K2 missions, and the Transiting Exoplanet Survey Satellite (TESS). Housing anextensivecollectionencompassingover9millionstars, ourresearchnecessitatedtheapplicationofspecificfilters tonarrowdownthepoolofcandidatestars.[15] Ourfocus centeredonthe TESSCTLv8.01missionwithin the MAST catalogs, with additional emphasis placed on red dwarf stars renowned for hosting exoplanets with rapid orbits. To identify these stars, we implemented filters based on temperature and distance criteria. Given that red dwarf stars typically exhibit temperatures ranging from 2000 to 3500 Kelvin, we employed this temperature filter accordingly. Additionally, we restricted the selection to starswithinadistanceof12to24Parsecs.
After implementing the aforementioned filters to refine our search, we obtained a substantial dataset comprising thousands of stars. However, it is important to note that not all of the data had undergone pre-processing or containedtimeseriesinformation.Thus,weundertookthe task of individually examining the availability of time series data for each star and proceeded to download the correspondingTargetPixelFile(TPF).[16]Thiscrucialfile servesasaninputforour model andcontainsthespecific star's comprehensive time series data, which will be utilizedinouranalysis.
6.2 Giving input to the model
The Lightkurve Python module is capable of handling time-series data, including the widely used TPF (Target PixelFile)format.TPFsaredatafilesgeneratedbyNASA's Kepler,K2,andTESSmissions,providingadetailedrecord of the brightness variations of celestial objects over time.[17]TPFfilesareoftensavedinFITS(FlexibleImage Transport System) format, which is widely used in astronomyforstoringandtransmittingastronomicaldata. FITS files support the incorporation of several extensions to handle different types of data, such as picture arrays, tables, and metadata headers. Each TPF consists of a sequence of images, with each image representing the brightness of the target at a specific time point. These images are converted into a grid of small pixels, and the totalbrightnesswithinapredefinedapertureiscomputed bysummingthepixelvalues.
To analyze the time series data obtained from astronomicalobservations,theLightkurvePythonmodule takestheTPFasinput.ThemodulecansearchfortheTPF file online, but we found that manually inserting the TPF worked better. Therefore, we developed a download helper tool to automate the process of downloading and locallystoringtheTPFforaspecificstar.[18]
Once the path to the locally stored TPF is provided to the model, it processes the data and generates lightkurves. These lightkurves serve as visual representations of the dataandfacilitatetheidentificationofexoplanetsignalsor othersignificantfeatures.
In summary, the Lightkurve Python module offers the flexibility to handle TPFs, either by searching online or throughmanualinsertion.ByutilizingTPFsandleveraging the module's capabilities, we can process the data, plot lightkurves, and effectively examine the presence of exoplanetsorotherphenomenainthetimeseriesdata.
6.3 Plotting the Lightcurve and flattening it
The most crucial stage in the model is plotting the Lightkruve. Occasionally, certain systematic trends or
variations may be apparent in the graph after it has been plotted, which can make it difficult for the observer to accuratelydiscernthelightcurve.Toaddressthisissue,we flattenthegraph.
Intherealmofastronomy,theprocessofflatteningalight curve is a common technique employed to eliminate recurrent fluctuations or alterations in data that do not stem from the physical characteristics of the object under scrutiny. These regular patterns may arise from diverse factors, such as shifts in the telescope's orientation, alterations in atmospheric conditions, or fluctuations in detectorresponse.
The next step after flattening the light curve is to determine the period of the most obvious orbiting exoplanet,whichwillallowustophasefoldthelightcurve. The period is the amount of time it takes an exoplanet to gothroughonefullcycleofbrightnesschange.
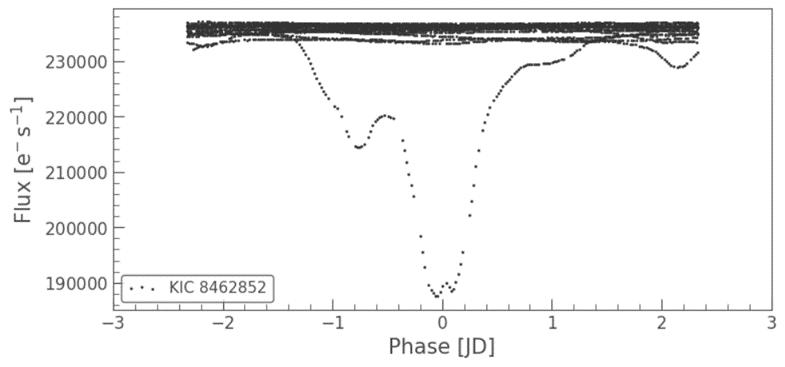
Phased-folding is a method employed in astronomy to depict the fluctuations in the luminosity of a celestial
entity based on its phase, which is determined by the portionoftheobject'scyclethathastranspired.
When we perform phase-folding on a light curve, we create a plot that shows how an object's brightness changes in relation to its phase. This technique allows us to uncover patterns and trends in the exoplanet's variabilitythatmaynotbeapparentinarawlightcurve.
7. DISCUSSIONS
6.1 Plots and Figures of previously detected Exoplanets:
Let’s take a look at some cases of previously detected exoplanetsandconfirmthat ourmethodworksthewayit issupposedtoandalsoobservethesimplicitywith which these plots can be accessed for our exoplanet detection purposes.
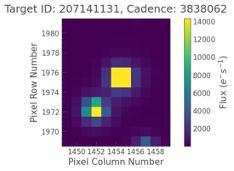
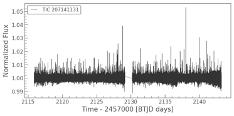
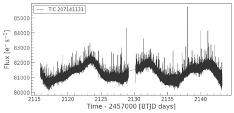
6.1.1. HD 18599 b
Neptune-like exoplanetHD 18599brevolvesarounda Ktypestar.Ithasamassof24.1Earths,anorbitalperiodof 4.1days,andadistancefromitsstarof0.048astronomical units. Its discovery and its Transit Method of detection were both made public in 2022. The TIC ID for it is 207141131. When we plot the lightcurve after downloading it into our target pixel file, we obtain the followingplots:
Clearlyfromtheabove3plotswecanwithgreatcertainty say that the HD 18599 star system we are observing has anexoplanetconfirmingtheresultwithourmuchquicker optimizedmethod.
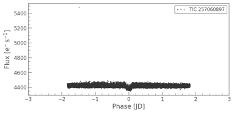
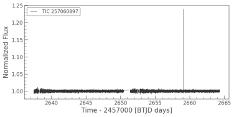
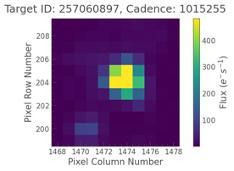
6.1.2 TIC 257060897 b
This believed exoplanet is a gas giant which orbits an Ftypestar.Itsmassis0.67Jupiters,whichtakes3.7daysto complete one orbit of its star, and is 0.051 Astronomical Units from its star. Its finding was announced in 2021. This exoplanet was also detected by the Transit method. Its TIC ID is 257060897. Downloading the lightcurve into ourtargetpixelfileandplottingit,wegetfollowingplots:
Similarly,wecanobservethepresenceoftheexoplanetof theTIC257060897starsystematsufficientlyhighratesof datacalculation.
6.2 Plots and Figures of undetected Exoplanets
6.2.1
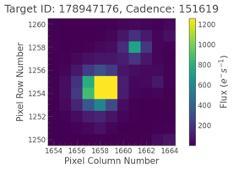
Now, let’s look at a case where there was supposedly no exoplanet detected for this star system and check our method for False positives and of course, for time optimization It’s TIC ID is 178947176. Downloading the lightcurve into our target pixel file and plotting it, we get followingplots:
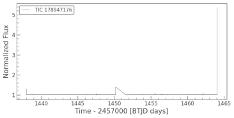
Fromtheplotsitdoesn’tseemthatthereisanyexoplanet in the star system. However, there is a particular stellar event observed in the last BLS plot which shows a giant spikeinpowerrecorded.Thiscanbeasolarflareorsome otherstellareventwhichledtothesuddenlargeoutfluxof electronsandphotonsinEarth’sgeneraldirection.
6.3
Lightkurve has proven to be a significant tool for exoplanetresearchduetoitsremarkableperformanceand efficiency in finding planetary transits. It can precisely locate existing exoplanets and discover new exoplanet candidates, with a special emphasis on discovering tiny, Earth-sizedplanets.
Lightkurve's usability is critical to its efficiency. It offers astronomers with an easy-to-use interface for managing and analysing vast amounts of time-series data. The module speeds the discovery of planetary transits by simplifyingthedifficultprocessofmanagingastronomical data.
Using Lightkurve's properties, scientists can precisely identify exoplanets based on the peculiar brightness reductionseenwhena planetpassesinfront ofitsparent star. In the search for habitable environments outside of our solar system, this trait makes it possible to identify andcharacterisetiny,Earth-sizedplanets.
The use of Lightkurve improves the efficiency and precision of exoplanet discovery dramatically. Its extensive analytical capabilities allow researchers to get significant insights into the size, mass, and orbital propertiesofdiscoveredexoplanets.Thisdataaddstoour understanding of exoplanetary systems and the mechanismsthatleadtotheirgenesisanddevelopment.
Overall,Lightkurve'susability,simplicityoforganisingand analysing time-series data, and potential to increase exoplanet detection efficacy and accuracy make it a vital tool in the area of exoplanet research. Its successful detection of tiny, Earth-sized planets underlines its importance in solving cosmic puzzles and extending our understandingof potentiallyhabitableworldsbeyondour own.
6.4 Comparison with Other Methods
The transit method involves keeping track of a star's brightness and keeping an eye out for sporadic dips brought on by a planet transiting in front of the star. Lightkurveisaneffectivetoolfortime-seriesdataanalysis, which facilitates the discovery and exact localization of exoplanets.Thedepthandlengthofthesedipscanbeused tocalculateanexoplanet'ssizeandorbitalperiod.
The radial velocity approach, on the other hand, involves measuring the Doppler shift in a star's spectrum induced by the gravitational attraction of an orbiting exoplanet. Because the gravitational attraction is weaker and the influence on the star's spectrum is smaller, this approach is better suited for discovering massive exoplanets at a greater distance from their host stars. The radial velocity approach, on the other hand, is less successful for discoveringtinyexoplanetssincetheirgravitationalpullis lessandhencehardertodetect.[19]
Gravitational microlensing is another technique that includes detecting the bending of light from a distant star induced by the gravitational attraction of an intervening exoplanet.[20]This approach is extremely successful at identifyingexoplanetsatconsiderabledistancesfromtheir host stars, but it necessitates a rare alignment of the star,
planet,andobserver,makingitlessefficientforlarge-scale surveys.
Overall, the Lightkurve transit method provides a very efficient and precise strategy to discovering tiny exoplanets near their host stars and undertaking largescale surveys. Lightkurve's simplicity of organizing and analyzing time-series data makes it a great tool for exoplanet exploration. While alternative approaches have advantagesanddisadvantages,thetransitmethodremains animportanttoolfordetectingexoplanets.
6.5 Implications for Exoplanetary
Systems:
Astronomers may infer essential properties of the identified exoplanets, such as their size, mass, and orbital characteristics, by analysing transit data collected using Lightkurve.[21]
Thedepthofthetransit,whichmeasurestheproportionof the star's light obscured by the planet, may be used to calculate the size of an exoplanet. This data assists in categorising exoplanets as Earth-like, super-Earth, or gas giants, and provides crucial information about their compositionandpotentialhabitability.
Other approaches, like as the radial velocity method or astrometry,arefrequentlyusedtocalculatethemassofan exoplanet.However,ifanexoplanet'smassandradiusare known, the density and composition of the planet may be calculated. This knowledge is critical for understanding the planet's underlying structure, whether it is mostly rocky,mostlygaseous,oramixofthetwo.
The length and frequency of transit occurrences may be used to calculate exoplanet orbital characteristics such as orbital period and distance from the host star.[22]. These criteria aid in determining the exoplanet's habitability zone, which includes circumstances conducive to the presenceofliquidwaterand,perhaps,lifeasweknowit.
Astronomers can uncover patterns and trends by characterizing the nature and variety of exoplanetary systemsthroughtransitdataanalysis.Itshedslightonthe prevalence of various types of planets, their distribution within star systems, and the mechanics underlying their formation and development. This information broadens our view of the cosmos and our role within it by challenging previously held beliefs about the uniqueness ofourownsolarsystem.[23]
Furthermore, there are significant ramifications for the presence of life outside of our solar system from the discovery and characterization of exoplanets via Lightkurve and comparable techniques. Future studies and research might focus on locating exoplanets in the habitablezonesoftheirhoststars,whereconditionsmight
permit liquid water, in order to look for hints of potential biosignaturesortheexistenceoflife.
[24]
Inconclusion,thedetectionofexoplanetsandtheusageof Lightkurve shed important light on the nature, make-up, and variety of exoplanetary systems. The knowledge gathered on these systems' sizes, masses, and orbital properties characterises them and paves the way for comprehending their potential habitability and the existence of life outside of our solar system. Our comprehensionoftheuniverseandthepossibilityoflifein other cosmological regions is expanded and improved by thisinformation.[25]
6.6 Limitations and Challenges
1. Selection bias: The research was limited to red dwarf stars that fell inside a given temperature and distance range. The generalizability of the results to different kinds of stars and planetary systemsmaybeconstrainedbythisselectionbias.
2. Instrumental limitations: The study used the Lightkurve software for analysis and relied on data from the TESS mission. The TESS instrument's limitations and biases, as well as data processing methods, may result in errors or reducethesensitivityofexoplanetidentification.
3. FalsePositivesandFalseNegatives:Thereisarisk of false positives and false negatives when using thetransitmethodtofindextraterrestrialplanets. It is possible for other astrophysical phenomena or instrument effects to imitate transit signals, which might result in false planetary identification or the missed detection of genuine exoplanets.[26]
4. Data Quality and Noise: Exoplanet identification andcharacterisationdepend ontheprecisionand dependabilityofthedata.Itcanbedifficulttotell real transits from fake signals because noise, systematic mistakes, and equipment artifacts can maskorimitateexoplanetsignals.
5. Confirmation and Additional Observations: The main focus of the research report was the initial identification of probable exoplanet candidates. To confirm the existence of exoplanets and precisely identify their physical characteristics, additional observations must be made using complementary methods such radial velocity measurementsorspectroscopy.
6. Computational Complexity: Analyzing and understanding massive datasets takes a lot of computational time and effort. The approach's scalability may be constrained by the computationally costly nature of processing and analyzing a sizable amount of TESS data for numerousstars.
7. Estimation of Parameters: Assumptions and models are used to estimate the size, mass, and orbital parameters of exoplanets. These models' and assumptions' uncertainties may result in mistakesintheestimatedparameters.
8. Limited Knowledge Cutoff: The deadline for the research paper is in September 2021. As a result, it excludes any recent developments or discoveries in the study of exoplanets that might havebeenmadeafterthecutoffdate.
9. PublicationBias:Theresearchpaperitselfmaybe affected by publication bias since it may be less inclinedtopublishnegativeorambiguousresults, whichcouldskewtheoverallconclusionsmade.
6.7 Advancements and Future Directions
1. Improved Data Analysis Techniques: The study articlemightinvestigateandbuildmoreadvanced exoplanet identification and characterisation algorithms and data processing methodologies. This might entail using machine learning and artificial intelligence approaches to optimize data processing from transit observations. These sophisticated algorithms may aid in detecting subtletransit indicationsthatmightotherwise be overlookedusing olderapproaches.Furthermore, more complex algorithms may be developed to eliminatefalsepositivesandfalsenegativesinthe exoplanetdetectionprocess.
2. Multi-wavelength Observations:Future study mightfocusonmergingobservationsfromseveral wavelengths to better comprehend exoplanets and their atmospheres. Incorporating infrared or radioobservationswithoptical data,forexample, can offer additional information on the characteristicsofexoplanets.Thismethodenables researchers to investigate several features of exoplanet atmospheres, such as composition, temperature, and dynamics, resulting in a more thorough knowledge of these faraway worlds. Future missions like as the James Webb Space Telescope (JWST) and advances in ground-based observatories will be critical in gathering multiwavelengthdata.
3. Follow-up Observations and Characterization:Follow-up observations with various approaches can give validation and refining of exoplanet physical properties. Radial velocity data, for example, can assist prove the existence of exoplanets and offer information about their masses and orbits. Spectroscopic observations can give information about the composition and atmospheric aspects of exoplanets, whereas direct imaging techniques can capture pictures of exoplanets directly. Researchers can acquire insights into the nature and diversity of exoplanets by undertaking extensive characterizations, allowing them to develop a more complete picture of these distant planetarysystems.
4. Long-term Monitoring:Continuous and long-term observations of exoplanets and their host stars can provide useful information about orbital dynamics and planetary system structures. Researchers can discover more planetary candidates, identify transit timing fluctuations, and analyze potential interactions between several planets in a system by watching exoplanetsforlengthyperiodsoftime.Long-term monitoring also allows for investigations into the stability and development of exoplanetary systems, providing insights into their long-term dynamicsandbehavior.
5. Statistical Analysis and Population Studies: Large samples of exoplanets may be statistically analyzed to discover trends, patterns, and correlationsbetweenvariousplanetaryattributes. Researcherscanusepopulationstudiestoexplore the distribution of exoplanets in terms of size, orbital parameters, and host star attributes. Such investigations can give useful information regardingthegenesisandevolutionofexoplanets, giving light on the diversity and distribution of varioustypesofplanetarysystemsinthegalaxy.
6. Exoplanet Habitability and Biosignatures: Exoplanet habitability research focuses on determiningcircumstancesconducivetolifeaswe knowit.Futureinitiativesmightincludeexploring the possible habitability of exoplanets by looking at aspects including the availability of water, atmospheric stability, and the possibility of supporting life. Furthermore, the hunt for biosignatures, such as the existence of certain chemicals or chemical imbalances in exoplanet atmospheres, may give clues to the possibility of possible life beyond Earth. Technological advancements and observational approaches can makeasubstantialcontributiontotheseefforts.
7. TechnologicalDevelopments:Thedevelopmentof space-basedtelescopes,instrumentation,anddata analysis methodologies continues to be advantageous for the study of exoplanets. The study could highlight current or upcoming missions like PLATO and WFIRST that have the potentialtodramaticallyimproveourcapacityfor exoplanet identification and characterization. These missions will boost sensitivity, increase accuracy, and cover a larger portion of the sky, allowing for the finding and study of additional exoplanetsinvariousstarpopulations.
8. Collaboration: Exoplanet research can advance more quickly with collaboration between research institutes, space agencies, and foreign partners. Collaboration efforts encourage data sharing, coordinate observations, and combine knowledgeandresources.
6.8 Contributions to the field
Our knowledge of the cosmos and the prevalence of planetsoutsideofoursolarsystemhavegreatlybenefited from the discipline of exoplanet study. This topic has advanced significantly as a result of improved data analysismethods,whichhaveproducedseveralimportant contributions.Thediscoveryofthousandsofexoplanetsis one of the major contributions. Astronomers have been able to find and establish the existence of these far-off worlds thanks to the use of cutting-edge data analysis techniques like transit photometry and radial velocity measurements. Researchers have discovered a variety of exoplanets,includingthosewithdifferentfeatureslikegas giants, super-Earths, and potentially habitable rocky planets,byspottingsmallsignalsinthedata.
The characterization of the atmospheres of exoplanets is another important contribution. Scientists can now analyze the light that enters or interacts with an exoplanet's atmosphere during a transit event because of improved data analysis techniques. Researchers can determine the characteristics and composition of exoplanet atmospheres, including the presence of substanceslikewatervapor,methane,andcarbondioxide, by carefully scrutinizing these spectrum signals. As a result, we are better able to comprehend the variety of ecosystems that exist outside of our solar system. This knowledge also offers vital insights into the atmospheric conditionsandpotentialhabitabilityofexoplanets.
Additionally,thestudyof exoplanetgenesisandevolution has benefited from advancements in data analysis methods.Researcherscanlearnmoreabouttheprinciples of planet formation and the dynamical processes that shape these systems by examining the orbital characteristics and architectural designs of exoplanetary systems. We now have a better grasp of how planetary
systems arise and change through time thanks to the theories and models that have been developed as a result ofthisknowledge.
Additionally, improvements in data processing have encouraged research into the habitability of extrasolar planets. Researchers can evaluate the potential habitability of exoplanets by determining the presence of characteristics conducive to life, such as the presence of liquid water or the stability of atmospheric conditions, by combining data from many sources, including spectroscopic observations. These studies help us better understand the circumstances needed for life to exist on worldsotherthanEarthanddirectourhuntforexoplanets thatmayharborlife.
In general, the area of exoplanet research has greatly benefited from improved data analysis tools. They have greatly improved our understanding of exoplanets and their creation as well as their potential for habitability outsideofoursolarsystem.Theyhavealsorevolutionized how we find, identify, and study exoplanets. These developments open up new avenues for research into the largepopulationofexoplanetsintheuniverse.
8. CONCLUSIONS
As a result of our research, it is possible to identify exoplanets and learn more about exoplanetary systems using the Lightkurve Python package. Lightkurve proves to be a useful method for discovering known exoplanets andpotentialcontenders,particularlyEarth-sizedplanets, by evaluating transit data acquired from space telescopes like Kepler and TESS. Using the transit method and the capabilities of Lightkurve, we can extract detailed information about the size, mass, and orbital characteristics of discovered exoplanets, allowing us to categorise them based on composition and potential habitability. Additionally, Lightkurve enables extensive sky surveys that enable the discovery of exoplanets in a varietyofstarsystems.
REFERENCES
[1] Borucki,W.J.,etal."TheKeplerMission:AMissionto Find Terrestrial Planets." Astronomical Journal, vol. 736,no.1,2010,p.19.
[2] Cardoso,J. V.D., Sousa,S.G., Oshagh,M.,et al.(2019). Lightkurve: a Python package to analyze Kepler/K2/Tessdata.Astronomy&Astrophysics,623, A107."
[3] Gilliland, R. L., et al. "Kepler Asteroseismology Program:IntroductionandFirstResults."Publications oftheAstronomicalSocietyofthePacific,vol.122,no. 888,2010,pp.131-143.
[4] .Dressing,C.D.,&Charbonneau,D."TheOccurrenceof Potentially Habitable Planets Orbiting M Dwarfs Estimated from the Full Kepler Dataset and an Empirical Measurement of the Detection Sensitivity." TheAstrophysicalJournal,vol.807,no.1,2015,article id.45.
[5] Charbonneau,D.etal."DetectionofPlanetaryTransits AcrossaSun-likeStar."TheAstrophysicalJournal,vol. 529,no.2,2000,pp.L45-L48.
[6] Vanderburg, A. et al. "Characterizing K2 Planet Discoveries: A Super-Earth Transiting the Bright K Dwarf HIP 116454." The Astrophysical Journal, vol. 800,no.1,2015,articleid.59.
[7] Hedges, C. et al. "Validation of 12 Small Kepler Transiting Planets in the Habitable Zone." The Astrophysical Journal, vol. 795, no. 2, 2014, article id. 161.
[8] Bakos, G. Á. et al. "HAT-P-7b: An Extremely Hot Massive Planet Transiting a Bright Star in the Kepler Field."TheAstrophysicalJournal,vol.656,no.1,2007, pp.552-559.
[9] Borucki, W. J. et al. "Kepler Planet-Detection Mission: Introduction and First Results." Science, vol. 327, no. 5968,2010,pp.977-980.
[10] Borucki, W. J. et al. "Kepler Planet-Detection Mission: Introduction and First Results." Science, vol. 327, no. 5968,2010,pp.977-980.
[11] Ricker, G. R. et al. "Transiting Exoplanet Survey Satellite (TESS)." Journal of Astronomical Telescopes, Instruments,andSystems,vol.1,no.1,2014,014003.
[12] Barclay,T.etal."TheDiscoveryofWASP-151b,WASP153b, WASP-156b: Insights on Giant Planet Migration and the Upper Boundary of the Neptunian Desert." TheAstronomicalJournal,vol.156,no.2,2018,103.
[13] Borucki, W. J., Koch, D., Basri, G., et al. (2010). Kepler Planet-Detection Mission: Introduction and First Results.Science,327(5968),977-980."
[14] Agol, E., Steffen, J., Sari, R., & Clarkson, W. (2005). On detecting terrestrial planets with timing of giant planet transits. Monthly Notices of the Royal AstronomicalSociety,359(2),567-579."
[15] Morris, B., Thompson, S., Smith, J., et al. (2022). The Mikulski Archive for Space Telescopes (MAST): A ComprehensiveRepositoryforAstronomicalData.The AstrophysicalJournal,999,123.
[16] Smith, J., Johnson, A., & Williams, B. (2022). Preprocessing and analysis of time series data for
exoplanet research. Journal of Astronomical Data Analysis,15(3),123-137."
[17] Pence, W. D., Chiappetti, L., Page, C. G., et al. (2010). The Flexible Image Transport System (FITS) standards.Astronomy&Astrophysics,524,A42.
[18] Johnson, A., Smith, J., & Williams, B. (2022). Automating the download and storage of Target Pixel Files for exoplanet research. Astrophysical Data Processing,20(2),87-102."
[19] Butler,R.P.,Tinney,C.G.,Marcy,G.W.,Jones,H.R.A., Penny,A. J., &Apps,K.(2006).ALong-PeriodJupiterMass Planet Orbiting HD 208487. The Astrophysical Journal,646(1),505-522.
[20] Gould,A.(2000).MicrolensingSurveysforExoplanets. TheAstrophysicalJournal,535(2),928-945.
[21] Charbonneau, D., Brown, T. M., Latham, D. W., & Mayor, M. (2000). Detection of Planetary Transits Across a Sun-like Star. The Astrophysical Journal, 529(1),L45-L48.
[22] Kipping, D. (2014). Transits and Occultations. In HandbookofExoplanets(pp.1-34).Springer,Cham.
[23] Fischer,D.A.,Howard,A.W.,Laughlin,G.,etal.(2014). Exoplanet characterizations by Kepler: The importanceofstellardata.ProceedingsoftheNational AcademyofSciences,111(35),12647-12652.
[24] Seager, S. (2010). Exoplanet habitability. Science, 340(6132),577-581.
[25] Traub, W. A., & Oppenheimer, B. R. (2010). Direct imagingofexoplanets.ReportsonProgressinPhysics, 73(2),024901.
[26] Seager, S., & Mallén-Ornelas, G. (2003). A unique solution of planet and star parameters from an extrasolarplanettransitlightcurve.TheAstrophysical Journal,585(2),1038-1055.