ANALYSIS OF G+6 STORY STEEL STRUCTURE UNDER BLASTING EFFECT
Parth S. Pandya, Aakash Suthar21 Student of Master of Engineering, Ahmedabad, Dept. of Structural Engineering, L.J. University, Gujarat, India
2Assitant professor, Ahmedabad, Dept. of Structural Engineering & Technology, Gujarat, India

Abstract: A detailed study of the progressive collapse analysis of multi-story buildings subjected to blast loading is now required due to the severe damage to property and life caused by recent terrorist attacks on the infrastructure. Research has typically been conducted using the Alternative Path Method (APM) with sudden column removal while neglecting the ideal site for blast loading. In this thesis, 3D models of a steel building with six stories and direct blast load modelling are suggested. Additionally, the impact of blast loading has been assessed at numerous sites. Two different types of explosive events vehicle-borne and package bomb have been taken into consideration. By employing a numerical model of the structure created with the "STAAD PRO" SOFTWARE, the blast load is analytically computed. By using a published example of a 7-story steel building that was subjected to blast load, the numerical model is validated. The collapse of steel buildings has been postulated as a possible outcome of the finite analysis, and proposals have been made to control it. By using a published example of a 7-story steel building that was subjectedtoblastload,thenumericalmodelisvalidated.
Keywords: Keywords:SteelStructure,Blast,STAADPRO, APM,Collapse,VehicleBomb,PackageBomb,G+6Storey.
Introduction
General
Although it is impossible to completely stop terrorist attacksonbuildings,itispossibletogreatlyreducetheir impact by taking preventative measures and using proactive strategies. It is essential to comprehend the structure, its intended use, and any concerns posed by terrorist attacks in order to identify the strategies most likely to be effective in reducing the negative effects of the attacks. When compared to the whole lifespan costs of the building (which also include the land estimation and security checking), the cost of renovating the building for a "particular level" of assurance against terrorist threats may not be very high. A bomb blast insideorarounda building canhavedisastrous impacts, harmingandcrushinginteriororoutsideportionsofthe building.
The type and layout of the building, the materials used, therangeoftheexplosivedevicethatwasfound,andthe charge weight all affect how much damage a bomb causes.
Case studies from various countries are examined, but they are by no means exhaustive because other explosionsmayoccurand buildingsub-frameworksmay sustainadditionalcollateraldamageinthefuture.
Explosion and Blast Phenomenon
An explosion frequently occurs when a significant amountofenergyisreleasedrapidlyinsidea smallarea. Explosions can be classified as physical, nuclear, or chemicaloccurrencesbasedontheirnature.
In physical event: -Energymaybereleasedintheevent of a catastrophic failure of a pressurised gas cylinder, a volcanic ejection, or even the mixing of two liquids at differenttemperatures.
In nuclear event:Byregeneratingprotonsandneutrons insidetheinneractingcoresofdifferentatoms,energyis releasedfromthedevelopmentofthosedistinctatoms.
In chemical event: The primary source of energy is the quick oxidation of carbon and hydrogen atoms, which makeupthefuel.
Accordingtopopularbelief,therearenumeroustypesof high explosives accessible, and because each explosive has unique detonation characteristics, each blast wave's qualities will vary. TNT is being utilised as the industry benchmark,withallvaluesrepresentedintermsofaTNT equivalentchargemass.
AsitmaybeconsideredasachargeintermsofTNTand depending on the weight, calculation can be done, analysis and design can be done for both physical and chemical explosions. In contrast, there is no suitable methodologyforanalysing nuclearexplosionssincethey emit abnormally high levels of atomic radiation when neutronsarepresent.
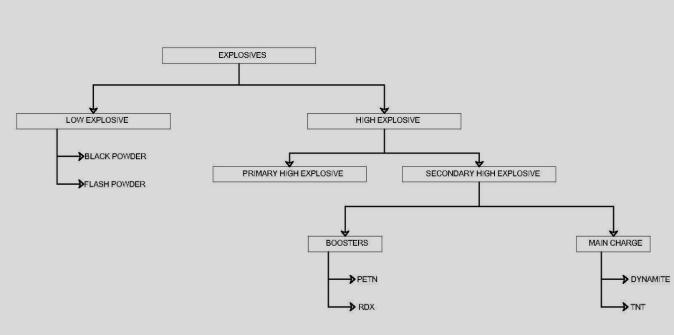
Fig 1.1 shows the different type of explosive. Explosive areclassifiedmainlyintotwoparts
Highexplosive
Lowexplosive
In general, low explosive is utilised in mining and fireworks, whereas high explosive is typically used in militaryweapons.
Primary and secondary explosives are subcategories of high explosive, whereas booster and main charges are subcategoriesofsecondaryexplosive
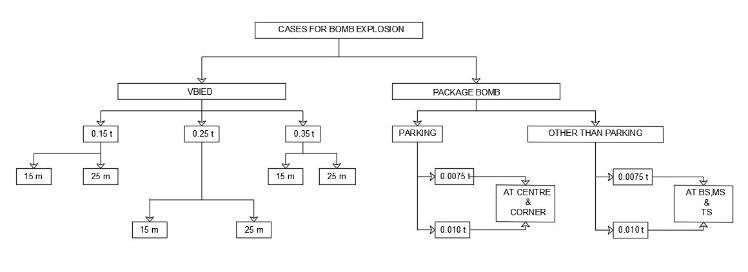
Selection of Ground Zero Distance
15metres
25metres
Figure 1. Type of explosive
Objective of Work
Toanalysehowamulti-storysteelbuildingresponds dynamicallytoexternalandinternalblastloads.
Investigatechainmechanismofprogressivecollapse ifoccurred.
Provide effective measures for reducing blast effect ofstructure.
Reliabilityanalysisofstructureagainstblastloads.
To provide effective protective measures to protect structureagainstblastloads

Selection of Frame
A 7-storey steel framed building is studied under the blast loading and for different cases as discussed in scopeofworks.
Selection of Blast Charge
0.15Tonne
0.25Tonne
0.35Tonne
Were,
BS=Basestorey
MS=Middlestorey
TS=Topstorey
Literature Review
Yang Ding, Xiaran Song, Hai tao zhu [1] [2017]: The purpose of this paper is to examine a study of the progressivecollapseofasteelframebuildingwithatenstoryseismicdesignthatwasattackedbyavehicle-borne explosive device. In this study, a two-step process is employed to assess the structure's propensity for collapse.
H.M. Elsanadedy, T.H. Almusallam, Y.R. Alharbi, Y.A. Al –salloum, H. Abbas [2] [2014]: Inordertodetermine the Riyadh building's vulnerability to blast loads, this articlewillanalysetheprogressivecollapseofasix-story steel frame structure. To simulate how buildings will behave under blast-generated waves, the FEA programme LS - DYNA was used. Based on the examination of a specific structural member that was subjectedtoblastload,anumericalmodelwasvalidated. Two types of structures one without a façade wall and theotherwithone areexploredinthisstudy.
Feng Fu [3] [2012]: This study uses a 20-story steel building with a blast load at column A1 on level 12 to study the blast effect. Comparative analysis is done between the output of ABAQUS, ATBLAST, and APM (alternative path technique from GSA guideline). The nonlinear dynamic analysis approach controls the response of the structure in the ABAQUS programme. According toGSA requirements, the loadiscalculatedas DL+0.25LL.Thestructure'sresponsewasdocumented.
Jenny Sideri, Chris Mullen, Simos Gerasimidis, George Deodatis [4] [2017]: Thepurposeofthisarticle is to investigate a detailed 3D nonlinear finite element dynamic analysis of a steel frame building in order to examine the response and damage to frame members alongthebuilding'sfaçadewhenconfrontinganexternal explosion. Three case studies of steel buildings with various structural systems are taken into consideration inthisresearch.
Yang Ding, Ye Chan, Yanchao Shi [5] [2016]: The purposeofthisarticleistoinvestigate thesteel building after a restricted explosion caused by a blast load. To determinetheinternalblastloadandanalysetheimpact of blast-related damage on the steel structure's fire defence, the software AUTODYN is used. With the use of LS-DYNA, the 10-storey NIST numerical model was developed.
ZHANG Xiuhua, DUAN Zhongdong, ZHANG Chunwei [6] [2008]: LS-DYNA was used to explore how steel frame structures gradually collapsed under the blast stress. The multi-material Langrangian and Euler algorithm was used. The propagation of blast pressure waves, structural dynamic response and deformation, and progressive collapse of a five-story steel frame structureinthecase ofan explosion closeto thesurface were all numerically simulated. For the purpose of creatingpressurethrough theexpansionofthechemical explosive's detonation product, the high explosive burningmaterialmodelandtheJonesWilkens-Lee(JWL) equationofstatesareused.
Tapan Sabuwala, Daniel Linzell, Theodor Krauthammer [7] [2005]: This research uses ABAQUS software to investigate the behaviour of fully restrained steel connections when subjected to blast stresses. By contrasting numerical results with experimental data from the AISC Programme, the Models were validated. Models were then tested to blast loads, and their effectiveness against blast loads was evaluated using TM5-1300.
Cameron B. Ritchie, Jeffrey A. Packer, Michael V. Seica [8] [2017]: For the first time, cold-formed steel rectangular hollow sections (RHS) in flexure have been subjected to extensive far-field air-blast testing. These arena tests demonstrated the exceptional ductility and performance of cold-formed tubular steel members under heavy blast loads without any cross-sectional fractures.
Two sizes of cold-formed RHS were tested: RHS120 × 120×5andRHS120×120×8.
UMESH JAMAKHANDI1, Dr. S. B. VANAKUDRE [9] [2015]: Thisstudy'sgoalsincludeprovidinginformation on blast resistant building design theories, improving

building security against explosive impacts during the architectural and structural design process, and recommended design methods. By doing a time history analysis in which the blast loading is applied, often utilising a triangle time function, blast analysis can be carriedoutinETABS2015.
Research Gap
It is clear from the literature analysis that no effort is done to investigate the effects of blasts on steel structuresinvariouslocations.Thepurposeofthisstudy istolookintoandofferpracticalsolutionsofpreventing structural damage caused by blast loading at various loadingsatonce.
Definition [10]
01.Blast Wind [10]
It is the moving air mass alongside the overpressures coming about the pressure contrast behind the shock wavefront.
02.Clearance Time [10]
It is the time in which the reflected pressure declines to the aggregates of the overpressure on the side and the dragpressure.
03.Decay Parameter [10]
It is the constant quantity of the -ve power of the exponent a governing the fall of pressure with time in pressurelinecurves.
04.Drag Force [10] force on a structure or structural elementduetotheblastload effect.
05.Ductility Ratio [10] ratio of the max deflection becauseofthedeflectionrelatingtoelasticlimit.
06.Dynamic Pressure [10]
It is the pressure effect of air mass movement called the blastwind.
07.Ground Zero [10]
It is the point on the earth surface vertically below the explosion.
08.Impulse [10]
Impulse per unit of anticipated region is the pressure time product given by the zone under the pressure time curve considered for the positive stage just unless specified.
09.Mach Number [10]
Itistheratioofthespeedoftheshockfrontpropagation to the speed of sound in standard atmosphere at sea level.

Blast Load Calculation [IS 4991:1968] [10]
InviewofthedeterminationstoIS4991:1968,blastload pressure on the building in type of a triangular load is ascertainedastakesafter:
Characteristic of Blast
ScaledDistance,X=D/�� /
Scaledtime,to =Actualtime/�� /
WhereD=Distanceofthebuildingfromgroundzero
W=Explosivechargeintonne
HereassumingPa =1.00kg/cm
Blast Parameters
For the estimation of scaled distance, different blast parametersarechosenfromthetable1ofIS4991:1968. Theseparametersare:
1. Pso=Peakside-onoverpressure(kg/cm2)
2. Po = the ambient atmospheric pressure =1kg/cm2
3. Pro=Peakreflectedoverpressure(kg/cm2)
Pro=Pso(2+ )
4. Qo=Dynamicpressure(kg/cm2)
5. Td = Duration of equivalent triangular pulse (Milliseconds)
6. To=Positivephaseduration(Milliseconds) Td= value corresponding to X/W (1/3) (Milliseconds)
To = value corresponding to X/W (1/3) (Milliseconds)
M=1+
Takea=344m/s;U=(M*a)m/milliseconds
Pressure on Building
Thenetpressurefollowsuponthefrontfaceatanytime t,thereflectedoverpressurePror (Po+Cdq),whicheverismorepredominant; Where,Cd=dragcoefficientgiveninfollowingtable Pr = the reflected overpressure which drops from the peak value Pro to overpressure (Po+ Cd*q) in clearance timetogivenby:
For H (height), B (width), L (length) of the building, calculateS=HorB/2(whicheverislesser)
Sr No Shapeofelement Drag coefficient Remark
Forclosedrectangularstructure

1 Front vertical face 1 For above ground structure
2 Roof, rear & side facefor
Qo=0to1.8kg /Cm²
Qo=1.8to3.5kg /Cm²
Qo=3.5to9.0kg /Cm²
3 Frontfacesloping
-0.4
-0.3
-0.2
4to1 0 For semi buried structure
1.5to1 0.4
Foropen,dragtypestructure
4 sphere 0.1 This cover steel tubes used as column, trussetc.
5 cylinder 1.2
6 Structuralshapes 2.0 This cover flats, angles, tees
7 Rectangular projection 1.3 Cover beam projection below or aboveslabs
Tc=3S/U(millisecond)>Td
Tt=L/U(millisecond)>Td
Tr=4S/U(millisecond)>Td
ConsidernopressureonbackfaceforTr>Td
Forroofandsides,finddragcoefficientfromtable2, Pressure on roof and sides=Pso+Cd*Qo (kg/cm2),
Time=Td(millisecond)
Pressure on front face = Pro (kg/cm2), Time = Td (millisecond) The pressure is taken in the form of a triangularload.
Blast Categories
Blastscanbecategorizedas:
1. ExternalBurst
2. InternalBurst
An internal blast will produce load in the form of shock or gas pressure due to the explosion's containment. Due to the outside blow, this pressure has a longer duration thantheshockpressure.
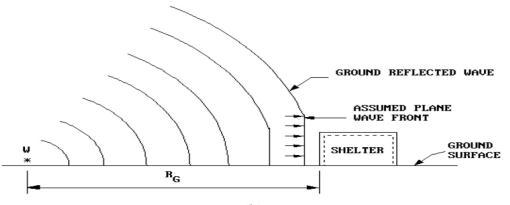
It needs to be highlighted that surface structure cannot bepredictedfromaninitialnuclearblast.
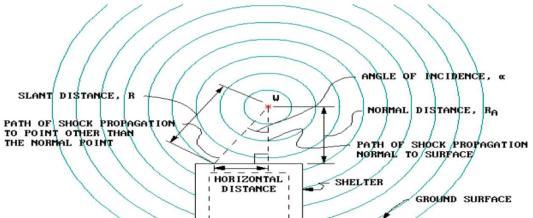
When an explosion occurs next to or above a defensive structure, the impact loads acting on the structure must be free air blast in order to prevent an increase of the initial shock wave between the explosive sourceand the defensivestructure.
Example of Common High Explosives
Based on the amount of energy released, explosives are classified as: low explosives and high explosive. Black powder is the most common example of the low explosive. Some of the common explosives are RDX (Royal Demolition Explosive), Dinitrotoluene, TNT (trinitrotoluene), Pentrinite, Pyroxilene, Dynamite, CompoundBetc.
The use of TNT is generally considered as a reference. The high explosive other than TNT is expressed as the equivalentmassofTNT.

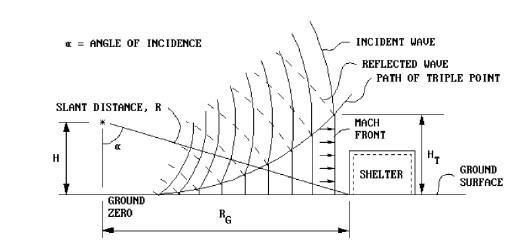
Inordertocausethefirstshockwavetoextendoutfrom theexplosionandencroachonthegroundsurfacebefore reaching the defensive structure, explosions that occur over the ground surface and at a distance from it create the air burst situation. This reflected wave is the consequence ofthestrengtheningoftheincidentwave bythegroundsurface.
For example, equivalent TNT mass of RDX is 1.185, for Dinitrotoluneitis0.70andforDynamiteitis1.30.Hence, 100 Kg RDX is converted to 1.185 x 100 = 118.5 kg of TNT.
Explosive and bombs are categorized as small, medium andhighorlargeas:
Smallexplosivedevices–upto10kgofTNT.
Mediumexplosivedevices–upto15kgTNT.
Largeexplosivedeviceandbombs–upto110kgofTNT.
Very large explosive devices and bombs - up to 2600 kg ofTNT.
Out of these, three cases -150 kg, 250 kg, 350kg will be studied for the blast pressure and its effects that it will createonthebuilding.
Estimation of Blast Load Imposed on Buildings
Surface bursts are charges that are located on or very closetotheground'ssurface.Contrarytoanairburst,the reflected wave converges with the incident wave at the site of blast to form a single wave that is about hemisphericalinshapebuthasasimilarcharactertothe airburst'sMachwave.
Withinafewmillisecondsoftheblastloading,achemical process that is exothermic takes place. The explosive substance is converted into a highly hot, dense, highpressure gas. The shock wave front is made up of the supersonic motion of this highly compressed air as it movesradiallyoutwardfromthesource.
Influence of Stand-Off Distance
The stand-off distance, an important factor, affects the degreeofbuildingdamage.Thegeometricdistributionof the energy in the practically hemispherical area surroundingtheblastthatisatorjustabove earth gives one the impression that the blast's intensity rapidly reduces as one walks away from it. It appears that less hardening is necessary to provide the necessary protectionbecausethedamageislikewiseproportionally decreased.

Blast Load Prediction
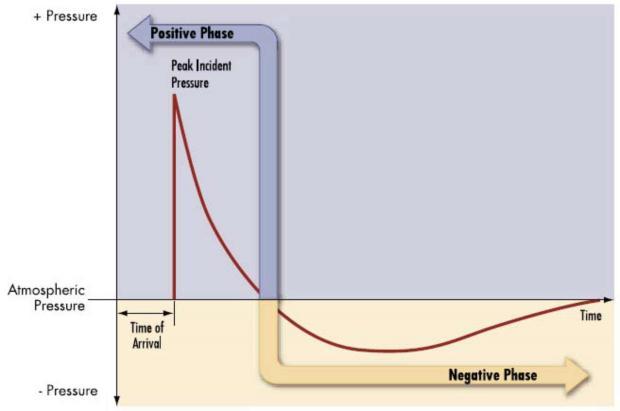
Themajorityofthetime,consultantsemploystreamlined approaches to forecast blast loads, particularly for the designofsingleandisolatedbuildings.Theoverpressure is supposed to reach its highest value immediately and then linearly decrement to zero over a period of time knownasthedurationtimeTd.
Mechanisms of Damage in Buildings
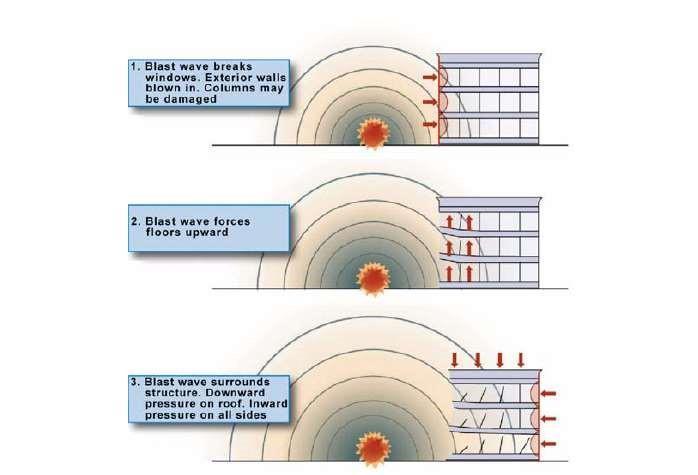
a) Local Damage: Individual non-structural and structural building components, such as exterior infill walls and windows, as well as floor systems (slab and girders),columns,andload-bearing/structuralwalls,are damaged when high-intensity air blasts are directed againstthebuilding'sexposedsurfaces.
(b) Global Damage due to Progressive collapse: Buildings may gradually collapse as a result of the failure of a singlestructuralmemberorasmallnumberofstructural elementsatalocallevel,creatingadominoeffect.
An internal explosion of a minor size might cause the followingharmtothestructure:
(a) localised damage and failure of adjacent RC and masonry walls as well as floor systems immediately belowandabovetheexplosion;
(b) Deterioration and failure of non-structural elements, such as window finishes, ducts, and partition walls;

Flying debris produced by electronics, furniture, and other things. Small internal explosions can cause severe damage, possibly resulting in progressive collapse, if they are directed directlyat a key load-bearing part like astructuralwall.
Internal
(A) Local Damage of Floor, (B) Uplift of Floor Above, And Failure of Walls Windows, and (C) Venting of Pressured Air Through the Various Levels of The Building
Selection of Steel Structure
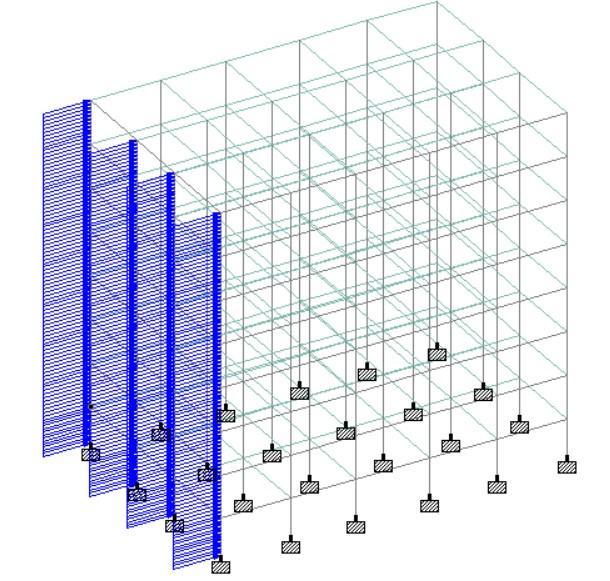
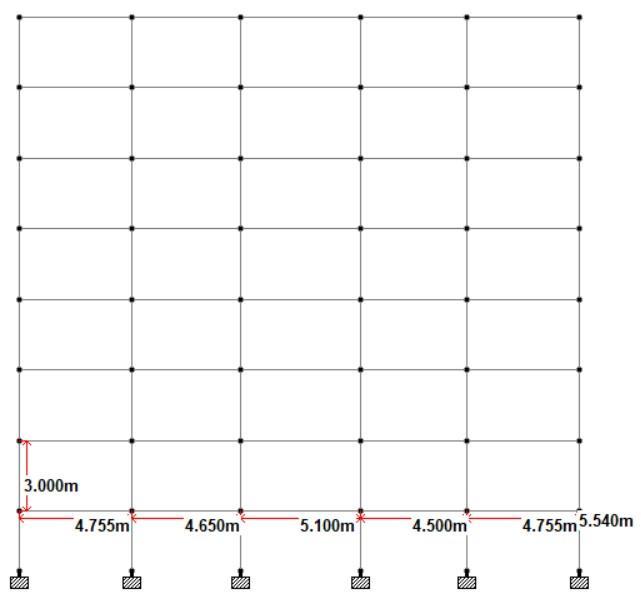
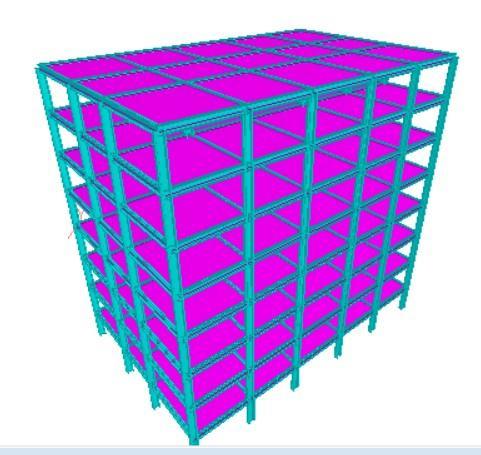
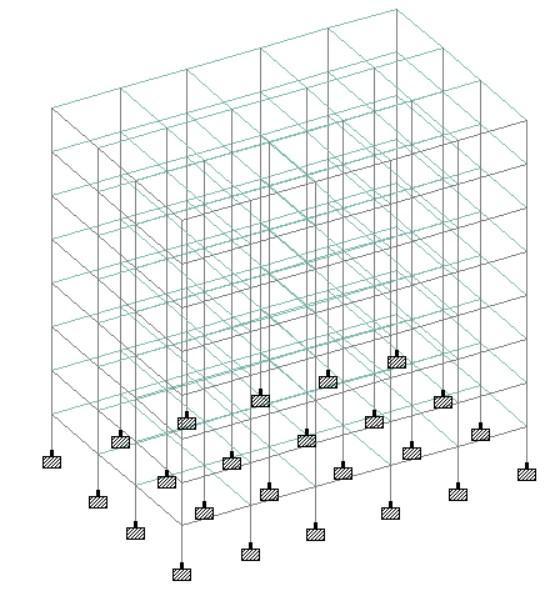

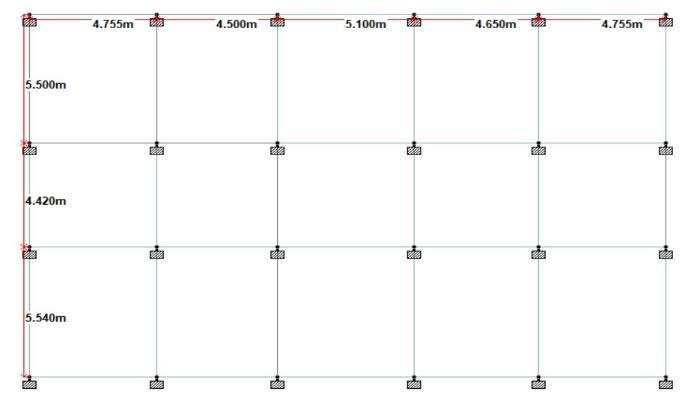
Forapresentwork,aG+6storeysteelstructurehasbeen selected.Toevaluatethedesignstress,anddisplacement inasteelstructure,ithasbeenanalysedkeepingitsbase as fixed and providing the pinned connection for secondary beam to main beam subjecting it to various combinations of Gravity and wind loads using software STAADPro.Fromtheanalysesresults,thecriticalvalues of stresses and displacement have been selected for design. The steel structure is designed using the Limit State Method & conforming to specification of IS: 800–2007andIS:875(part3)–2015.
Modal Specifications Section
Load Data

In the present structural model, the loads have been assignedunderthefollowingsixCategories:
1. DeadLoad(DL)
2. LiveLoad(LL)
3. WindLoad(WL)
4. WindloadinXdirection(WLX)
5. WindloadinYdirection(WLY)
6. Windin–veXdirection(-WLX)
7. Windin–veYdirection(-WLY)
Calculation of Blast Load
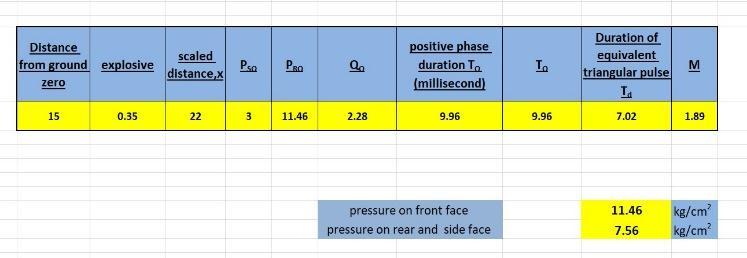
samplecalculationconsidersstandoff
distance(D): 15 m explosive charge weight (W): 0.35 tonne
Step 1 calculatethescaleddistance
X=D/W(1/3)
X=(15)/(0.35)(1/3)
X=21m
Step 2 find out peak side overpressure from IS 4991: 1998.
Step 3 find out peak reflected overpressure from IS 4991:1998.
Step 4 find out dynamic pressure (Q0) from IS 4991: 1998.
Step 5 find out positive phase duration (T0) from IS 4991:1998.
Step 6 find out duration of equivalent triangular pulse (Td)fromIS4991:1998.
Step 7 find out the match number (M) from IS 4991: 1998.
Application of internal blast load on steel structure
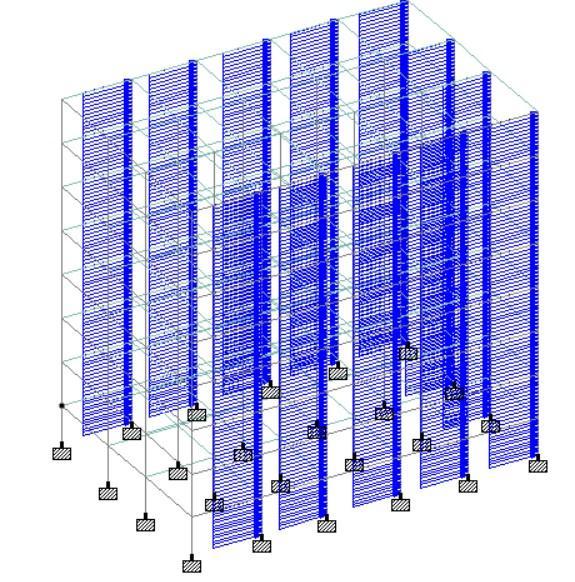
ThevariableApplyloadwhileapproaching.Thepressure calculatedinchapter3isusedtoapplytheexternalblast event. The internal blast event is calculated by the empirical equation given by Los Alamos Scientific Laboratory [11]
P = 13 (W/V)
where,W=chargeweightofexplosion(kg)
V=confinedvolumeofair(m3)
P=blastoverpressure(bar)
Samplecalculation
Considerchargeweight:7.5kg
Considerlengthofoneroom:5.1m
Considerwidthofoneroom:5.5m
Considerheightofoneroom:3m
Step 1 calculateoverpressureforinternalblast
Overpressure= 13 (W/V) =13*(15/(5.1*5.5*3) =115.86KN/m2

Result
Table1DisplacementDataforCombinationof0.15TAT 15MWITH0.0075TAsInternalBlast
Table3DisplacementDataforCombinationof0.15TAT 25MWITH0.0075TasInternalBlast
LOAD
Figure14DisplacementforValueofCombinationof 0.15TAT15MWITH0.0075TasInternalBlast
Table2DisplacementDataforCombinationof0.15TAT 15MWITH0.010TasInternalBlast
Figure16DisplacementforValueofCombinationof 0.15TAT25MWITH0.0075TasInternalBlast
Table4DisplacementDataforCombinationof0.15T AT25MWITH0.010TasInternalBlast LOAD
Figure15DisplacementforValueofCombinationOf 0.15TAT15MWITH0.010TAsInternalBlast
DisplacementforValueofCombinationof 0.15TAT25MWITH0.010TasInternalBlast

Table5DisplacementDataforCombinationof0.25T AT15MWITH0.0075TasInternalBlast
Table7DisplacementDataforCombinationOf0.25TAT 25MWITH0.0075TAsInternalBlast
Figure18DisplacementforValueofCombinationof 0.25TAT15MWITH0.0075TasInternalBlast
Table6DisplacementDataforCombinationof0.25T AT15MWITH0.010TasInternalBlast
Figure20DisplacementforValueofCombinationOf 0.25TAT25MWITH0.0075TAsInternalBlast
Table8Displacementdataforcombinationof0.25T AT25MWITH0.010Tasinternalblast
Figure19DisplacementforValueofCombinationof 0.25TAT15MWITH0.010TinternalBlast

Table9DisplacementDataforCombinationOf0.35TAT 15MWITH0.0075TAsInternalBlast
Table 11 Displacement Data for Combination Of 0.35T AT25MWITH0.0075TAsInternalBlast
LOADCOMBINATION DISPLACEMENT(MM)
0.35TAT25MWITH0.0075T
0.35TAT25MWITH0.0075T AT
0.35TAT25MWITH0.0075T AT
WITH
Figure24DisplacementforValueofCombinationOf 0.35TAT25MWITH0.0075TAsInternalBlast
Figure22
DisplacementforValueofCombinationOf 0.35TAT15MWITH0.0075TAsInternalBlast

Table10DisplacementDataforCombinationOf0.35T AT15MWITH0.010TAs InternalBlast
LOADCOMBINATION DISPLACEMENT(MM) 0.35TAT
Table12DisplacementDataforCombinationOf0.35TAT 25MWITH0.010TAsInternalBlast
LOADCOMBINATION DISPLACEMENT(MM)
0.35TAT25MWITH0.010TAT
AT25MWITH0.010TAT
Figure23DisplacementforValueofCombinationOf 0.35TAT15MWITH0.010TAsInternalBlast
Figure
forValueofCombinationOf 0.35TAT25MWITH0.010TAsInternalBlast
STRESS RESULTS
Table 13 Stress Data for Combination Of 0.15T AT 15M WITH0.0075TAsInternalBlast
Table15StressDataforCombinationOf0.15TAT25M WITH0.0075TAsInternalBlast
LOADCOMBINATION SRESS(N/MM²)
Figure26StressforValueofCombinationOf0.15TAT 15MWITH0.0075TAsInternalBlast
Table14StressDataforCombinationOf0.15TAT15M WITH0.010TAsInternalBlast
Figure28StressforValueofCombinationOf0.15T AT25MWITH0.0075TAsInternalBlast
Table16StressDataforCombinationOf0.15TAT25M WITH0.010TAsInternalBlast
SRESS(N/MM²)
Figure27StressforValueofCombinationOf0.15T AT15MWITH0.010TAsInternalBlast
Figure
StressforValueofCombinationOf0.15T AT25MWITH0.010TAsInternalBlast

Table17StressDataforCombinationOf0.25TAT15M WITH0.0075TAsInternalBlast
Table19StressDataforCombinationOf0.25TAT25M WITH0.0075TAsInternalBlast
Figure30StressforValueofCombinationOf0.25T AT15MWITH0.0075TAsInternalBlast
Table18StressDataforCombinationOf0.25TAT15M WITH0.010TAsInternalBlast
Figure
Table
forValueofCombinationOf0.25T AT25MWITH0.0075TAsInternalBlast
DataforCombinationOf0.25TAT25M WITH0.010TAsInternalBlast
0.25TAT 15MWITH0.010TAsInternalBlast

Table21StressDataforCombinationOf0.35TAT15M WITH0.0075TAsInternalBlast
Table
Stress
Figure34StressforValueofCombinationOf0.35TAT 15MWITH0.0075TAsInternalBlast
Table22StressDataforCombinationOf0.35TAT15M WITH0.010TAsInternalBlast
Figure35StressforValueofCombinationOf0.35T AT15MWITH0.010TAsInternalBlast
1. The results show that the system is considerably affected by changes in standoff distance and charge weight, respectively. However, the effectiveness of the chemical reaction cannot be predictably

determined from the actual charge weight of the explosiveemployedbytheterrorist.
2. In order to defend a structure and keep the bomb as far away as possible, the standoff distance must be maximised as it is the essential parameter that controlstheblastpressure.
3. Sincetheinternalblastimpactismorelikely tooccur in the top storey columns due to their reduced cross section features, the blast has a high amplitude characteristic. Therefore, all storeys should incorporatethesamecrosssectionalfeatures.
4. It was discovered in this investigation that the 25 m distance, which had the lowest displacement and stress values, indicated that the structure had very excellent lateral stability against blast load, as opposed to the explosion that happened at the 15 m distance, whichis alsologicallytrue. The costimpact is generally increase about 16.50 % for the highest chargeweight15m0.35tonnecase.
5. For the 15 m 0.35 tonne case with the maximum charge weight, the volume gain is approximately 29.13%.
6. Based on the findings, it can be said that the internal explosion event is not causing a structure to collapse becauseoftheirlightchargeweight.
7. The conclusion derived from the results is that the largest charge weight, 15 m, with a blast event weighing 0.35 tonnes on the exterior and 0.025 tonnesontheinterior,candeformthestructuremore thanthestandoffdistanceof25m.
References
[1] Yang Ding, Xiaran Song, Hai tao zhu,“Probabilisticprogressivecollapseanalysis of steel frame structure against blast loads”, Engineering Structure, 2017,147,679-691, http://dx.doi.org/10.1016/j.engstruct.2017.05. 063,ELSEVIER.
[2] H.M.Elsanadedy, T.H. Almusallam, Y.R. Alharbi, Y.A. Al –salloum, H.Abbas , “Progressive collapsepotentialofatypicalsteelbuildingdue toblastattacks”,JournalofconstructionalSteel Research,2014 ,101 ,143–157, http://dx.doi. org/10.1016/j.jcsr.2014.05.005,ELSEVIER.
[3] FengFu, “Dynamicresponse androbustness of tall building under blast loading”, Journal of Constructional Steel Research ,2013, 80, 299307, http://dx.doi.org/ 10.1016 /j.jcsr. 2012.10.001,ELSEVIER.

[4] Jenny Sideri,Chris Mullen,Simos Gerasimidis,George Deodatis, “Distributed column damage effect on progressive collapse vulnerability in steel building exposed to an externalblastevent”,JournalofPerformanceof ConstructedFacilities,06/10/17,©ASCE.
[5] Yang Ding, Ye Chan, Yanchao Shi, “Progressive collapse analysis of a steel frame subjected to confined explosion and post explosion fire”, Advances in Structural Engineering ,2016, 117,©SagePublicationsInc.
[6] ZHANG Xiuhua, DUAN Zhongdong, ZHANG Chunwei, “Numerical Simulation of Dynamic Response and Collapse for Steel Frame Structures Subjected to Blast Load”, Springer, 2008,14,523-529,©SPRINGER.
[7] Tapan Sabuwala, Daniel Linzell, Theodor Krauthammer, “Finite Element Analysis Of Steel Beam To Column Connections Subjected ToBlastLoads”,InternationalJournalofImpact Engineering ,2005 ,31 ,861-876, 10.1016/j.ijimpeng.2004.04.013,ELSEVIER.
[8] Cameron B. Ritchie, Jeffrey A. Packer, Michael V.Seica,andXiao-LingZhao,“BehaviorOfSteel Rectangular Hollow Sections Subject To Blast Loading”, Journal of Structural Engineering, 28/09/17,©ASCE.
[9] UMESH JAMAKHANDI1, Dr. S. B. VANAKUDRE, “Design And Analysis Of Blast Load On Structures”, International Research Journal of Engineering and Technology (IRJET) ,2015,02,2015, e-ISSN : 2395-0056 ,p-ISSN : 2395-0072.
[10] IS 4991 (1968): Criteria for blast resistance design of structures for explosions above ground[CED39:EarthquakeEngineering].
