AUGMENTING PRODUCTIVITY BY MINIMIZING SCRAP RATE USING INDUSTRIAL ENGINEERING TOOLS AND AUTOMATION
Abstract – This article describes the use of industrial Engineering techniques which improves productivity by minimizing scrap percentage. Implementing IE techniques (Automation, work-study, time study, layoutdesign,operation study) to eliminate human intervention in order to reduce the scrap percentage. This leads to process improvement which resulted in a reduction of waiting time and lead time thereby increase in productivity.
Key Words: Value stream mapping, Cause and effect diagram,3D-Scanner, Macro program, process chart,2^3 experiment.
1. INTRODUCTION
Productivity is a measure of economic performance thatcomparesthenumberofgoodsandservicesproduced byoutputswiththenumberofinputsusedtoproducethose goods and services Scrap rate evaluates the number of goods companies produce that become waste because of defects or errors during manufacturing. The average productivityofthecompanywasaround1.3to1.4lakhsand theaveragescraprateis29%.Powdermetallurgyisoneof thedevelopingmanufacturingtechniquesinwhichwecan manufacturefromsmall-sizeinsertstobig-sizediesandalso it is an easy method to produce complex shapes in which someoftheproductsdonotneedanysecondarymachining process to attain their shape and for some products secondarymachiningisrequired.Thetimeconsumptionin theinspectionwas more,theScrapratewas high(bothin GreenCarbideInspectionandGrinding).
1.1 Problem Identification
1. High scrap rate at the Sintering process due to manualcalculationintheGreenCarbideInspection areaandmoretimeconsumptionforproduction.
2. Inappropriate Measuring Instruments lead to inaccurate measurements due to component sensitivityandbrittlenature.
3. Inadequate monitoring and control in the grinding process(surfacegrinding)leadingtopoorqualityof thefinishedworkpieces
***
1.2 Literature Review

1. Accordingtotheneedsofthepurchasedepartment oftheABCCompany,theplanandformulaewere kept to be the same but the manual operations from the report were totally removed. As in apropos of VBA, literature was reviewed in the contextofautomationinMSExcel.
2. Yakubu Yisa, in a 2^3 factorial experiment is designedtoexaminetheinfluenceofsuchfactors asteachingmethod,gender,andlevelofstudyon students’academicperformance.
3. Mario COCCIA, the fishbone diagram can be a comprehensivetheoreticalframeworktorepresent andanalyzethesourcesofinnovation.
4. Usinganintrinsicfunctionofourinstitution’sEMR, vital signs and lab results from 20 individual hospitalizationswereexportedtoaspreadsheet.
2. Aims and Objectives
Aim:
To improve productivity by minimizing scrap rate using Industrial Engineering tools such as (Time study, process chart,simulation,fishbonediagram,DesignofExperiments, andstandardoperatingprocedure).
Objectives:
Avoiderrorsbyeliminatingmanualcalculationsand entriesonroutecards.
Toreducethewaitingtimeformachineoperatorsat greencarbideinspection.
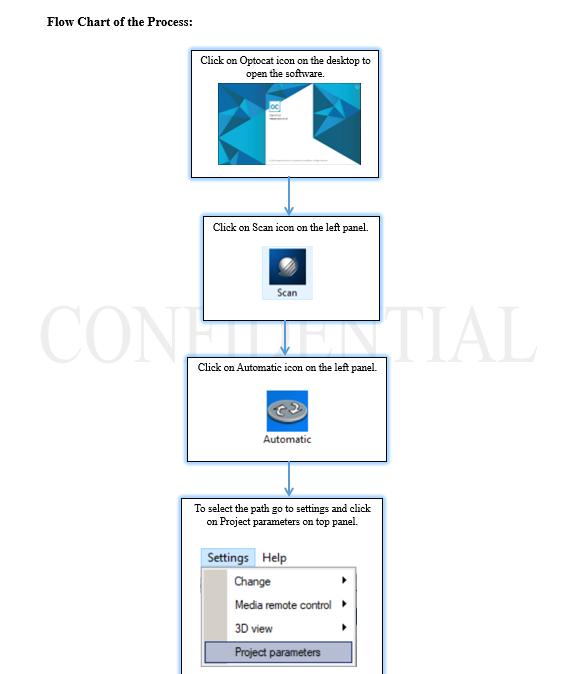
To obtain accurate measurements using a 3D scanner by providing the standard operation procedure.
To ensure the integrity of the component and to preventdamage.
To determine the relevant process variables that have the potential to impact the quality of the system

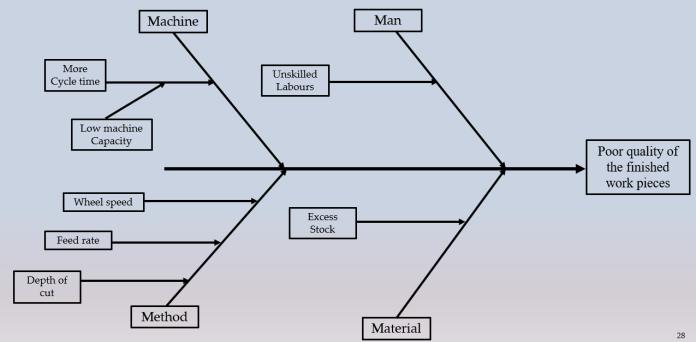


To Develop a structured and well-designed experimental plan that outlines the specific experimentstobeconducted.
Some
are:
Analyzing these data using graphs, simulation, process charts,andfishbonediagrams
5.1 Implementationofexcelbasedmacroprogram to eliminate manual entries. The macro program reduces the error due to manual entries.
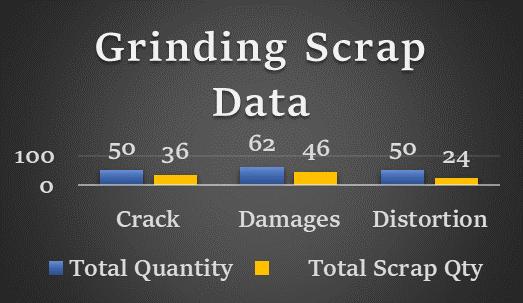
5.2 Creating a Standard operating procedure for 3D-Scannerwhichistobeimplementedinthe process where the brittle components are measured correctly and safely. It scans the components and measures the component’s measurementwithouthumanintervention.
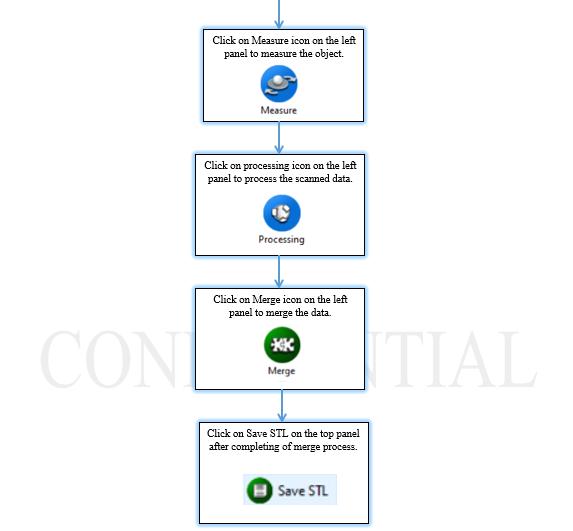


5.3 ImplementingtheDOE(23factorialdesign)for thefactorswheelspeed,depthofcut,andfeed rate. By designing an experiment, it will give whichcombinationoffactorswillprovidethe yield.Herethefactorsofwheelspeedincreased theyieldanddepthofcutincreased.Thefeed rateiskeptconstant.
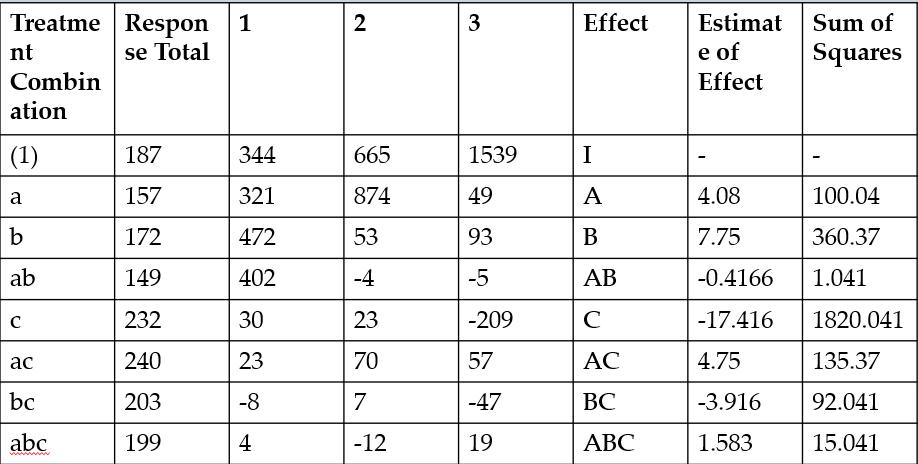
• From F-distribution table F(0.05,1,23) =4.28

Therefore, from the above table Feed rate (C) is significant
6. Results and discussion
6.1 Decreased scrap rate after implementation of macroprogram


OutofTotalGreenScrapobtained50%ofscrapis duetomanualCalculation.
Afterimplementingthemacroprogram,thescrap duetothemanualcalculationisreducedby35%
Aftertheimplementationofthemacroprogram,the waitingtimeinthesystemdecreased,andservice timealsodecreased.


6.2 Decreased scrap due to inefficient measurementsystemaftertheimplementation of3D-scannerintotheprocess
OutofTotalGreenScrapobtained30%ofscrapis duetoinefficientmeasurementsystems.
Afterimplementingthe3D-Scannerintheprocess thescrapduetoinefficientmeasurementsystemis reducedby15%
Fromthegraphitisobserved,thescrapisreduced by 57%i i.e., initially, it was 75% and present scrap%is18%

7. Conclusions
Theprojectwork wascompletedsuccessfullyand thechangesmadewereimplementedwiththeaidof IE tools such as Standard Operating procedure, Causeandeffectdiagram,processchart,simulation, and Design of Experiments they were able to minimize the scrap rate thereby increasing productivity.
The results wereshownfor theproduction of the monthofMay2023andtheresultsaretabulated.
ImplementationofanExcel-basedMacroprogram resultedinthe elimination ofmanual calculations andreducedscrapratefrom50%to15%.
Implementationof3D-scanningintheprocessesof GreenCarbideinspectionhasreducedthescraprate from30%to15%.
Implementation of DOE results, the scrap rate at grindingisdecreasedfrom25%to15%
Theproductivityhasbeenincreasedby50000pcs permonthbydecreasingthescrapby19%
REFERENCES
[1] Muhammad Ahmed Kalwar, “Automation of Order CostingAnalysisbyusingVisualBasicforApplications in Microsoft Excel”, Journal of Applied Research in technologyandEngineering,volume3(1),Jan31st,2022.
[2] Abidin I. Z, Juahir H, Azid A, Mustafa A. D, & Azaman, “Application of Excel-VBA for computation of water qualityindexandairpollutantindex”,MalaysianJournal ofAnalyticalSciences,19(5),ISSN1056–1064,(2015).
[3] Ahmadi A, Robinson P. H, Elizondo F & Chilibroste P, “Implementation of CTR dairy model using the visual basic for application language of Microsoft Excel”, InternationalJournalofAgriculturalandEnvironmental InformationSystems,9(3),74–86,(2018).
[4] YanQ&WanY,“UsingthespecialfontandVBAprogram to make a bill of materials in the transmission line engineering”,32(2),335–341,(2017).
[5] BelchiorJuniorA.,BruelR.N,AndradeD.A,Sabundjian, G,Macedo,L.A.,Angelo,G.,Torres,W.M.,Umbehaun,P. E.,&Conti,T.N,“Development ofa VBA Macro-Based Spreadsheet Application for Relap5 Data PostProcessing”,InternationalNuclearAtlanticConference, 978–985,(2011).
[6] MuhammadAliKhan,AutomationDataAnalysisusing Excel, Journal of Applied Research in Received: September 26, 2021; Accepted: December 17, 2021; Published:January31,2022
[7] G.Salawu,”Performanceoptimizationonwaitingtime using queuing theory in an advanced manufacturing environment”, south African Journal of Industrial Engineering,volume 31(4),pp9-18,December2020.
[8] Ran,l.,Xiaolei,”Asurveyonsimulationoptimizationfor the manufacturing system operation”, International JournalofModelingandSimulation,volume38,pp-116122,2017.

[9] Sushil G, “A survey on Queuing System with Mathematical Models and Applications”, American JournalofOperationalResearch,Volume7,NO.1,pp-114,2017.
[10] Andreas Felsberger “A Review of Decision Support SystemsforManufacturingSystems”,SamI40workshop ati-KNOW’16October18–19,2016,Graz,Austria
[11] Lessa D. J. R, Lessa F. P. R, Magalhães Junior P. A, & GuimarãesH.V,“MathematicalModelandProgramming in VBA Excel for Package Calculation”, International JournalofEngineeringResearchandApplications,6(5), 55-61,(2016).
