“Comparative Analysis of Blast Load on Multi Storey R.C.C. Building at Different Locations”
 Rajvee Patel1 , Aakash Suthar2
Abstract - The increase in terrorist acts in recent years has made it clear that the effects of blast load on the structurearean important factorto beconsidered during thedesignphase.Theprimarygoalofthisarticleistoshed lightonthecomparativeanalysisofthebuildingsubjectedto blastloadisdonebyusingEtabssoftware.Here32different loadcasesaretaken,inwhichforexternalloadwithspecial emphasisplacedondifferentstandoffdistancesofblastthat is20mand30mwithincorporationofvariousTNTcharge weights that is 50kgs, 100kgs, 200kgs and 300kgs in accordancewithIScode4991(1968).ForinternalloadTNT charge of 50kgs, 40kgs, 30kgs and 20kgs are applied on cornercolumnandcentralcolumnofthebuildingatvarious storeys.Responseofmodelswhensubjectedtoblastload,in termsofstoreydisplacement,storeydriftandstoreyshear areanalyzedusingTimehistoryanalysis.
Key Words: Blast Load, Standoff Distance, RCC structure, Etabs2020, Time History Analysis, Displacement, Drift, Storey Shear.
1.INTRODUCTION
Due to increase in the no. of accidental explosion and terrorist bombing on the important building like govt. buildingsandothercivilianfacilities,structuralprotection against explosive loads draws more and more attentions. Blast loads are extremely short in nature but have high intensity,thereforeanalysisanddesignofstructureforstatic and less dynamic loads like earthquake, wave and wind loads cannot be applied for structural design of blast resistant buildings. Also, the material behavior and structuralresponseunderblastloadareusuallynonlinear, time dependent and have complex stresses. Current approachesforblastresistantbuildingdesignsmainlybased onsingledegreeoffreedom(SDOF)simplification Fieldand laboratorytestsarenotsafeandeasytocarryout andare expensive, therefore various computer technology and softwaresuchasETABSareusedforgettingmorereliable and detailed numerical and structural responses. Various time-historyfunctionssuchasdisplacement,velocity,drift, accelerationiscomparedandanalyzedatvariousstoreys.
1.1 EXPLOSION & ITS TYPES
Therearethreekindsofexplosions:
• Unconfinedexplosions
• Confinedexplosions
• Explosionsoccurredwhenexplosivesareattached tothestructure
Unconfinedexplosionsareeitherairburstorsurfacebust.In anairburstexplosion,thehighexplosivedetonatesabove ground level, and intermediate ground reflection amplification of the wave occurs before the primary blast wavereachesa building.AfrontknownasaMachstemis created by the interaction of the initial wave and the reflected wave when the shock wave propagates outward along the ground surface. However, when the detonation takes place near or on the ground surface, an explosion knownasasurfaceburst.Whenanexplosionoccurswithina building,thepressuresassociatedwiththeinitialshockfront will be high and therefore will be amplified by their reflections within the building. This type of explosion is calledaconfinedexplosion.Ifadetonatingexplosivecomes intocontactwithastructuralelement,suchasacolumn,the arrivalofthedetonationwaveattheexplosive'ssurfacewill cause intense stress waves to form in the material, which willcausethematerialtobecrushed.
1.2 BLAST CHARACTERISTICS
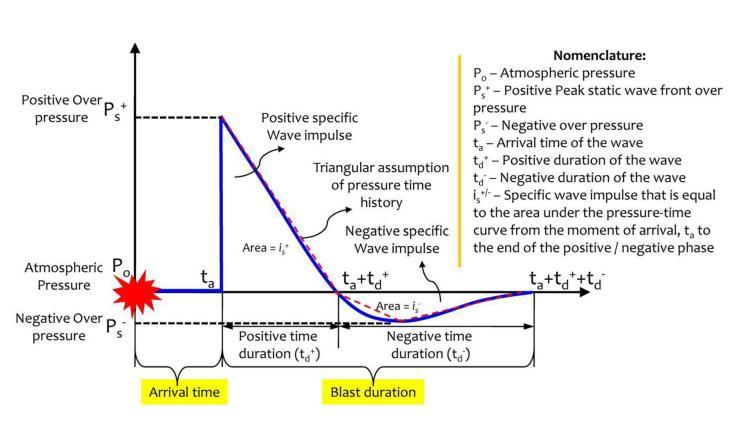
When an eruption takes place, an exothermic chemical reaction happens in a period of few milliseconds. The explosivematerial (in either continuousorliquid form) is converted to very intense, dense, high-pressure gas. This well compressed air, traveling radially outward from the

source at quick velocities is called the shockwave front. It expands at very extreme speeds and eventually reaches evenness with the encircling air. Usually, only about onetriennial of the chemical strength available in bombs is released in the explosion process. The remaining twotertiary energy is freed relatively moderately as the detonationoutputmixwithairandburn.Whilethisprocess ofblazinghaslittleeffectontheinitialblastwavebywayof its delayed incident than the original explosion, it can influencethelaterstagesoftheblastwave,particularlyin eruptions in limited spaces. As the sudden strong wave expands,pressuredecreasesrapidlyaccompanyingdistance bywayofsphericaldifferenceanddissipationofstrengthin warmingtheair.Also,pressuredecaysrapidlyoverperiod (as exponential function), usually in milliseconds. Thus, a blastcausesanalmostimmediateriseinairpressurefrom air pressure to a large overpressure. As the shock front expands,thepressuredropsbutenhancesnegativeasshown inFig.
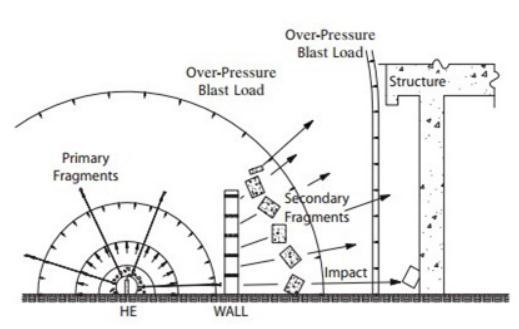
shreds, debris, and missiles. Depending on the object, the object's closeness to the explosion, and the explosion strength, these objects are thrown by the explosion with variedamountsofforce.
4. Debris damage
There are two sorts of fragments are primary and secondary. Primary fragments, which are hurled at high speedswhenanexplosionoccurs,areactuallypiecesofthe explosioncontainerwithamassofabout1gramme.
1.3 MAJOR EFFECTS OF EXPLOSION
1.
Itisthepressurecausedbyashockwaveoverandabove normal atmospheric pressure. The magnitude of overpressure blast wave is inversely proportional to the distanceofreceivingobjectfromthecenterofexplosion.
2.
Thermal effects
Ithappenswhenafireballoranaccumulationofhotgases isproduced.Ifabuilding'sfire-resistingsystemisdamaged byafireballimpactoranoverpressureimpactthatknocks offcolumnsorburnsthefirecoating,theintenseheatfrom the explosion may weaken structural members and contributetotheirfailure,potentiallycausingalocalizedor progressivecollapse.
3.
Energized projectiles
Energizedprojectiles,whichcanstrikebothpeopleand structuresandcausesevereimpactdamage,aremadeupof
explosion
Constrained or unrestrained objects, such as window shards,areexamplesofsecondaryobjectsthatareflungby the explosion. These items’ speeds, the distance between themandthetarget,theangleofincidence,andthephysical characteristics of the pieces and the target all affect the damagetheydo.
5. Cratering and ground shock.
It is determined by the location of the explosion. Even highlyresistantconstructionscanbedestroyedordamaged bygroundstress.Whenabomboccursjustnexttooronthe earth surface, a crater is created. The kind of soil and proximityoftheblastdeterminethesizeofthecrater.
2.LITERATURE REVIEW
Swathi Ratna K. [1] proposedAnalysisofRCCandSIMCON Building Subjected to Blast Effects This study shows that buildings made with SIMCON have a higher fundamental frequencythanthosemadeofRCC.Simconbuildingsexhibit better overall dynamic behavior than RCC buildings. The frequencyofSIMCONbuildingsreducesastheygettaller,but theyarestillhigherthanRCCbuildings.Buildingsmadeof RCC have more storey displacements than those made of SIMCON. When contrasted to the lowest levels, the top storeys have significant displacements. Structures' storey displacements rise as they get taller, however SIMCON structureshavelessdisplacementhere.Theexplosiveeffect on the building grows as standoff distance decreases. But compared to RCC buildings, SIMCON buildings experience significantlyfewerblastdamage.

Lina K. Kadhum [2] proposedArchitecturalandStructural DesignforBlastResistantTallBuildingsConcretefromView Point Different Weight TNT. This study shows that the reinforcedmultistoreybuildingisdesignedtwice,oncewith typical gravity building without shear walls and another withshearwalls.3modelsofdifferentchargeweights100 kgs,350kgsand750kgsaredesignedwithstandoffdistance 5m for analysis in terms of storey drift, displacement and storey shear. The 36-meter-tall structure was examined using ETABS2018. The structure was evaluated using Americanstandards.ItwasbuiltusingACI318-14andUS DepartmentofDefenseTM5-1300.Aboutdrift,wecansee theincreaseindriftwithbuildingwithoutshearwallmore than with shear wall. The maximum increase drift and displacement,itwasseenonthe11th and12th storeys.
P. Srikanth Reddy [3] proposed Blast Resistant Analysis andDesignTechniquesforR.C.C.MultistoreyBuildingUsing ETABS. This study presents architectural planning, blast resistanceanalysisanddesignofmulti-storeyRCCbuilding using ETABS software as per IS 4991-1968.The 21m tall buildingisdesignedforblastloadof100kgschargeweight withdifferentpointofsourcesanddisplacementandshear force is checked. This study on a G+7 residential building demonstrates that increasing the stiffness of structural membersbyincreasingtheirsizeyieldsbetterresultsand that doing so also helps to resist the uplift force on the footingsbyincreasingthedeadweights.Theblastresistant designaimstoimprovestructuralintegrityratherthanhave a building completely collapse. By providing moment resistingframeslikeshearwalls,effectsofblastloadcanbe reduced and structural integrity of the building can be increased.
Venkata Sudha Ambavaram [4] proposed Dynamic performanceofmulti-storeybuildingsundersurfaceblast: A case study. The investigation took into account four RC buildings of different heights and the identical design configuration.Thechosenbuildingsweremodeledusingthe industry-standardSAP2000softwareandplacedatstandoff distancesbetween10and50m,subjecttochargeweights between10and30kg.Theresultswereaddressedinterms of base shear, storey drifts, and maximum displacements. Additionally,analysiswasdonetoreducetheimpactofthe blast reaction utilizing reinforcing techniques, such as jacketingthecolumnsandaddingbracingsofvarioussizes. Maximumstoreydisplacements,inter-storeydrifts,andbase shearsallshowedsignificantvariationatR<30m,andmore variation was seen for low-rise buildings after 30 m. However, for high-rise buildings, the displacement responses were significantly different at a closer standoff distance (R=10 m), while they remained the same at a standoffdistancehigherthan10m.Forlow-risebuildings, the base shear was increased to 1.7–2.5 times with an increase in charge weight at R = 10 m. There was no noticeable differencein how the building responded to singleanddoublebracings.
Ayush Meena [6] proposed Impact of Blast Loading over reinforcedconcretewithoutinfillstructures.Purposeofthis research is to investigate the effect of blast load on the structure. G+3 RCC framed structure is designed in ETAB software. Four models are considered with stand-off distance30mand60mwithblastyieldof150kgTNTand 300 kg TNT. Variation of storey displacement and storey driftarerecorded.Whenstandoffdistanceischangedfrom 30mto60m,Maximumstoreydisplacementisreducedby 67%andstoreydriftisreducedby66.7%.Also,whenBlast yield is reduced to 150 kg from 300 kg, maximum storey displacementisreducedby33%andstoreydriftisreduced by31%. Withoutinfill walls,herebeamsandcolumnsare increasedbychanging3baysof4mto4baysof3m.With keeping the standoff distance, maximum storey displacementisreducedbyaround40%andstoreydriftis reduced by 38%. Again, without infill walls, beams and columnsareincreasedbychanging4baysof3mto6baysof 2m. With keeping the standoff distance, maximum storey displacementisreducedbyaround74%andstoreydriftis reducedby72%.
2.1 OBJECTIVES OF STUDY
To study dynamic response and properties of the structureagainstblastloading.
Enhancement of safety of important structure by reducingblasteffects.

Tounderstandtheeffectsofblastonstructureand blastprogression.
Forstudyingstructuralresponsewhensubjectedto blast load using ETABS software as per IS Code 4991.
Toknowstructuralresponsewithdifferentstandoff distances and various charge weights when blast loadisapplied.
3. MODELLING & ANALYSIS
Inthisstudyanattempthasbeenmadetodocomparative analysis of RCC building under the blast load at different locationinthebuilding.TheblastloadisappliedontheRCC structure as an overpressure under the influence of time. Selection of G + 5 storey RCC structurehas been selected. CalculationofGravityloadsasperspecificationsofIS:8002007 as well as blast loading as per IS:4991-1968 and applying on the building. External load is applied on the frontandsidefacesofthebuildingintheformofUDLand internalloadisappliedontheparticularcolumnintheform ofPointload.Afterapplicationofload,blastanalysisofthe building is performed by the time history function as a triangular load. For studying dynamic response of the structureNon-linearmodalanalysisisdonewithtimestep sizeof0.1swith4000timestepsonallmodelsandresults
are interpreted, analyzing the critical value of the Displacement,DriftandStoreyShearfordesignpurpose.

3.1 Preliminary Data
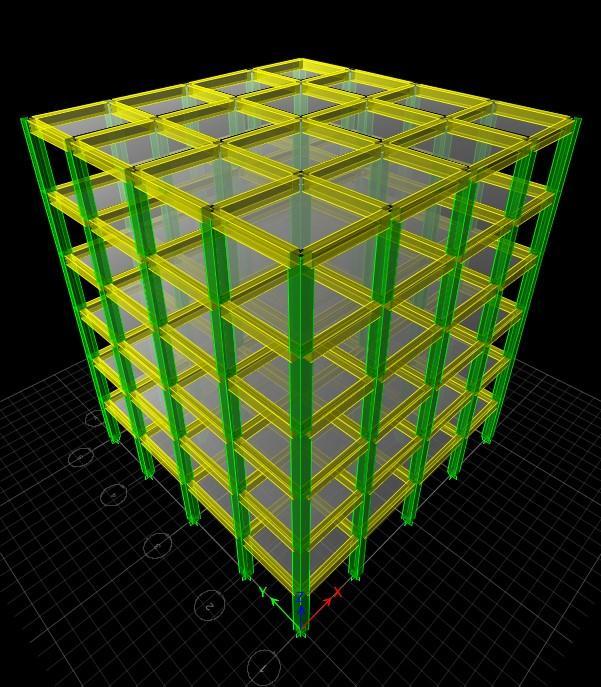
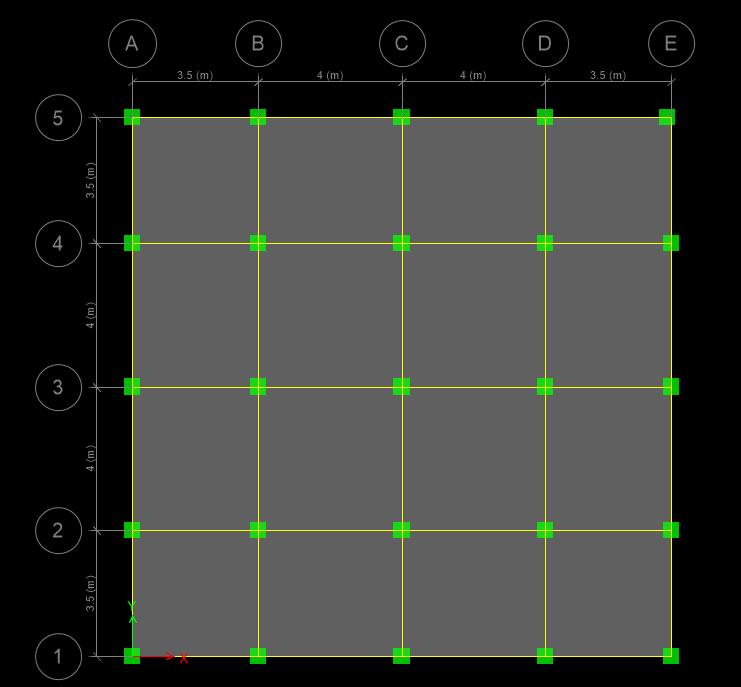
Calculationfor External Blast Load:
Calculation of blast pressure and the time duration of the blastexplosionasperspecificationofIS:4991-1968.
ScaledDistance,X=D/�1/3
Scaledtime,to=Actualtime/�1/3
WhereD=Distanceofthebuildingfromgroundzero
W=Explosivechargeintonne
Blast Parameters
Pso =Peakside-onoverpressure(kg/cm2)
Po =theambientatmospheric pressure=1kg/cm2
Pro =Peakreflectedoverpressure(kg/cm2)
Qo =DynamicPressure(kg/cm2)\
Td =Durationofequivalenttriangularpulse(milliseconds)
To =Positivephaseduration(milliseconds)
M =Machno.oftheincidentpulse
U =Shockfrontvelocity=M*a
Pressure on Building
S=HorB/2….whicheverisless
Reflectedoverpressure,Pr=(pso+cdxqo)
Where,Cd=dragcoefficient
Clearancetime,Tc=3S/U>Td
Transittime,Tt=L/U>Td
Pressurerisetime,Tr=4S/U>Td
IfTr>Td,thenbackpressureisnotconsidered

Calculationfor Internal Blast Load:
Here the internal blast in the building is calculated by empirical equation given by Los Alamos Scientific Laboratory and excel sheet is prepared for calculation of blastoverpressure,
P = 13(W/V)
Where, P=BlastOverpressure(KN/M2)
W=ExplosionChargeweightinkg
V=Confinedvolumeofair(m3)
3.3 LOAD CASES
1 0.05tTNTat20m
0.05t BLAST LOAD ON BUILDING AT 20M STANDOFF DISTANCE
0.2t BLAST LOAD ON BUILDING AT 20M STANDOFF
Table-3: 0.05tBlastLoadat20mStandoffDistance
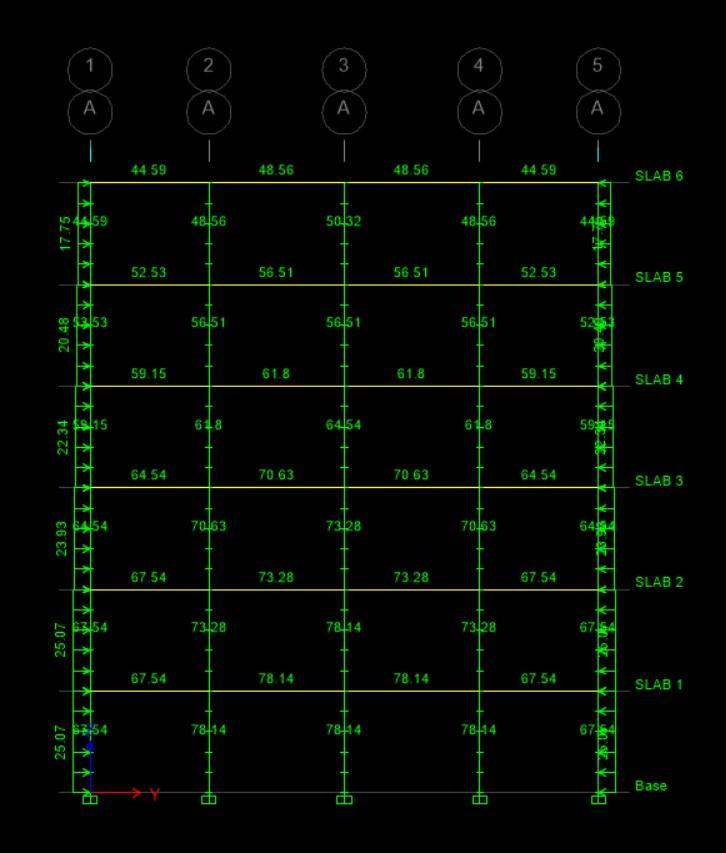
BlastLoadat20mStandoffDistance

0.3t BLAST LOAD ON BUILDING AT 20M STANDOFF DISTANCE Slab
0.1t BLAST LOAD ON BUILDING AT 30M
Table-6: 0.3tBlastLoadat20mStandoffDistance
0.05t BLAST LOAD ON BUILDING AT 30M STANDOFF DISTANCE
0.1tBlastLoadat30mStandoffDistance
0.2t BLAST LOAD ON BUILDING AT 30M STANDOFF
Table-7: 0.05tBlastLoadat30mStandoffDistance
Table-9: 0.2tBlastLoadat30mStandoffDistance

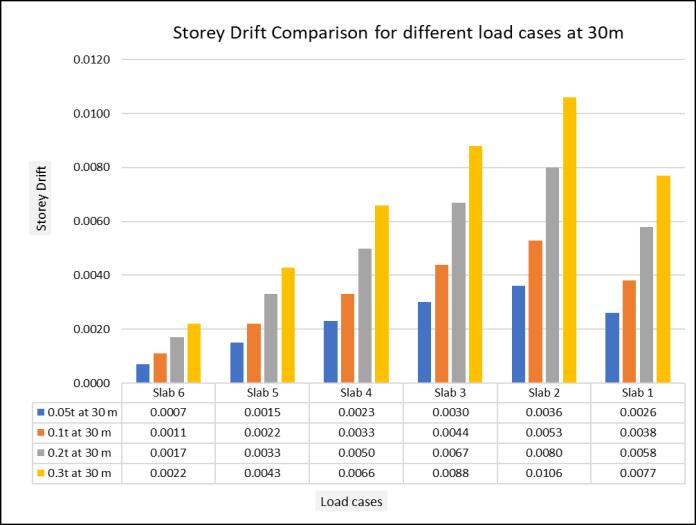
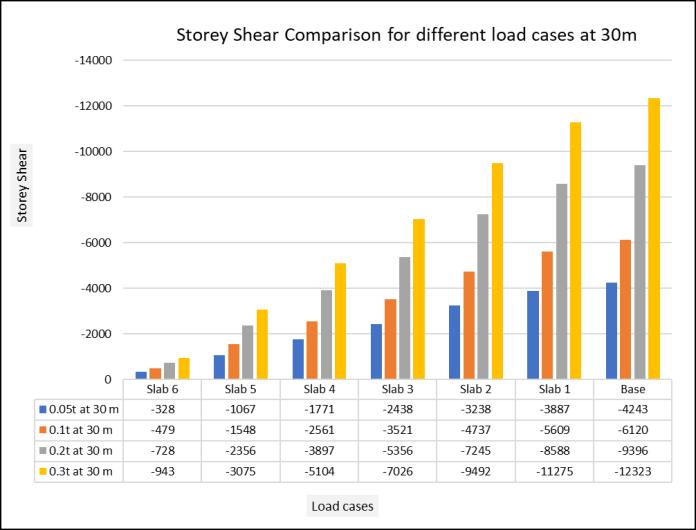
0.3t BLAST LOAD ON BUILDING AT 30M STANDOFF DISTANCE




5. CONCLUSION
Standoff distance and charge weight are main criteria for analysisofanyblastresistancebuilding.
Magnitudeandlateralstabilityofthestructureincreasewith increaseinstandoffdistance.
Itisnotfullyreliableorpredictableforanyanalysisofblast explosion, as charge weight and its chemical reaction are differentfordifferentcases.
PeakoverpressurePro,increaseswithincreaseinstandoff distance.
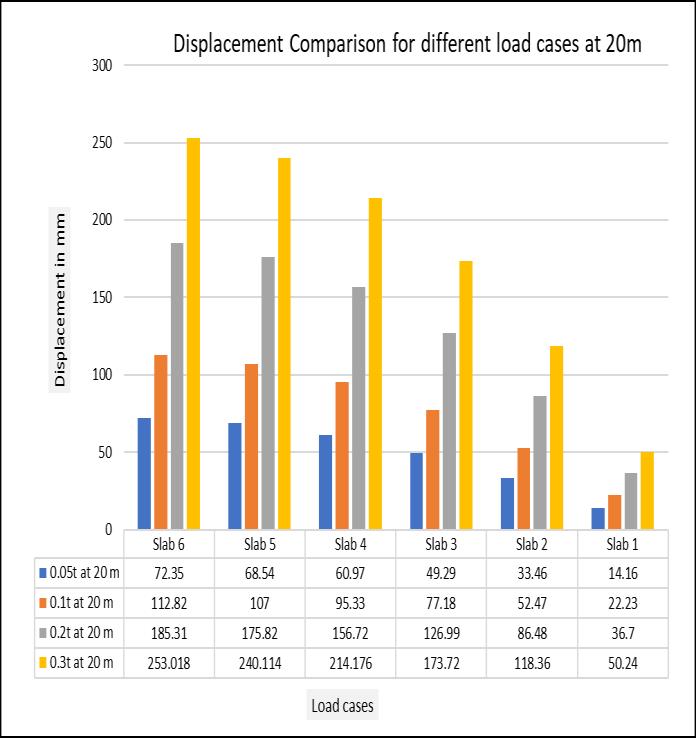
Nodal or joint displacement decreases with increase in standoffdistance.
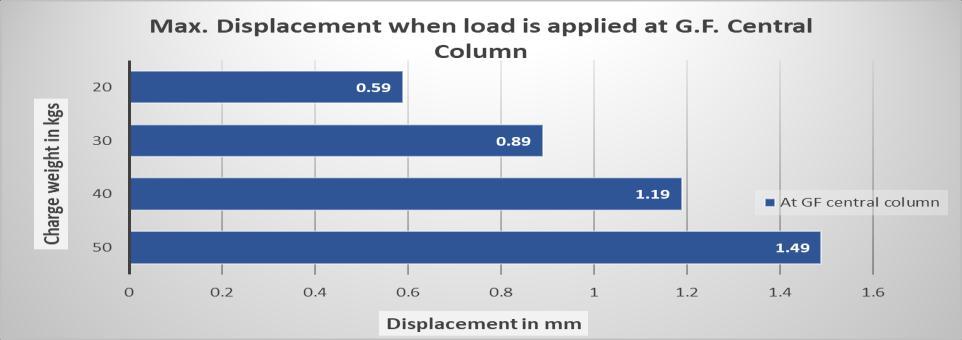
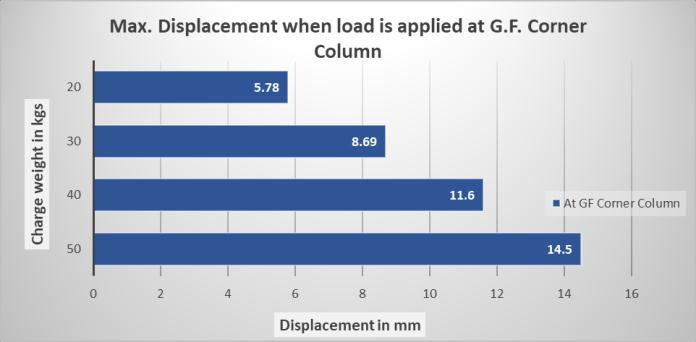
Asthechargeweightofblastincreases,max.displacement andaccelerationalsoincrease.
Topstoreyexperiencesmorestoreydisplacementanddrift thanbasestoreywheninternalblastloadisapplied.
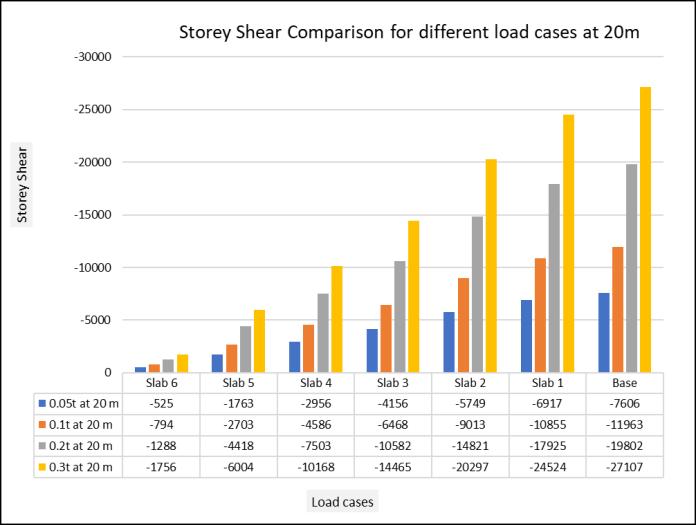
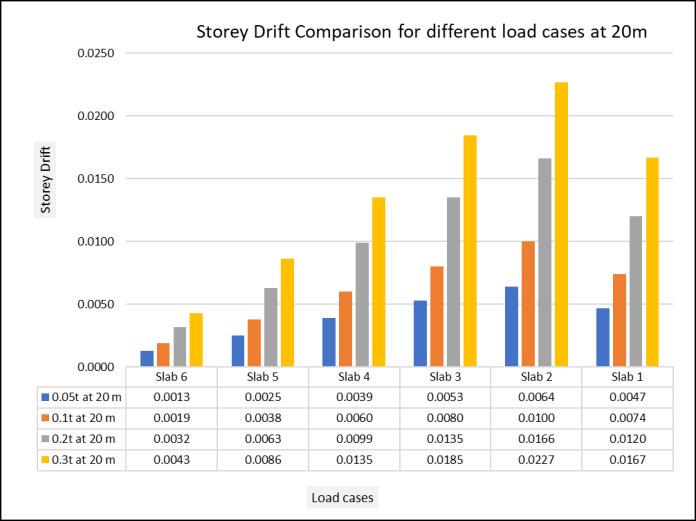
In this study for external blast load analysis, max. displacement,driftandstoreyshearareobservedfor300kgs chargeweightwithastandoffdistanceof20m.
Forexternalblastload,max.storeydriftisobservedonthe 1st floorofthebuildingthatisonSlab2.
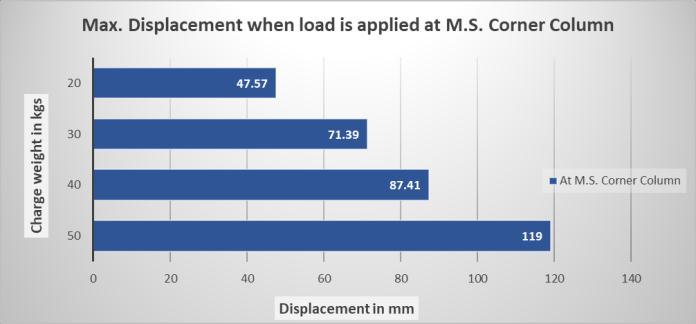
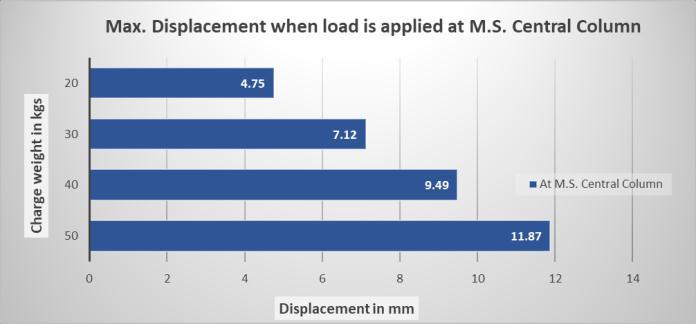
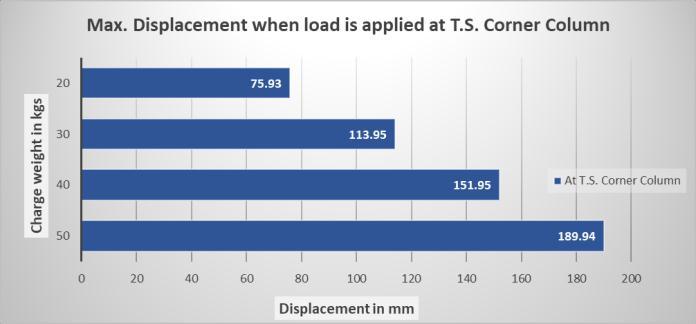
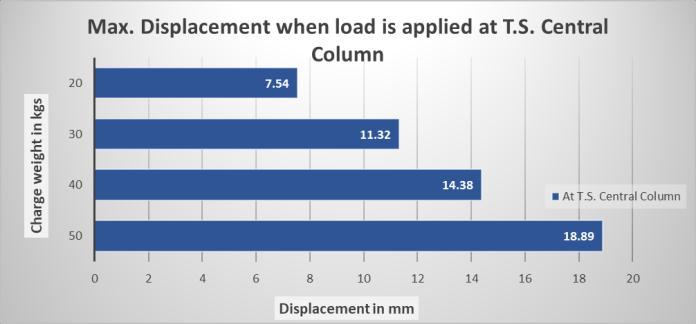
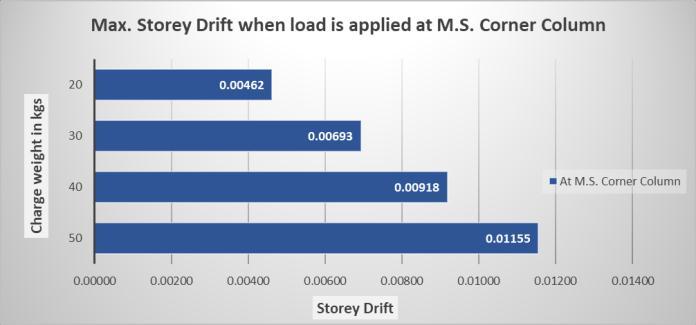
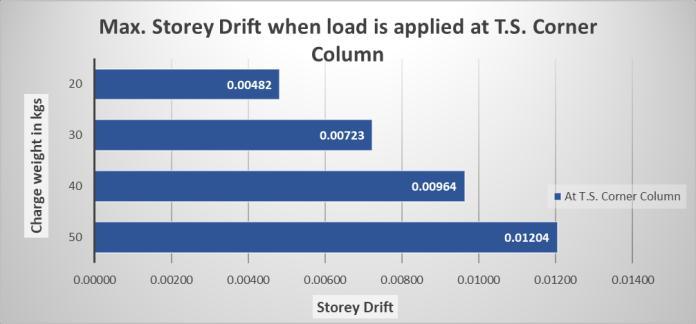
Forinternalblastload,maximumdisplacementandstorey driftisobservedfortheloadcaseof50kgblastloadontop storeycornercolumn

6. REFERENCES
1. 1. BLAST, B. S. T. (2016). Analysis of RCC and SIMCON buildings subjected to blast effects. Technology, 7(4),223-233.
2. Kadhum, L. K., & Kadhum, A. K. ARCHITECTURAL ANDSTRUCTURALDESIGNFORBLASTRESISTANT TALL BUILDINGS CONCRETE FROM VIEW POINT DIFFERENTWIGHTTNT.
3. Reddy,P.S.,Prasad,C.S.R.,Rao,S.K.,&Reddy,Y.V. S. (2018). Blast resistant analysis and design techniques for RCC multistorey building using ETABS. Technology, 9(1),908-917.
4. Ambavaram,V.S.,Muddarangappagari,A.,Mekala, A., & Chenna, R. (2021). Dynamic performance of multi-storey buildings under surface blast: a case study. Innovativeinfrastructuresolutions, 6,1-20.
5. Goel, M. D., Agrawal, D., & Choubey, A. (2017). Collapse Behavior of RCC Building under Blast Load. Procediaengineering, 173,1943-1950.
6. Meena, A., Jethoo, A. S., & Ramana, P. V. (2021). Impact of blast loading over reinforced concrete without infill structure. Materials Today: Proceedings, 46,8783-8789.

7. Goel,M.D.,&Matsagar,V.A.(2014).Blast-resistant design of structures. Practice Periodical on Structural Design and Construction, 19(2), 04014007.
8. IS:4991-1968
9. IS:875-1987
