
STRESS ANALYSIS & OPTIMIZATION OF A LOWER CONTROL ARM OF SUSPENSION SYSTEM BY USING OPTISTRUCT
Ranshing Aishwarya Sanjeev1 , Amol B Gaikwad2 , Kharad B.N.31Sholar,Dept of Mechanical Engg, Vishwabharti Academy’s College of Engineering, Ahmednagar, Maharashtra, India
2Asst. Prof. Dept of Mechanical Engg, Dr D.Y.Patil School of Engineering, Pune, Maharashtra, India

3Asst. Prof. Dept of Mechanical Engg, Vishwabharti Academy’s College of Engineering, Ahmednagar, Maharashtra, India ***
Abstract:
The lower control arm is a critical component in the suspension system of an automobile, responsible for supporting the weight of the vehicle and maintaining stability during various driving conditions. This abstract presents a systematic approach towards the optimization of the lower control arm design, aiming to enhance its performanceandreliabilitywhileconsideringfactorssuch as weight reduction, material selection, and structural integrity. The optimization process begins with a comprehensive review of existing lower control arm designs, identifying their strengths and limitations. Next, various design parameters are identified and evaluated, including geometric dimensions, material properties, and attachment points. Utilizing advanced computer-aided design (CAD) software and simulation tools, a virtual model of the lower control arm is created to assess its structuralbehaviorunderdifferentloadingscenarios.
1. INTRODUCTION
1.1 Suspension System
Suspension refers to the collection of springs, shock absorbers, and linkages that establish a connection betweenavehicleanditswheels,enablingrelativemotion between the two. It serves a dual function by enhancing the vehicle's road holding, handling, and braking performance for improved active safety and driving enjoyment, while also providing a comfortable and isolated environment for occupants, reducing road noise, bumps, and vibrations. Achieving these objectives often requires striking a balance, as they can conflict with each other. Therefore, optimizing suspension systems involves finding the appropriate compromise that meets the desiredoutcomes.
1.2 Lower Control Arm
The lower control arm is an essential component of the MacPherson suspension system commonly found in vehicles. In most front suspensions, two control arms, often referred to as lower control arms, are present.
However,certainvehiclesliketheHondaAccordandmany truckshavefourcontrolarms,consistingoftwoupperand two lower arms. These control arms serve the purpose of connecting the car's frame or body to the assembly that holds the front wheel, known as the steering knuckle. To enable flexibility, the control arms are attached to the frame or body of the car using rubber bushings called controlarmbushings.
The unsprung weight of a wheel plays a crucial role in strikinga balancebetweenitsabilitytofollowbumpsand isolate vibrations. If a wheel is heavier and moves less, it will not absorb vibrations effectively, resulting in the transferofroadsurfaceirregularitiestothecabinthrough thesuspensiongeometry.Asaresult,ridequalityandroad noise are adversely affected. Additionally, when the wheels encounter longer bumps, a higher unsprung mass leads to increased energy absorption by the wheels, furtherdeterioratingtherideexperience.
Furthermore,excessiveunsprungweightposeschallenges inwheel control duringintenseaccelerationorbraking. It
can cause wheel hop, negatively impacting traction and steeringcontrol.
1.4 Objective
Perform static structural analysis of the existing lower control arm model using ANSYS Workbench, a finite element analysis (FEA) software.
Conduct topological optimization of the lower control arm using the OPTISTRUCT solver. This optimization process aims to improve the design by considering factors such as weight reduction andmaterialcost.
Optimizethelowercontrol armdesigntoachieve a weight reduction of up to 15 to 20% while maintaining the required factor of safety. Additionally, propose alternative designs that meetthepermissiblelimitsofsafety.
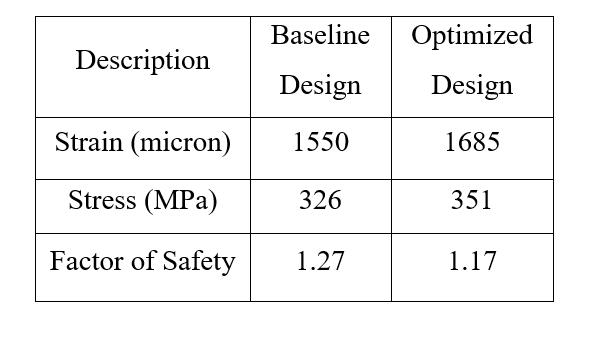
Compare the factor of safety between the optimized design and the baseline design of the lowercontrolarm.
Validate the results obtained from the FEA analysis by conducting experimental tests and ensuringtheirconsistencyandaccuracy.
1.5 Conclusion from Literature Review:
Based on previous studies, it is evident that while there have been numerous works conducted on Wishbone and MacPherson suspension systems, the majority of them have focused on improving efficiency and performance. It is also worth noting that the literature primarily consists of analytical studies employing finite element analysis to examine various suspension components. However, there has been limited research exploring the weight optimizationspecificallyofthelowercontrolarm.
2. THEORETICAL ANALYSIS
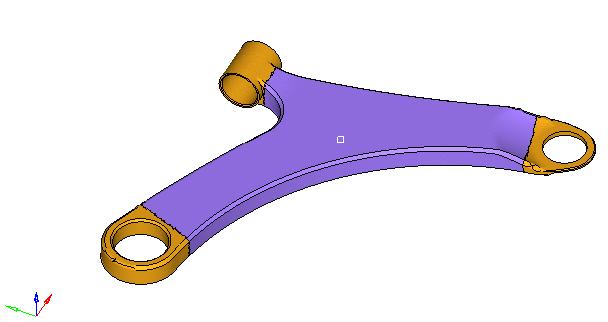
2.1 Dimension of Lower Control arm
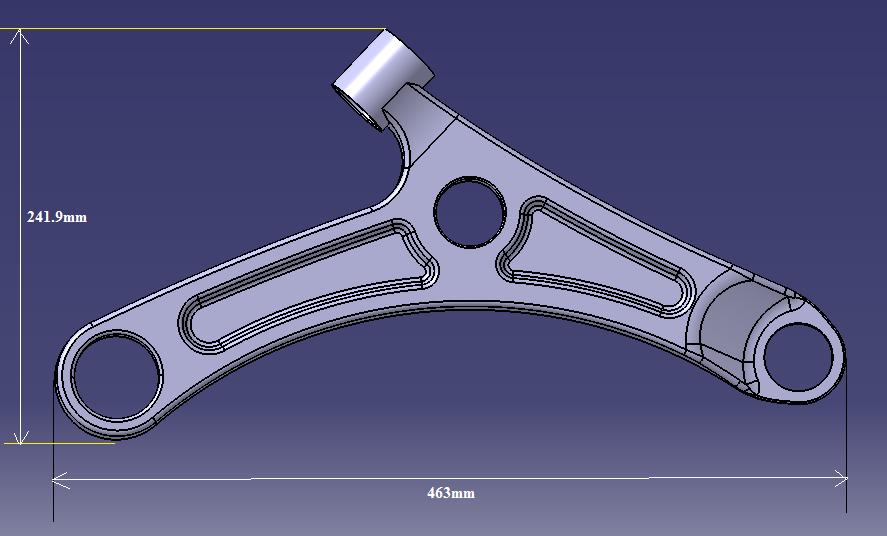
Thedesigndatasheetofthelowercontrolarmisprovided in the appendix. The dimensions of the existing lower controlarm,sourcedfromaWagonRcar,arepresentedin Figure2.1.Thelowercontrol armhasanoverall length of 463mm,awidthof241.9mm,andathicknessof3mm.
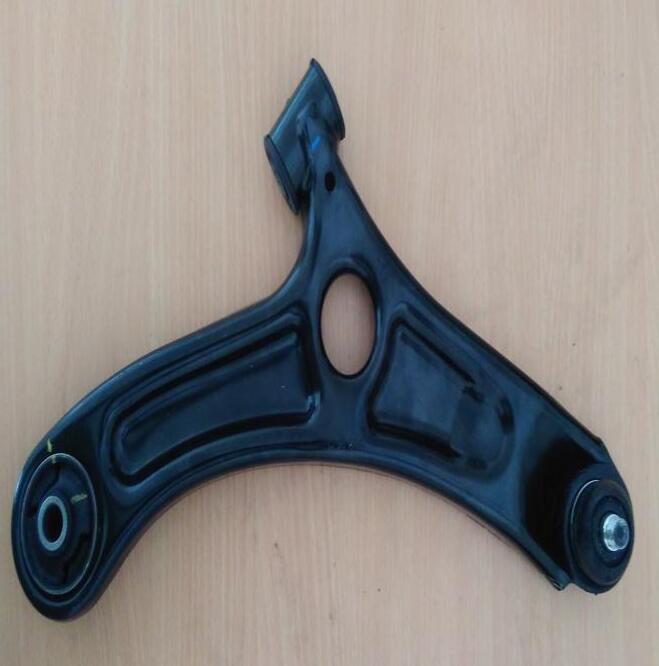
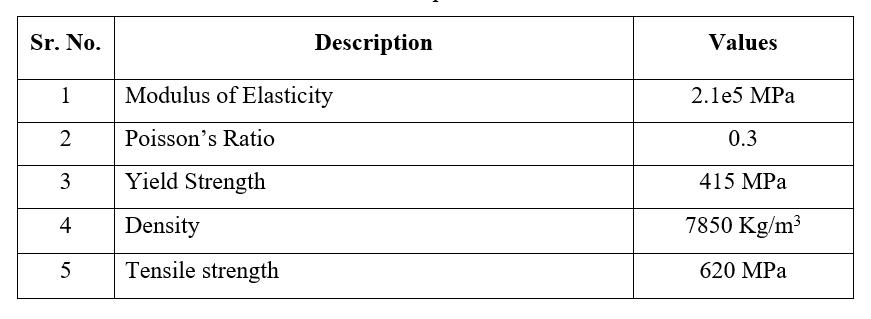
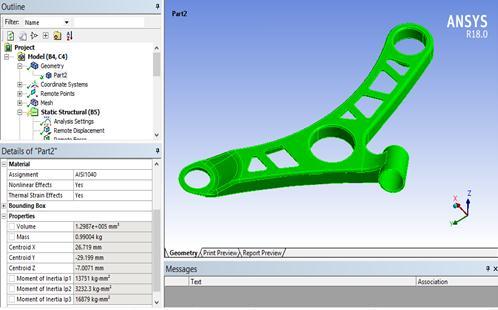
2.2 Material properties
Lower control arms are subjected to significant load carrying requirements, necessitating a material with high strength and durability. The existing component utilizes AISI 1040 material, which is a type of steel. Steel is a suitable material choice due to its desirable properties suchasahighyieldpoint,elasticity,andbucklingstrength, among others [6]. These characteristics make steel an ideal material for meeting the demanding mechanical requirementsoflowercontrolarms.
3. FINITE ELEMENT ANALYSIS
Thefiniteelementmethod(FEM)isanumericaltechnique employed to approximate solutions for boundary value problems associated with partial differential equations. It is commonly known as finite element analysis (FEA) and involves dividing a complex problem into smaller, more manageablepartsknownasfiniteelements.
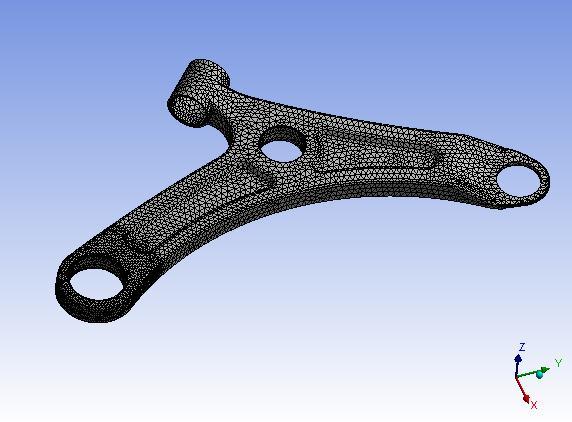
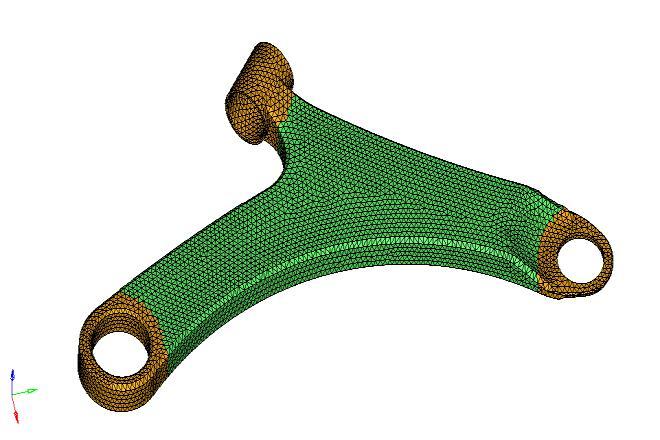
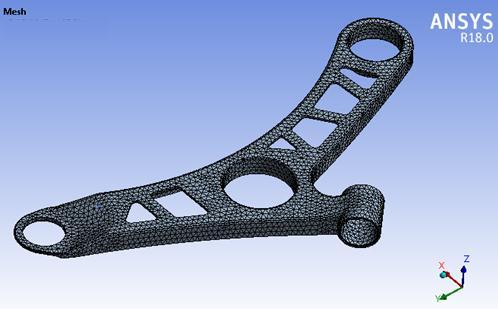
In the case of the control arm, it is necessary to mesh the conventional model developed in modeling software for analysis purposes. The control arm is meshed using tetrahedral elements, ensuring that the model is properly divided for analysis. The mesh model, as depicted in Figure 3.1, employs solid tetrahedral elements for the controlarm.
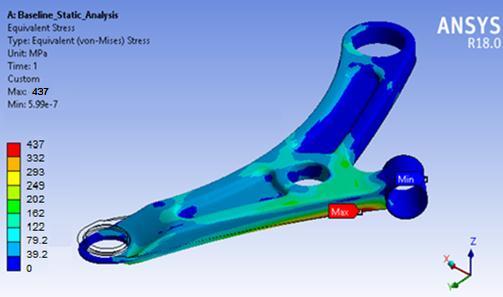
3.3tress Analysis: Thefollowingfigure3.3showscontour plot of the von-Mises stress. As per distortion energy theory, the maximum equivalent stress observed in the lowerarmmodelis344MPa.
3.1 Analysis Result of Baseline model
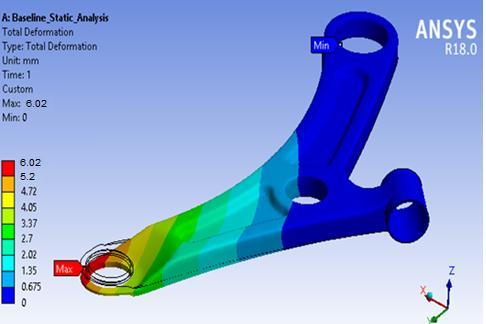
The baseline control arm exhibits a maximum displacement of 6.02 mm. According to the distortion energytheory,themaximumequivalentstressobservedin thelowerarmmodelis344MPa.Theyieldstrengthofthe material used is 415 MPa. The results indicate that the von-Mises stress of 344 MPa is lower than the yield strengthofthematerial.Consequently,thefactorofsafety forthebaselinelowerarmiscalculatedas1.2.
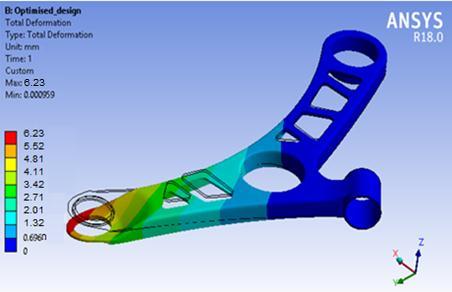
3.2 Deformation Analysis:
Thecontourplotsdisplayingthedisplacementdistribution are presented in Figure 3.2. It is observed that the maximum displacement exhibited by the baseline lower control arm is 6.02mm. This displacement is primarily concentrated at the ball joint end, while no significant deformation is detected at the fixed and turning ends of thecontrolarm.
3.3EquivalentStressPlotofBaselinemodel
From the above analysis it is found that Von-Mises stress is maximum nearer to turning joint. Also it is found that minimumstressisgeneratedatballjointandfixedend.
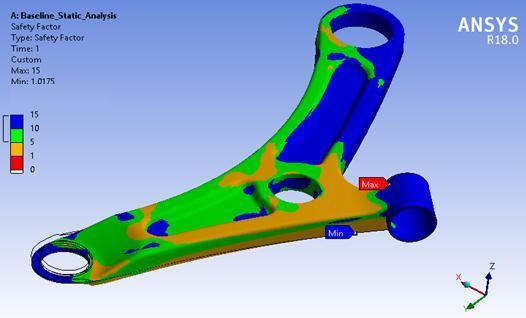
3.4Factor of Safety:
The material used in the lower control arm has a yield strengthof415MPa.Theanalysisresultsindicatethatthe von-Mises stress in the baseline model is 344 MPa, which isbelowtheyieldstrengthofthematerial.Asaresult,the factorofsafetyforthebaselinelowerarmiscalculatedas 1.2. These findings suggest that there is room for optimization and potential for reducing the weight or improvingtheperformanceofthelowercontrolarmwhile maintainingsafetyfactorswithinacceptablelimits.
Following table 3.1 shows FEA result analysis of baseline model.
3.5 Optimization of Lower Control Arm
Optimization is a process that involves identifying the most cost-effective or highest-performing alternative within given constraints. It aims to maximize desired factors while minimizing undesired ones. In contrast, maximization refers to the act of achieving the highest or maximum result or outcome without considering the associatedcostsorexpenses.
4 OPTISTRUCT MODEL
The optimized CAD is prepared in the modeling software. The same CAD is exported in “.step” format and imported inHYPERMESH.
Forcarryingoutanoptimization,firstwholebodysurface is filled with material and then same boundary condition isappliedwhichisasshowninfigure4.3
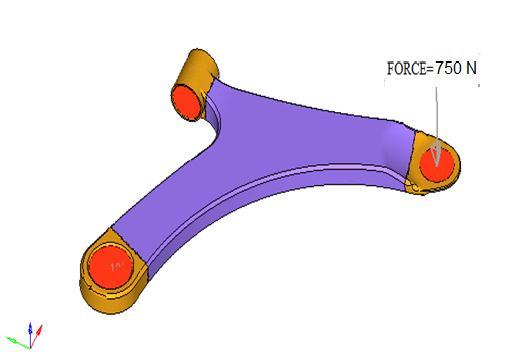
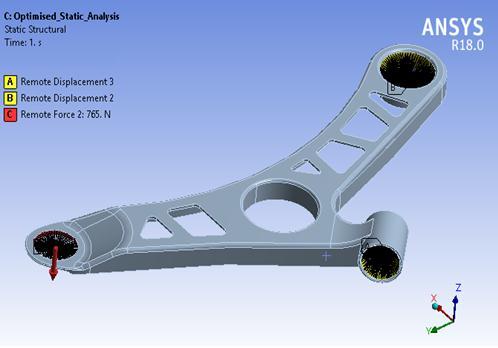
4.1 Boundary Conditions
The boundary conditions include restraining rigid body motion, applying force on another end of the control arm upto750N,
TheoptimizedCADmodelismeshedinHYPERMESHwith CTETRA elements. Following figure 4.2 shows the mesh modelforoptimization.
4.2 Analysis Result for Optimized Model
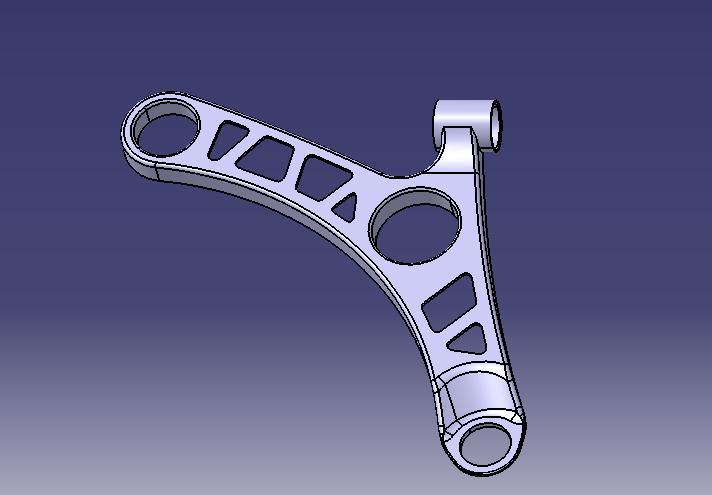
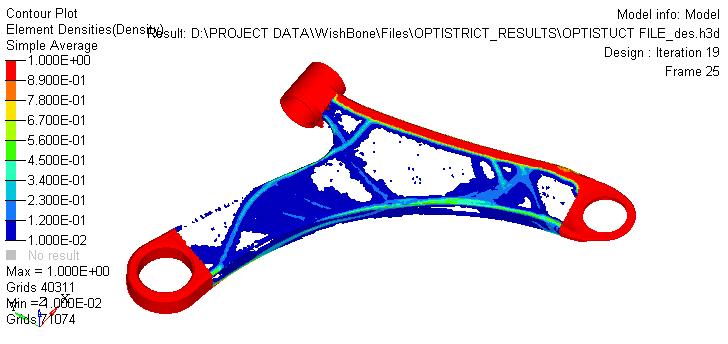
The element density plot provides an optimized pattern for the model, indicating areas within the lower control armwherematerialcanberemovedfromthedesign.This optimized design is derived from the initial design obtained through analysis. The preparation of the optimizeddesigniscarriedoutusingCATIAsoftware.
Belowfigure4.5showsthat lowstressblue region can be removedfromthedesignspacewhilekeep the redregion inthedesignspaceasitis.
Themassoftheoptimizeddesignisdeterminedtobe1.03 Kg, as illustrated in Figure 4.21. This indicates a decrease in mass from the initial value of 1.2 Kg to 1.03 Kg. Consequently, the total percentage reduction in mass is calculatedtobe15%.
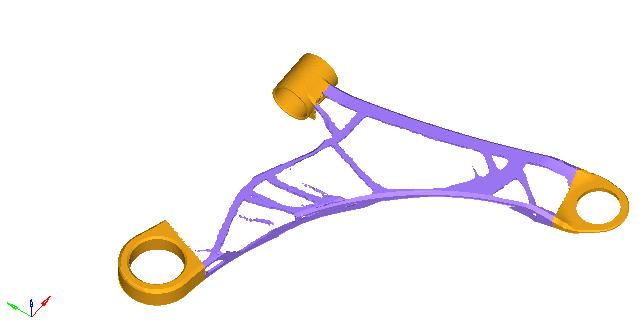
The optimized design is generated by extracting the raw material from the baseline design, based on the element density plot obtained through analysis. The optimized design,createdusingCATIAsoftware,isdepictedinFigure 4.6 and 4.7. These figures showcase the final design resultingfromtheoptimizationprocess.
The optimized model of the control arm is meshed using solid elements in ANSYS software. To generate the mesh, solid tetrahedral elements are employed for the control arm. Figure 4.8 illustrates the meshing of the optimized modelofthelowercontrolarm.
4.4
The boundary conditions applied to the optimized model are identical to those applied to the baseline model. A force of 750 N is applied at the remote location C of the lower control arm. Figure 4.9 depicts the boundary conditionsoftheoptimizedmodel,showcasingtheapplied forcesandconstraints.
4.6Equivalent
4.5
Following figure 4.10 shows the deformation plot of optimized design. The maximum deformation for the optimizeddesignisobservedupto6.23mm.
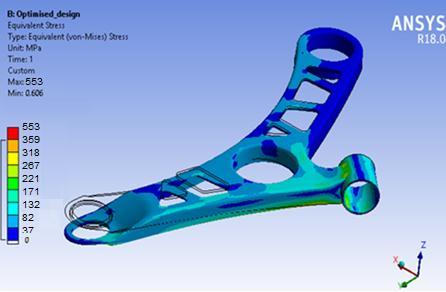
Above figure 4.11 shows the Equivalent stress plot of Optimized design. The von-Mises stress is observed upto 371Mpaforoptimizedmodel.
4.7
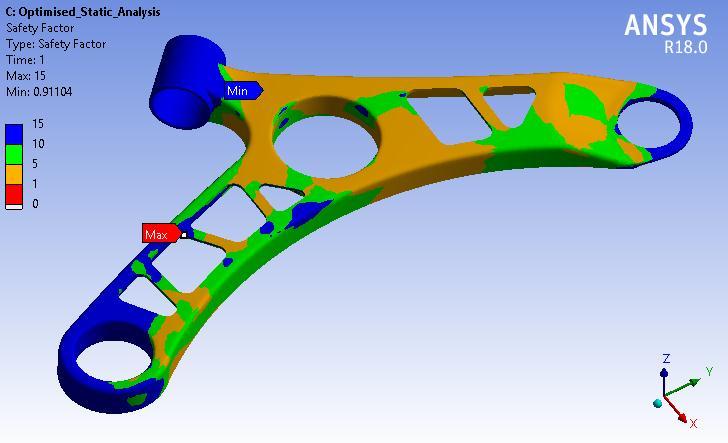
Theplotofthefactorofsafetyfortheoptimizedmodel,as shown in Figure 4.12, indicates that all sections of the lower control arm have a factor of safety greater than 1. Additionally,certainportionsofthearmexhibitafactorof safety ranging from 5 to 10. This suggests that the optimized model is deemed safe under the specified workingconditions.
Considering the material's yield strength of 415 MPa, the analysis results demonstrate that the von-Mises stress is 371 MPa, which is lower than the yield strength. Consequently, the factor of safety for the optimized lower controlarmiscalculatedas1.1.
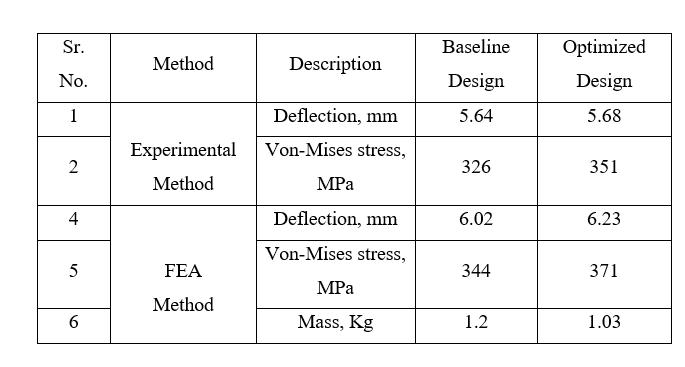
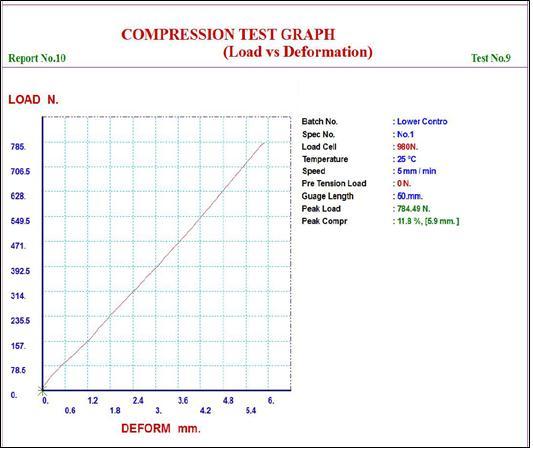
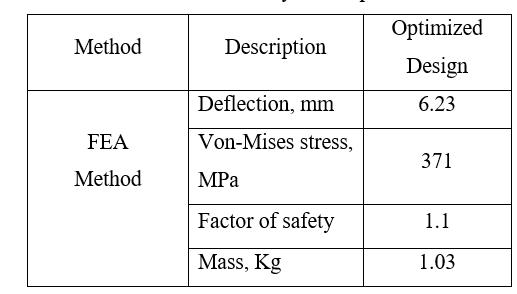
Table 4.1 provides a comprehensive overview of the FEA resultanalysisfortheoptimizedmodel,offeringadditional detailsandinsights.
model varies accordingly until it reaches a certain value. Similarly,the baselinemodel exhibitsa deformationof up to 5.64mm. Both models demonstrate deformation behaviorundertheappliedload,withtheoptimizedmodel showing a slightly higher maximum deformation comparedtothebaselinemodel.
Thereadingobtainedfromstraingaugetestisasshownin table5.1below.
6. DISCUSSION OF RESULTS
6.1
5. EXPERIMENTAL TESTING
The analysis reveals that the maximum deformation for the optimized model is measured at 5.68mm. As the applied load increases, the deformation of the optimized
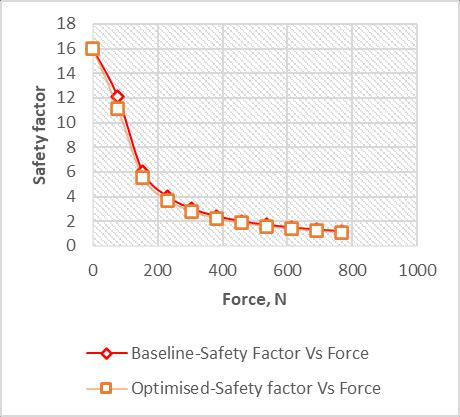
Following graph shows the results of both models by Finiteelementmethod.
Based on the graph presented in Figure 6.1, it can be observed that the deformation of the optimized model varies up to 6.25mm when subjected to a gradual application of load. This deformation is compared to the baselinemodel,showcasingthedifferencesindeformation behaviorbetweenthetwomodelsunderthesameloading conditions.
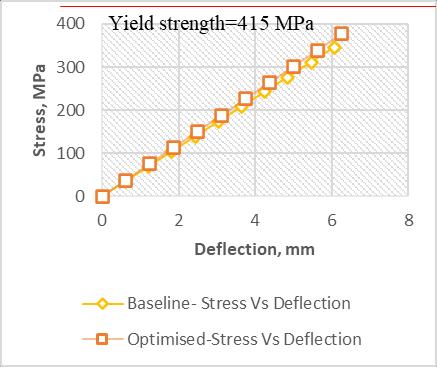
ExaminingthegraphdepictedinFigure6.3,itcanbenoted that there is an increase in stress within the optimized model as a result of the reduction in mass. However, it is importanttoemphasizethatthisincreasedstressremains below the yield limit of the material. Consequently, the design of the optimized model is considered safe despite theobservedincreaseinstress.
Upon analyzing the graph displayed in Figure 6.2, it is evident that the maximum stress induced in both the optimized and baseline models remains below the yield strength of the material. This observation confirms that the design is considered safe for the applied load conditions.
By examining the graph illustrated in Figure 6.4, it is apparent that a minor variation in the factor of safety, approximately 8%, can result in a significant reduction of 15% in the mass of a single lower control arm. This observation highlights the trade-off between the factor of safety and the weight reduction potential in the optimizationprocess.
6.2 Validation
In this project validation is done by comparing ANSYS software results with experimental results of optimized model.
Table6.2CalculationofPercentageError
TheFEAresultsarecomparedtotheexperimentalresults, yielding a percentage error of 8.1% and 6.49% for the deflectionandstressoftheoptimizedmodel,respectively. This comparison demonstrates a close convergence between the FEA predictions and the actual experimental measurements, indicating a good agreement between the twosetsofresults.
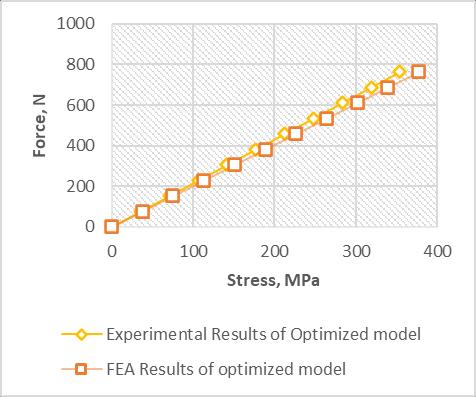
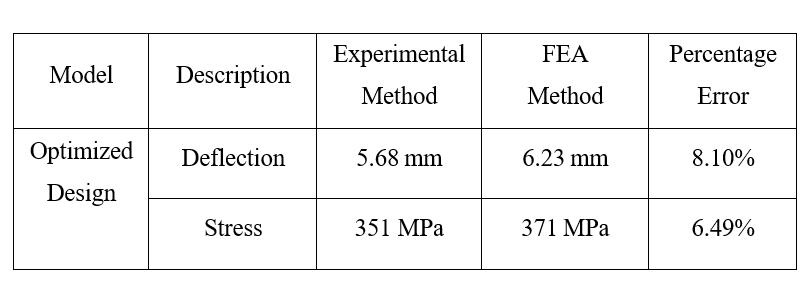
Figure:6.6CorrelationGraphplotofForcevs.Stress
Upon examining the graph presented in Figure 6.6, it can be observed that there is a correlation between the Force and Stress values obtained from both the experimental andFEAmethods.Thecomparisonofthesevaluesreveals a percentage deviation of 6.49%. This indicates that the results obtained from the FEA method closely align with theexperimentaldata,demonstratingastrongcorrelation betweenthetwoapproaches.
7. CONCLUSION
The existing and optimized models of the lower control arm were subjected to static structural analysis in ANSYS Workbench,evaluatingtheirstressanddeformationunder given boundary conditions. The deflection and stress levels observed in the optimized model were found to be within acceptable ranges, indicating that the modified designissafeforuse.Furthermore,theweightofthefinal optimizedmodelwasmeasuredtobe1.03kg.
Figure:6.5CorrelationGraphplotofForcevs.Deflection
Upon analyzing the graph displayed in Figure 6.5, it is evident that there is a correlation between the Force and Deflection values obtained from both the experimental andFEAmethods.Thecomparisonofthesevaluesreveals a percentage deviation of 8.1%. This indicates that the results obtained from the FEA method closely align with the experimental data, showcasing a strong correlation betweenthetwoapproaches.
By achieving a 15% reduction in mass and material cost while maintaining a satisfactory factor of safety for the optimized design, the objectives of weight and cost reduction were successfully accomplished. The reduction in unsprung weight contributes to an increased ratio of sprungweighttounsprungweight,resultinginasmoother rideforthevehicle occupants.Moreover, a higher ratio of sprung weight to unsprung weight can positively impact vehiclecontrol.
Overall, the weight reduction and cost optimization goals were met, leading to improved performance, ride quality, andcontrolforthevehicle.
[1] Prof. A. M. Patil et al“Experimental & Finite Element Analysis of Left Side Lower Wishbone Arm of
Independent Suspension System” IOSR Journal of MechanicalandCivilEngineering(IOSR-JMCE)e-ISSN: 2278-1684,p-ISSN: 2320-334X, Volume 7, Issue 2 (May.-Jun.2013),PP43-48.
[2] Rajashekhar Sardagi et al. “Design Analysis of Double WishboneSuspension” IJRET:International Journal of ResearchinEngineeringandTechnologyeISSN:23191163 ,pISSN: 2321-7308 Volume: 03 Special Issue: 03,May-2014 NCRIET-2014.
[3] Vinayak Kulkarni et al. “Finite Element Analysis and Topology Optimization of Lower Arm of Double Wishbone Suspension using RADIOSS and Optistruct”
International Journal of Science and Research (IJSR) ISSN(Online):2319-7064Volume3Issue5,May2014
[4] Sagar Darge et al. “Finite Element Analysis and Topography Optimization of Lower Arm of Double Wishbone Suspension Using Abacus and Optistruct”
International Journal of Engineering Research and Applications .ISSN : 2248-9622, Vol. 4, Issue 7( Version6),July2014,pp.112-117.
[5] Jagwinder Singh et al. “Static Structural Analysis of suspension arm using Finite Element Method” IJRET: International Journal of Research in Engineering and Technology eISSN: 2319-1163,pISSN: 2321-7308 Volume:04Issue:07July-2015.
[6] SarvadnyaAjinkyaThakareetal.“DesignandAnalysis of Modified Front Double Wishbone Suspension for a Three Wheel Hybrid Vehicle” Proceedings of the World Congress on Engineering 2015 Vol II WCE 2015,July1-3,2015,London,U.K.
[7] Balasaheb Gadade et al. “Design, analysis of A-type front lower suspension arm in Commercial vehicle”
International Research Journal of Engineering and Technology (IRJET) e-ISSN: 2395-0056 Volume: 02 Issue:07,Oct-2015.
[8] Nikita Gawai et al. “Design, Modelling& Analysis of Double Wishbone Suspension System “International Journal on Mechanical Engineering and Robotics (IJMER) ISSN (Print) : 2321-5747, Volume-4, Issue1,2016