ANALYSIS OF TOOL WEAR IN MILLING USING MACHINE LEARNING TECHNIQUE
1Sushant J. Student, MIT School of Engineering, Pune

2Manas S. Student, MIT School of Engineering, Pune
3Abhishek P. Student, MIT School of Engineering, Pune
4Amey O. Student, MIT School of Engineering, Pune
5Ajaykumar U. Associate Professor, MIT School of Mechanical Engineering, Pune ***
Abstract - Predicting tool wear while machining is a difficult aspect. Traditional methods to use process characteristics that affect tool wear are available, however, some parameters are particular tothemachiningprocess,and existing prediction models fail. The current work discusses a process supervision system that uses machine learning (logistic regression) to anticipatetoolwear.Anapplicationfor the prediction of tool wear while milling is chosen as a case study to demonstrate the methodology. The next dataset will be created by running the milling operation with the end mill cutter under three different conditions, namely 1. New Tool,2. Medium Wear Tool, and 3. Blunt Tool, and recording the vibration reading as acceleration and frequency using an FFT analyzer. There are many vibration analysis techniques, but choosing the best one requires evaluating the parametersand surroundings of the milling operation. The frequency domain is used for vibration analysis. Utilizing the Logistic Regression Method, train the acquired dataset and predict accuracy, as well as the tool condition using this prediction. The accuracy of the trained model is 99.1%. Now with the obtained accuracy, it is possible to implement this algorithm in industrial working conditions to accurately predict the conditioning of the tool.
Key Words: tool wear prediction, logistic regression, milling machine, vibration Analysis, FFT Analyzer.
1.INTRODUCTION
To be competitive, manufacturing sectors prioritize improvingbothqualityandproductioncosts.The'Qualityat Source' idea mandates that quality be inspected at every stage.Poorlycompleteditemsaretheresultofusingwornout tools for milling. Due to subpar output, a bad finish resultsinqualitylossandrejection.Costswillgoupifatool isusedtopreventadropinquality.[1]Trackthemachining quality by foreseeing tool wear, monitoring the Tool Life Cyclehasgainedpopularityintheresearchcommunity.Itis challenging and complex to mathematically describe the machiningprocess.ThereareattemptstoproposeArtificial NeuralNetwork(ANN)basedapproachestopredictthata toolisworn.Theaboveapproacheslackarobustmethodto selectfeaturestopredicttoolwear.Techniqueswithspecific
sophisticated optical sensors, such as laser displacement sensors, have been used to monitor tool conditions and identifythestatusoftoolwearinreal-time.However,these methodsarestillchallengingtoutilizeinthesectorbecause to their high cost and challenging assembly. Data-driven solutions are becoming more and more successful at predicting downtime and keeping track of the health of machine tools because to substantial advancements in computinganddatascience.Largevolumesofdataarebeing gatheredduringmachiningduetotheavailabilityofbetter sensor technologies, necessitating the need of a robust feature selection approach. The milling machine that was tested.Inthispapertheapproachusedfortoolmonitoringis based on vibration analysis and applying those vibration data (Acceleration Vs Frequency) on machine learning techniques to predict tool wear. FFT used for data acquisition.Thereareseveralmethodstoanalyzevibration. Frequency domain works with higher frequency. It is observed that abnormal peaks are obtained at higher frequency.[2] So, acceleration taking as a parameter to vibration analysis. It is observed when machining with different tool conditions the acceleration peak also varies with respect to tool condition. Observations are then collected with higher frequency. New tool, medium worn tool and blunt tool is used for dataset preparation. In this projectalogisticregressionapproachisusedtodescribethe tool wear based on features that is determined by the multinomial logistic regression algorithm. The proposed methodsetsupaprocessforsupervisionanda predictive modelonamillingmachiningprocessdataset.
2. LITERATURE REVIEW
PoojaV.Kamat,et.al.[1]Thekeyfindingsarethatmachine learningtechniqueshelpinmakingmachinesmoreaccurate. Thispaperdiscussedacomparativeapproachtotoolwear monitoringusingtheclusteringmachinelearningtechnique ofK-NearestNeighbour(k-NN)anddeeplearningtechnique ofConvolutionalNeuralNetwork(CNN).TheCNNandAELSTM techniques out-perform k-NN by achieving a higher degreeofseparabilityofaround93%and87%,respectively. The techniques provide improved outcomes in terms of precision,recall,andf1-score,indicatingthatthemodelsare moreaccurateatdetectingfalsepositives.
VedantParwala,et.al.[2]Papersuggestsaboutthedataseton millingmachine.Toolwearpredictionduringmachiningisa challengingproblem.Traditionalapproachesareavailableto usetheprocessparameterswhichinfluencetoolwearbut therearecertainparameterswhichareveryspecifictothe machining process and available prediction models fail. PresentworkdiscussesaMachineLearningbasedprocess supervisorysystemtopredictthetoolwear.
M.A.Elbestawi,et.al.[3]givesinformationaboutmachine learningtechniques.Thispaperpresentsanin-processtool wear prediction system, which uses a force sensor to monitortheprogressionofthetoolflankwearandmachine learning (ML), more specifically, a Convolutional Neural Network (CNN) as a method to predict tool wear. The proposed methodology is experimentally illustrated using millingasatestprocess.
Martin Zekveld, et.al. [4] Vibrations occur in all moving machinery while in operation. Every material has a characteristicpatternofvibrationunderspecificconditions. Measuring, recording, and studying the changes in these vibration characteristics can be used to understand the changesinthetestmaterial itself.Thispaperpresentsthe useofvibrationanalysisofthecuttingprocessinmillingto indicatethepresenceandprogressionofdamageincurred by an end mill. The metal cutting experiments were performed on a mild steel workpiece without using any coolant to accelerate damage to the cutter, and classical processing schemes in time and frequency domains were appliedtotheresultingvibrationsofthecuttingprocessto obtaindiagnosticinformation
3.IDENTIFICATION OF GAPS/SCOPES OF WORK
The manual tool wear analysis is time consuming andnotprecise.
Most of the existing modern methods are complicatedandcostly.
As a good alternative, there is a requirement of simple,fast,precise,costeffectiveandappropriate machinelearningbasedmethodologyforanalysisof toolwearandthustoimprovisetoolperformance
4. PROBLEM STATEMENT
To analyse tool wear in milling using machine learning technique and its incorporation on milling machines to investigateendmillcutterperformance.
5. OBJECTIVES
● Tostudyandunderstandthefundamentalsoftool performanceandlogisticregressiontechnique.
● To develop logistic regression-based method algorithmstoinvestigatetoolconditionfortheend millcutteronamillingmachine.
● Toincorporatevibrationcorrelationdevelopedan algorithm to analyse tool condition for end mill cutters.
6. METHODOLOGY DETAILS
The project is carried out on an experimental basis. Tool failure happens randomly while machining. Workpiece damage and quality of work decreases because of tool failure.
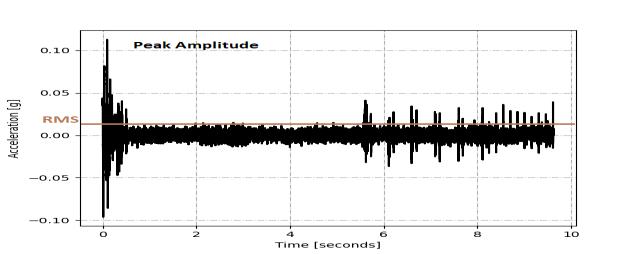
Fig -1 ProcessFlowchart


To reduce risk of failure of tools the machine learning techniques used. According to the literature survey tool failureseemstobeamajorissuewhilemachining.Factors affectingtoollifei.e.,Cuttingspeed,Feedrate,Depthofcut. Vibrations produced because of worn tools. So, consider vibrationasaparameterforpredictionoftoolwear.Milling machineusedforexperiment.Setupofexperimentcarried on a mailing machine. For detection of vibration FFT analyser used. FFT analyser provide vibration of different toolconditionsi.e.,newtool,mediumweartool,blunttool while machining. Data is collected in the excel format. Machine learning technique used to predict tool wear. Logistic regression method used for classification and the logistic regression model train with dataset. with the maximum accuracy model available publicly for testing of millingtools.
7. VIBRATION ANALYSIS
Vibration analysis is a process that involves the measurement, analysis, and interpretation of vibration signalstounderstandthebehaviorandconditionofasystem orstructure.
7.1 VIBRATION VARIABLES
Theamplitudeismeasuredandrecordedintermsofthree physicalparameters.[5]Theyare:
• Displacement
Represents the distance between the component's at-rest positionandthelocationfromwhichitdeviatesthemost.It counts the amount of movement of the component. Millimeters (mm), micrometers (m), or other suitable displacementunitsareusedastheunitsofmeasurement.
• Velocity
representsthedistancetravelledperinstant.Itrepresents the rate of vibration of the component. Micrometers per second (m/s) or millimeters per second (mm/s) are the units.
• Acceleration
representsthevelocitychangerate.Whenthecomponentis movingintheoppositedirection,itishighest.Micrometers per second squared (m/s2) or millimeters per second squared(mm/s2)areusedtomeasureit.
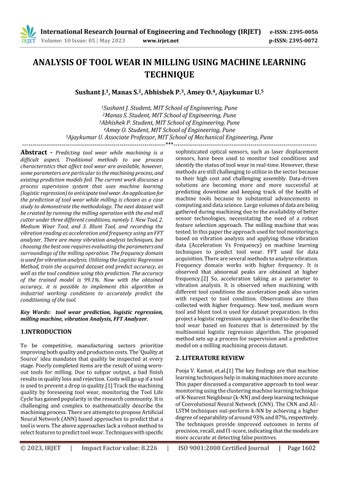
7.2 Time Domain Analysis
In time domain analysis, the tool vibration signal is examineddirectlyinthetimeseries.Thisapproachprovides insights into the tool's dynamic behavior over time. Key parameterscommonlyanalyzedinthetimedomaininclude:
Amplitude:
Themagnitudeofthevibrationsignalatagiventime point.
Timewaveform:
The graphical representation of the vibration signal as a functionoftime.Itallowsforvisualinspectionofthesignal's characteristics,suchasthepresenceofspikes,irregularities, ortrends.
Statisticalmetrics:
Quantitative measures such as mean, standard deviation, and variance can provide information about the central tendencyandvariabilityofthevibrationsignal.Figure4.3 representsanexampleoftimedomainanalysis.
Fig -2 Timedomainanalysis
7.3 FREQUENCY DOMAIN ANALYSIS
In frequency domain analysis, the tool vibration signal is transformedfromthetimedomaintothefrequencydomain usingtechniquessuchastheFouriertransform.Thisenables the examination of the signal's frequency components as representedasanexampleinFigure3.
Fig -3 Frequencydomainanalysis

CombiningTimeandFrequencyDomainAnalysis:Bothtime and frequency domain analyses provide complementary informationabouttoolvibrations.Thetimedomainanalysis allows for the observation of transient events and overall signalbehavior.Thetimedomaingivesthebestresultata lowerspeedbelow100RPM.[7]Whilethefrequencydomain works accurately at higher speeds i.e., above 100 RPM. Frequencydomainanalysisprovidesadetailedbreakdown ofthevibration'sfrequencycomponents
8 EXPERIMENTATIONS
In the Chapter experimental setup process is elaborated which includes milling machine setup and FFT Analyzer setuptoacquirethevibrationdatasetandanalysispart.
8.1MILLING MACHINE SPECIFICATION
Figure 4 shows the milling machine used for experimentation and below are the specifications of the machine. The conventional milling machine is used to performendmillingwiththeslottingoperation.
Table WorkingPace-1125mm-250mm.
No.ofT-Slotsandsize-3 18mm.
Range CrossFeedbyHand-250mm.
VerticalFeedbyHand-435mm.
LongitudinalFeedbyHand/Auto600/525mm.
Spindle Spindlearbor-25.4mm.
No.ofspindlespeed-8
Rangeofspindlespeed-50-800mm.
Feeds No.offeeds-4
Drive Spindlemotor1440RPM–1.5kw/2hp
8.2 FFT Analyzer Specification
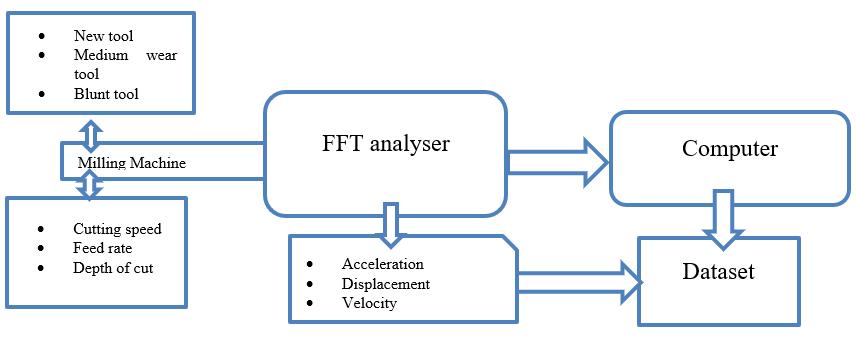
Figure5showstheFFT(FastFourierTransform)Analyzer usedintheExperimentationandthebelowtableshowsthe specificationoftheFFTanalyzerusedintheExperiment.
Numberof channels 8
Inputs Voltage,fullbridge
ADCtype 24-bitsigma-delta withanti-aliasingfilter
Samplingrate Simultaneous200KS/sec
Inputtype
Differential
Modes Counting,waveformtiming,encoder, tacho,geartoothsensor
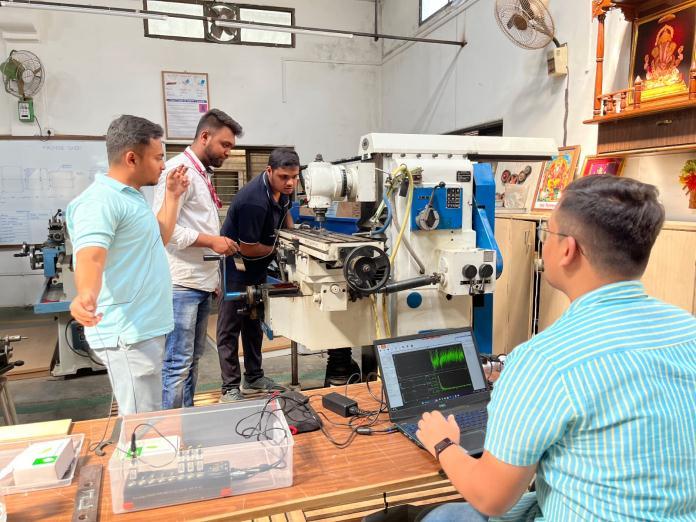
Figure 6showsthe experimental setup and procedure for theexperimentation.Toacquirevibrationdataofamilling tool using an FFT (Fast Fourier Transform) analyzer, procedureismentionedbelow:
Initiate the data acquisition process on the FFT analyzer. Activatethemillingmachinetostartthemillingoperation. With 0.5 mm of depth of cut and 380 RPM. Allow the machinetooperateforthespecifieddurationornumberof revolutions. And perform slotting operation according to geometry.

8.3 Analyse and Interpret Results:
Examine the frequency spectrum obtained from the FFT analysis.Identifysignificantpeaksorfrequencycomponents that indicate vibration patterns or abnormalities. Analyze the amplitudes and frequencies to gain insights into the vibrationcharacteristicsofthemillingtool.
Repeatthedataacquisitionprocesswithdifferentmilling toolconditionstogathercomparativedata.
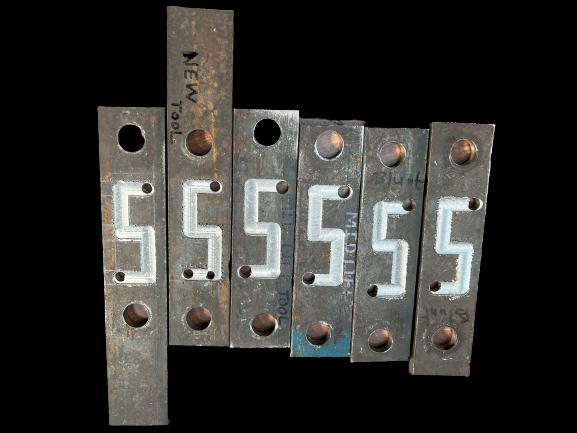
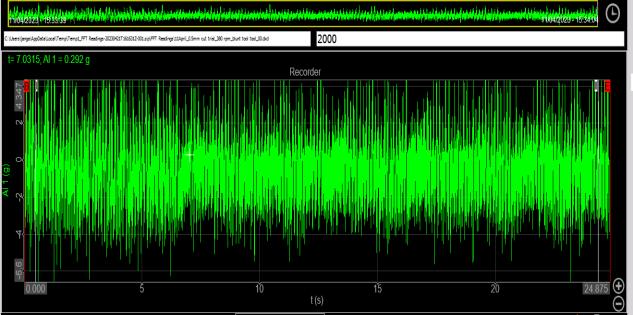
Fig -8 ExperimentOutcome
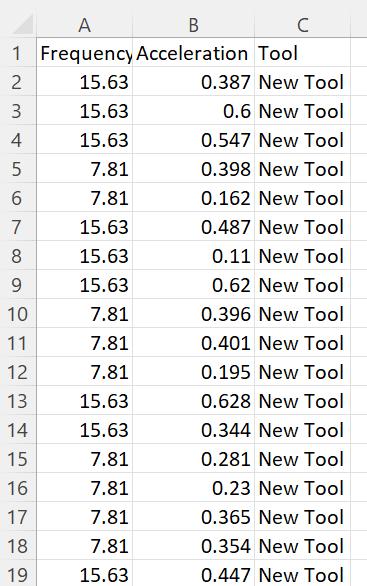
8.4 Data Acquisition
TheFFTanalyzerrecordsthevibrationmadebythemilling tool, and it also records the readings for acceleration and frequency.Thealgorithmisthenfedtotheprepareddataset. Therearenaturalvibrations,orthemachinevibratesonits ownwhileignoringtheuniversalnaturalvibrationspresent ineverytool.ThedatasetformatforFastFourierTransform (FFT)analysistypicallyfollows atabularstructure,where each row represents a data point or sample, and each columncorrespondsto a specific attribute orfeature. The dataset is manually created by choosing the frequency's highestaccelerationpeak.Thedatasetconsistsof7360rows. With3columnshavingFrequency,AccelerationandToolas showninTable3
9. Machine Learning Model
LogisticregressionissupportedbytheScikit-Learnlibrary's LogisticRegressionclass.Setthe"multi_class"argumentto "multinomial" and the "solver" argument to a solver that supportsmultinomiallogisticregression,suchas"lbfgs"to configure the Logistic Regression class for multinomial logisticregression.[1]Inthisstepthetrainingandtestingof thedatasetiscarriedout.WithrespecttoXandYvariable 70%ofthedataisusedforthetrainingandtheremaining 30%isutilizedfortesting.Nowthisprocessof70%training and30%testingisrandomizedalloverthedatasetforbetter accuracy.
x_train,x_test,y_train,y_test=train_test_split(data[['Frequen cy','Acceleration']],data['Tool'],test_size=0.3)
fromsklearnimportlinear_model
mymodel=linear_model.LogisticRegression()
mymodel.fit(x_train,y_train)
Now as per the required dataset model, the logistic regressionmodelisimportedinthealgorithm.
LogisticRegression LogisticRegression()
Nowbasedontheaboveimportedlibrariesandthedataset providedtheaccuracyof98.87%isgivenbythealgorithm.
mymodel.score(x_test,y_test)*100
98.87907608695652
10. Result and Discussion
10.1 Time Domain Result
Initially, the method was referred to as Time Domain analysis.Whendisplacement,acceleration,andvelocitywere examined, it was discovered that these parameters were nearly the same for each tool. It is difficult to analyze becauseitisanewmedium.And58%accuracyisregarded asextremelypoor.
58.92857142857143
So,itisdifficulttoachievetheproposedgoalwithtime domainanalysis.
Milling Operation: StraightSlot
Table4indicatestheaccelerationrangeoftoolinTime Domainwithrespecttotime.
10.2 Frequency Domain Result


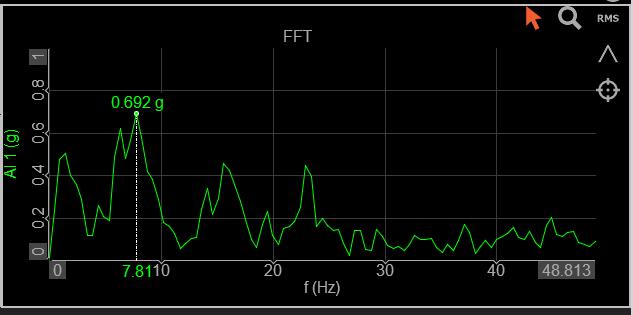
Thefrequencydomainapproachisusedfortheanalysisof vibration. The data collected with manual observation is beinganalyzed.AspertheconsideredparameterFrequency and acceleration, it is observed that there is variation in accelerationvariationforthreedifferenttools.So,selecting Frequency domain analysis to achieve the proposed goal. Thefrequencyatwhichthemaximumpeakofaccelerationis observed.7.81Hzand15.63Hz.Thesetwofrequenciesare ofthetwotipsoftheEndMillcutter.
Milling Operation: S-Slot
Table5showstheaccelerationrangeofthetoolwithrespect tofrequencyintheFrequencyDomain.Accelerationvaries withfrequency.
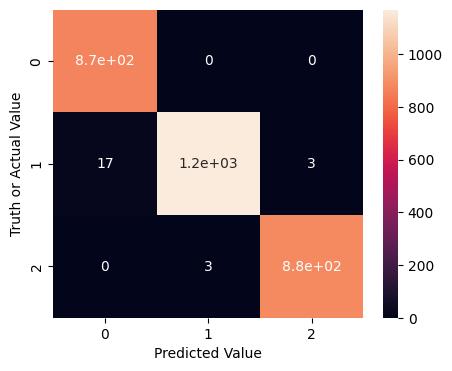
Thelogisticregressionmodelachievedanaccuracyof98% on the testing set, indicating its effectiveness in tool monitoring.
mymodel.score(x_test,y_test)*100
98.87907608695652
These metrics demonstrate the model's ability to identify faulty tools accurately. The model accuracy value of 0.98 indicates a good discriminatory power of the model. The confusionmatrixshowstheprecisionofthemodelasshown inFigure13.
3. CONCLUSIONS
Inthisproject,logisticregressiondemonstratedpromising results in tool monitoring, achieving high accuracy, precision, recall, and a good discriminatory power. The findings suggest that logistic regression can be a valuable toolformonitoringindustrialprocesses,aidinginthetimely detection of tool failures, and improving operational efficiency. The project suggests a strategy for creating a supervisory system for machining to track tool wear. The suggestedsolutiondemonstratesadaptabilitytooperating circumstances and can be configured with any machining systemthatexecutesvariousoperationsorgathersvarious processdata.Thismethodcanalsobeusedtoestimatethe numberofoperationsthecuttingtoolwillsurvivegiventhe probabilityoftoolwear,whichshortensthetimerequired for a tool changeover. These monitoring systems can be utilized in medium-sized manufacturing facilities to efficiently halt operations and ensure continuous production. A strong tool management system will result from this, which will also lower the overall tool cost per unitofproduction.Usingthelogisticregressiontechniqueto trainthedataandcollectthereadinginthetimedomainone can achieve accuracy up to 58.92%. Using the logistic regressiontechniquetotrainthedataandcollectthereading intheFrequencydomainonecanachieveanaccuracyofup to98.64%.Nowwiththeobtainedaccuracy,itispossibleto implementthisalgorithminindustrialworkingconditionsto accuratelypredictthecondition.Thus,byusingtheLogistic regressiontechniquetoolconditioncanbedetermined
REFERENCES
Theresultofthemodeliselaboratedbyagraphthatshows thecorrelationofaccelerationandfrequencywithdifferent conditioned tools. The analysis of the result is shown in Figure14

[1] Pooja V. Kamat et. al., “Tool wear Prediction in milling: Comparative Analysis Based on Machine Learning”IJCDsjournalPublished9Jan2022
[2] Vedant Parwala et.al,“Machine learning based approach for process supervision to predict tool wearduringmachining”ElsevierB.V.ProcediaCIRP 98(2021)133–138.
[3] M.A.Elbestawiet.al.,“In-processmonitoringoftool wear in milling using cutting force signature” International Journal of Machine Tools and Manufacture,Volume31,Issue1,1991.
[4] ShixuSunet.al.,“ToolbreakageDetectionofmilling cutting insert based on SVM” Elsevier Ltd. (International Federation of Automatic Control), Volume52,Issue13,2019
[5] SebastianBombinskiet.al.,“Detectionofaccelerated tool wear in turning” by Elsevier Ltd. Mechanical SystemsandSignalProcessing.18May2021
[6] Caixu YUE et.al., “A review of chatter vibration researchinmilling”ChineseJournalofAeronautics, 1June2018.
[7] Maciej Tabaszewski et.al., “Machine Learning Approaches for Monitoring of Tool Wear during GreyCast-IronTurning”MDPIJournalConference Series:MaterialsScienceandEngineering,Volume 624,Materials2022, 15(12),4359.
[8] M Schwenzer1 et.al., “Machine Learning for Tool WearClassificationin MillingBasedonForce and Current Sensors” IOP Publishing. DOI10.1088/1757-899X/520/1/012009.
[9] ZhouChang'anet.al.,“Vibrationsingularityanalysis for milling tool condition monitoring” by Elsevier Volume166,15January2020,105254.
[10] HamedMoradiet.al.,“Forcedvibrationanalysisof the milling process with structural nonlinearity, internalresonance,toolwearandprocessdamping effects” International Journal of Nonlinear MechanicsVolume54,September2013,Pages2234.