Detection of Early Leaf spot of groundnut using Neural Network techniques
Revati R. Nalawade1 , S. D. Sawant2 , P. M. Ingle3, V. G. More41Ph. D. Scholar, Department of Plant pathology, College of Agriculture, Dapoli
2Vice Chancellor, Dr. Balasaheb Sawant Konkan Krishi Vidyapeeth, Dapoli
3Associate Professor, Department of Irrigation & Drainage Engineering, CAET, Dapoli

4Agrometerologist, Department of Agronomy, College of Agriculture, Dapoli ***
Abstract - India ranks second in groundnut and its oil production after China followed by USA and Nigeria (Tiwari et al., 2018). In Konkan region groundnut is grown on 20,000 ha area with a productivity of 1800 kg ha-1 [1]. The area under groundnut crop has increased enormously in Konkan region. The major biotic factors affecting groundnut yield and quality are foliar diseases, viz. early (Cercospora arachidicola Hori.) and late leaf spots (Phaeoisariopsis personata Berk. And Curt.). The combined losses due to both these leaf spots are more than 50% depending on the time of occurrence and congenial weather. The disease damage the plant by reducing the leaf area available for photosynthesis and stimulating the leaflet abscission leading to heavy defoliation [2] In order to improve the recognition rate of disease diagnosis, researchers have studied many techniques using machine learning and pattern recognition such as Convolutional Neural Network, Artificial Neural Network, Back Propagation Neural Network, Support Vector Machine and other image processing methods. Due to higher performance capability in terms of computation and accuracy, Convolutional Neural Network (CNN) and Artificial Neural Network (ANN) models are most widely used for detection of plant diseases in agriculture [3]. With this view, the present investigation is planned to develop disease detection model with the help of Convolutional neural network and Artificial neural network for early leaf spot of groundnut caused by Cercospora arachidicola
Key Words: Convolutional Neural network, Artificial Neural network, Teachable machines, Mobiroller, Multilayer Perceptron, Conjugate Descent gradient, Levenberg Marquardt.
1.INTRODUCTION
Indiarankssecondingroundnutanditsoilproduction afterChinafollowedbyUSAandNigeria[4].Itcontains4850%oiland26-28%protein,andarichsourceofnutrients. In Konkan region groundnut is grown on 20,000 ha area with a productivity of 1800 kg ha-1 [1]. Optimum temperature and humidity with potash rich porous soil favors higher pod yield in groundnut in this region as comparedtorestoftheMaharashtra.
The major biotic factors affecting groundnut yield and qualityarefoliardiseases, viz. early(Cercospora arachidicola Hori.) and late leaf spots (Phaeoisariopsis personata Berk. And Curt.). These are the most widely distributed and economicallyimportantfoliardiseaseofgroundnutcausing severreductioninoilcontent.Thecombinedlossesdueto boththeseleafspotsaremorethan50%dependingonthe time of occurrence and congenial weather. The disease damage the plant by reducing the leaf area available for photosynthesisandstimulatingtheleafletabscissionleading toheavydefoliation[2].
In order to improve the recognition rate of disease diagnosis,researchershavestudiedmanytechniquesusing machine learning and pattern recognition such as Convolutional Neural Network, Artificial Neural Network, BackPropagationNeuralNetwork,SupportVectorMachine etc. Due to higher performance capability in terms of computationandaccuracy, Convolutional Neural Network (CNN)andArtificialNeuralNetwork(ANN)modelsaremost widelyusedfordetectionofplantdiseasesinagriculture[3]. With this view, the present investigation is planned to develop disease detection model with the help of ConvolutionalneuralnetworkandArtificialneuralnetwork for early leaf spot of groundnut caused by Cercospora arachidicola
2. LITERATURE SURVEY
Kumar and Sowrirajan [5] proposed an image-processing based approach to automatically classify the normal or diseasedleaves(Earlyleafspot,Lateleafspot,Alternarialeaf spot). The RGB image samples of leaves of groundnut, mango,brinjal,tomatoandmaizewerecollectedusinghigh resolutioncamera.Duringpre-processingstage,theresizing of image to 256x256 pixels, color space conversion and region of interest selection was performed. Color, texture andgeometricfeaturesoftheimagewereextractedbythe HSVconversion,GLCMandLloyd’sclusteringrespectively. BPN-FF classifier was used for classification based on learningwiththetrainingsamplesandtherebyprovidedthe informationonthedisease(Earlyleafspot,Lateleafspotand Alternaria leaf spot) as well as the respective control measures.
GowrishankarandPrabha[6]appliedthreshold-basedcolor segmentationtechniqueforimagesegmentationalongwith Artificial neural network classifier to analyze Leaf spot of groundnut. The groundnut leaf images for study were collected from a groundnut farm using high resolution camera,fromwhich6setofcolorimages wereselected.A numberofcolorimagesegmentationtestswereperformed on the selected set of images to obtain the different thresholdvaluesforcomplex,realandlowintensityimages. The ANN wastrainedusing these thresholdvalues. At the 37thepochANNreachedthegoalwiththebestperformance oftrainingiterations.TheclassifiedimagesbytheArtificial Neural Network gave result as 51.98% of leaves were affectedbyleafspotdisease.
Patil andNagpure [7]developeda NorthernLeafblight of Corn detection model using Teachable machine platform. The uploaded dataset contained 1090 healthy leaf images and1762 northernleafblightinfectedleafimagesofcorn plantscollectedonfieldmanuallywithsmartphonecamera. theimageprojectmodelselectedfordiseasedetectionwas trainedat50epochs,16batchandwith0.001learningrate. Thedevelopedmodelachieved98%accuracyfordetection ofnorthernleafblightand99%accuracyforhealthyleaves. ThedevelopedmodelwasdeployedusingWebApp.
3. MATERIAL AND METHODS
3.1 Crop sowing and Maintenance details
Groundnutisanannuallegumecropandtheincidenceof leafspotcanbefoundinallseasonsdamagingtheplantby reducing the leaf area available for photosynthesis and causingdefoliation.Sowingofgroundnutseedsc.vKonkan TrombayTaporawasdoneinfirstweekofJunei.e.,8th June 2022at20×15cmspacing.Thefieldsoilwaslateriticwith soilpH4.41andelectricconductivity0.038dSm-1
3.2 Technology used
Thermalimagesofgroundnutleaveswerecollectedusing FLIROne MSX® thermal camera with the ability to detect temperaturedifferencesassmallas0.18°F(0.1°C).TheRGB imageswerecollectedusingVivoS1smartphonewith32MP front camera and 16MP+8MP+2MP rear camera which captures images with 1080 × 2340 pixels resolution. To developCNNbasedneuralnetworkandmobileapplication platform Teachable machine (https://teachablemachine.withgoogle.com/)andMobiroller (https://www.mobiroller.com/en/) websites were used. Artificial neural network model was developed using Neurosolution’sArtificialNeuralNetworkSoftware.
3.3 Image collection techniques
Thermal image collection using FlirOne Thermal imaging camera
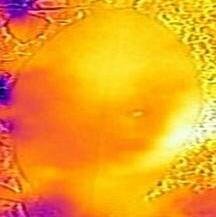
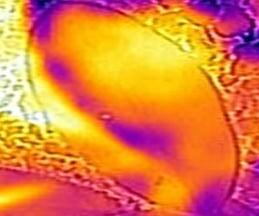
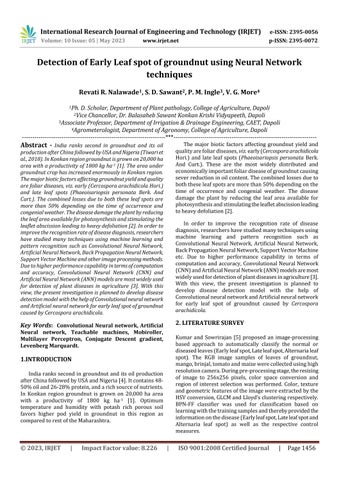
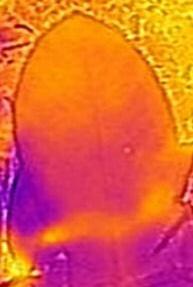
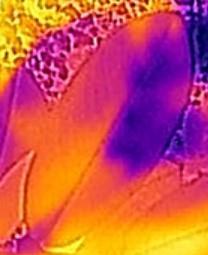
Healthy groundnutleaves (100) wereselectedandtagged for observations The leaves were tagged before development of infection and observed daily. Tagging of leavesandimagecollectionwasstartedonthesameday.The FlirOne thermal camera was carefully mounted on the smartphone and held at a distance of approximately 0.5 meter to capture the image. The image collection was continued at 2-day intervals till full visual symptom development of leaf spot of groundnut (Fig.1). Thermal imagecollectionwasdoneinmorningduring09:00amto 10:30amregularly.
in sequence
RGB image collection using Smartphone Camera
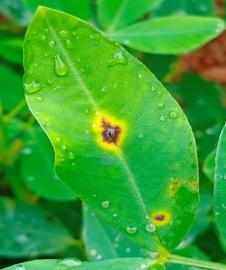
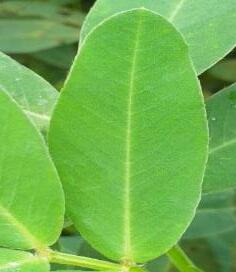
RGB images of healthy groundnut leaves and leaves infected with leaf spot disease were taken at random All collected images were in RGB format and collected using smart phone camera. The smart phone was vertically oriented at a distance of 0.5 meter from the plant sample whilecapturingtheimages.Imagesweretakenseparately forinfectedandhealthyleaves.Imageswerecollectedinthe morningduring10:00AM–12:00PM.Thecollectedimages contained the disease symptoms of the respective disease only and were free from other insect pest attack and pathogeninfection.TotalRGBimagedatasetcontained700 images each of diseased and healthy leaves (Fig.2) out of which,500images wereusedtotraintheCNN model and 200imageswereusedforvalidation.
Thermal
Data grouping and rename
Collectedthermalimagesweresegregatedandgroupedon the basis of No. of observation/tag and observation day Thermalimageswererenamedasperdateandtagno.and werearrangedinsequence.
Temperature difference data extraction
EachimageofasingletagwasviewedinFlirOnethermal camera image view application. The FlirOne application providedinformationregardingreflectancetemperatureof plant surface, IR resolution, time and date on which the imagewastakenandemissivity.Temperaturedifferencein healthyanddiseasedleafareaforeachtagfromdayoneon whichdatacollectionwasstarted,onedaypriortosymptom appearance,dayofsymptomappearance3rddayofsymptom appearance and 5th day of symptom appearance were calculated. For day one and the day before symptom appearancetwotemperaturevaluesfromthehealthyareas were taken. After symptom appearance the temperature valueofdiseasedandhealthyleafareawastaken.
The temperature values of healthy and diseased leave areas were compared using paired ‘t’ test. Here, both the temperaturevaluesweredependentoneachothertherefore, paired‘t’testwasselected The‘t’testprovedthattherewas nosignificantdifferencebetweentemperaturevaluesofday oneandthedaypriortosymptomdevelopment.The‘t’test wasfoundsignificantforthetemperaturedifferenceofthe first day of symptom development, 3rd and 5th day of symptomdevelopment(Table1)
Theobservationsofthesethreedayswereclassifiedinto temperature difference grade based on minimum and maximumtemperaturedifferenceandwereusedtodevelop artificialneuralnetworkmodel(Table2).
RGB Image processing
The randomly collected RGB images of leaf spot of groundnutusingsmartphonecameraweretransferredtothe laptop and saved into a single folder. RGB images which clearly showed leaf spot disease symptoms without any otherdiseasesymptomswereselected. Theimagecontrast andsaturationwereadjustedtohighlighttheinfectedarea. TheRGBimagedatasetofgroundnutleafspotdiseasewas renamedasLeafspot(ImageNo.)andgroupedintoasingle folder.
3.5 Artificial neural networking model development using thermal dataset
ANN consistedofthreelayers,aninputlayer,a hidden layerandanoutputlayer.Inputlayerusuallyreceivesthe input signal values. Neurons in output layer produce the outputsignal.Forpresentstudy,Multilayerperceptronback propagation feed forward neural networking model was used[8] The general procedurerequired to develop ANN diseasedetectionmodelwasasfollows(Fig.3).
Normalization of Data
Datanormalizationwasessentialtolimitthedatarange within0to1intervalbeforeanalyzingthedatausingANN. Data normalization ensured that the data series had
normalizedvaluecloserto0.5andwithin0to1range.The followingequationwasusedfornormalizingthedataset. Where, Xnorm=normalizedvalue, xi
originalvalue, xmax=maximumvalue
(MeanSquare Error)
Number of Nodes in Input layer
Thenumberofnodesininputlayerdependedonnumber of parameters under study. In present study, two input parameters,namely,temperaturedifferenceinhealthyand diseased area and grade assigned to the temperature differencewereusedasnodesininputlayersforanalysis.
Number of Nodes in Hidden layer
Threedifferentcombinationsofhiddenlayernodeswere performed 2, 4 and 6 to avoid the under-fitting and overfittingestimatewhilemodeltraining(Table4).
Table -4: No.ofNodesindifferentlayersofANNmodel architecture
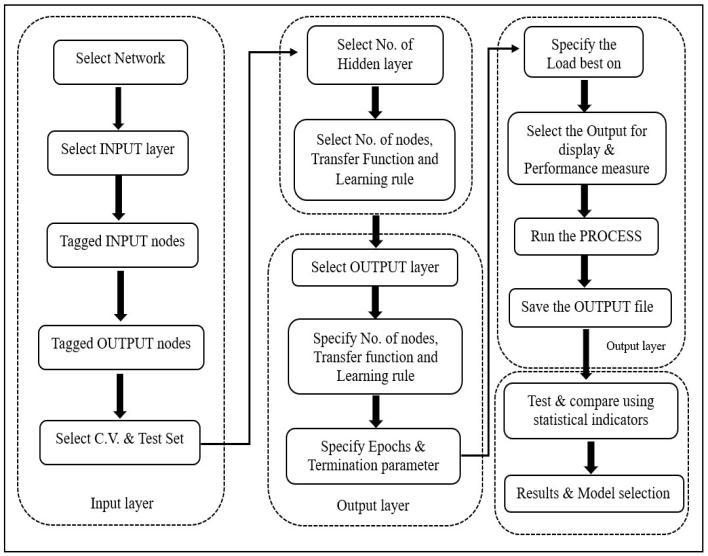
ANN architecture development involved creation of network topology and network training under various combinationsofnodesinhiddenlayers,numberofhidden layers,trainingcyclesandparametersof trainingfunction (Table 3). The performance of each combination was evaluatedonthebasisof statistical indicators.Thesimple architecture with less nodes i.e., less numerical load in traininggavebestresultsduringtesting.
Number of Hidden layers
Thenumberofhiddenlayersinthenetworkarchitecture dependsonthenon-linearityoffunctiontobelearned.One hiddenlayerwasenoughto createthemodel architecture andtrainthemodel[9].
Transfer Function
The Sigmoid Axon transfer function was utilized for limitingtheamplitudeofoutputtosomefinitevalues[8].
Number of Nodes in Output layer
The number of nodes in the output layer depended on numberoftargetvariables.Inpresentstudy,theoutputlayer hadasinglenodecorrespondingtotheGradeinwhichthe temperaturedifferencebelongs.
Number of Training Cycles (Epochs)
AllANNarchitecturesweretrainedat200,400,600,800 and 1000 epochs and with goal of mean squared error of 0.01duringbothtrainingandvalidation.
Learning Algorithm
Learningalgorithmoptimizederrorfunctioninorderto modifythelinkweight.Twotypesoflearningalgorithmsi.e., Levenberg-Marquardt learning algorithm (LM) [10] and Conjugate gradient decent learning algorithm (CDG) were employedinANNarchitecturedevelopmentfordetectionof LeafspotofGroundnut.
Performance Evaluation of ANN model
The performance evaluation of ANN models was done usingstatisticalanalysis.Theselectedstatisticalindicators wereasfollows.
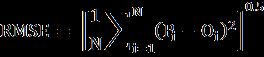
Root Mean Square Error (RMSE)
The root mean square error measured the average difference. Smaller the RMSE values, better the model performance.TheoptimumvalueforRMSEshouldbezero<
RMSE TheRMSErepresentedby
Where,
N=numberofObservations
P'i =Pi –Ō
O'i =Oi –Ō
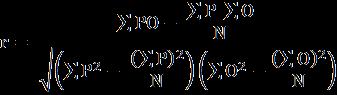
Coefficient of correlation (r)
The value of correlation coefficient, if greater than 0.9 showed high level of correlation and 0.5 showed low correlation and between 0.5-0.9 represented moderate correlation. The correlation coefficient (r) measured strengthoflinearrelationshipsbetweentwovariables.The correlationcoefficientwascalculatedusingequation
Where,
Pi=Predictedreferencetemperaturedifferencegradeforith observation
Oi=Targetedreferencetemperaturedifferencegradeforith observation
N=NumberofObservations
Mean Bias Error (MBE)
Themeanbiaserrorwasusedtomeasuremodelbias.It providedgeneralbiasnessbutnotaverageerrorthatcould be expected. The positive MBE value indicated overestimation and negative value indicated underestimation.Theabsolutevaluewasindicatorofmodel performance.Withtheoptimalvalueofzerothebiasnesslies between-∞to+∞(-∞<bias<+∞).TheMBEgivenby
3.6 Convolutional Neural Network model development on Teachable machine website
In teachable machine, three projects were available, Imageproject,AudioprojectandPoseproject.Outofthree projects image project was selected to create the imagebased detection model for leaf spot of groundnut. In the model,twoclasseswerecreatedasclass1infectedleafand class2ashealthyleaf.500RGBimagesofinfectedleafclass and healthy leaf class from the groundnut image dataset were uploaded manually using drag-drop method Three training parameters were needed to train the disease detection models. Batch size i.e., number of samples processedbeforemodelupdatedwassetto16,numberof epochsatwhichthemodelwasrunfortrainingwassetto50 and 0.001 learning rate was set. The process of model training was completed within 5 to 7 minutes. Firstly, the modelwasuploadedonlinetoconvertitinto“TensorFlow lite” format to download. After which the model link was createdanddownloadoptionarrived[11].
Developed Teachable Machine model link –“https://teachablemachine.withgoogle.com/models/X6J8sB ZJk/”
The equations used to calculate Accuracy, Recall, PrecisionandF1ScoreusingConfusionmatrixofteachable machine groundnut leaf spot detection model are given below.
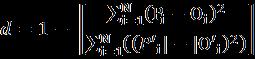
Index of Agreement (I.A)
Indexofagreementprovidesarelativemeasureoferror allowing cross comparison of the model. The model performance was good, when value of degree of index of agreement d > 0.95 with optimal value one. The index of agreementexpressedas
3.7 Android application development using Mobiroller website
Afreetrial accountwascreatedonMobirollerwebsite with one-month free trail programme using email-id and new application project was selected In the main control panel,thereweremorethefifteenoptionsavailabletoaddas applicationcontent.Threeapplicationcontentoptionswere selected viz.,websitelink,standardapplicationcontentand contactinformation.Thewebsitelinkcontentwasselected inwhichtheteachablemachinemodel links ofGroundnut diseasedetectionmodelwasuploaded.Instandardcontent optionthedetailedinformationaboutGroundnutleafspot diseasewasuploadedalongwithcausalorganism,symptoms andcontrolmeasureandrequiredcontactinformationwas mentioned in the contact content general application settingswereupdatedwithtextfont,size,andbackground imageetc AndroidPackageKit(APK)fileformatwasusedto generate the application and publication on Google Play Location, Storage, Microphone and Camera permissions were granted while generating the application After applicationgenerationthelinkwasforwardedtoregistered email-idfordownload
4. EXPERIMENTAL RESULTS
4.1 Artificial Neural Network Model based on Thermal images of groundnut leaf spot
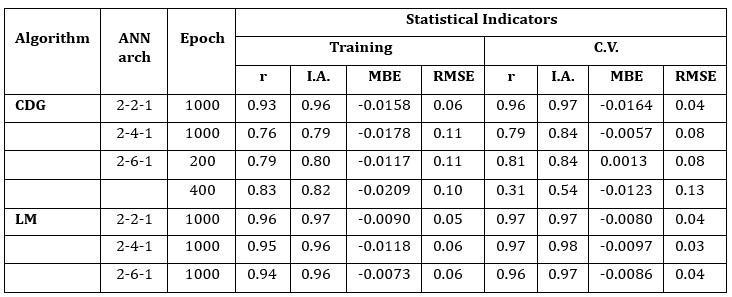
TheANNarchitecture2-2-1withLMalgorithmtrained with1000 epochs performedwell with r=0.96,I.A.=0.97, MBE= -0.0090 and RMSE= 0.05 for training and r= 0.97, I.A.=0.97,MBE=-0.0080andRMSE=0.04forcrossvalidation sets.Thecorrelationcoefficientwasmorethan0.9forboth training and cross validation sets with highest close agreement (i.e., 0.97 and 0.97) between the training and cross validation datasets. The MBE (MBE= -0.0090 &0.0080) and RMSE (RMSE = 0.05 and 0.04) showed very fever error in prediction of leaf spot of groundnut for trainingandcrossvalidationsets.
TheANNarchitecture2-4-1withLMalgorithmtrainedat 1000 epochs performed with r= 0.95, I.A.= 0.96, MBE=0.0118andRMSE=0.06for trainingsetandr=0.97,I.A.= 0.98,MBE=-0.0097andRMSE=0.03forcrossvalidationset. Thecorrelationcoefficientfortrainingandcrossvalidation
setwasmorethan0.95.TheI.A.indicatedcloseagreement betweentraining(0.96)andcrossvalidation(0.98)sets.The MBE of -0.0118; -0.0097 and RMSE of 0.06 and 0.03 indicatedveryerrorinpredictionofleafspotofgroundnut forbothtrainingandcrossvalidationsets.
The ANN architecture 2-6-1, with LM algorithm was developedforfivedifferentepochsi.e.,200,400,600,800 and 1000. The statistical indicators of 2-6-1 architecture withLMalgorithmtrainedat1000epochswerer=0.94,I.A.= 0.96,MBE=-0.0073andRMSE=0.06fortrainingsetandr= 0.96, I.A.=0.97, MBE= -0.0086, RMSE= 0.04 for cross validationset.Thesestatisticalindicatorsshowedthat2-6-1 architecture with LM algorithm trained at 1000 epochs performed better than other developed models with differentrangeofepochs.
The ANN architecture development for groundnut leaf spot detection also tested for Conjugate descent gradient learningalgorithm.Thedifferentarchitecturesi.e.,2-2-1,24-1and2-6-1at200,400,600,800and1000epochswere tested.
The2-2-1ANNarchitecturewithCDGlearningalgorithm was trained at different epochs and tested with statistical indicators.Thestatisticalindicatorsshowedthat,theANN architecture 2-2-1 with CDG algorithm trained at 1000 epochsperformedwellintermsofr=0.93,IA.=0.96,MBE=0.0158, RMSE=0.06 for training set and r= 0.96, I.A.=0.97, MBE=-.0164andRMSE=0.04forcrossvalidationset.The correlationcoefficientwasmorethan0.9forbothtraining (0.93) and cross validation (0.96) with high Index of Agreement (I.A.) between both training (0.96) and cross validation (0.97) sets. The MBE and RMSE indicated less errorinpredictionofleafspotofgroundnutforbothtraining (MBE=-0.0158andRMSE=0.06)andcrossvalidation(MBE= -0.0164andRMSE=0.04)sets.
The 2-4-1 architectures with CDG learning algorithm trainedatdifferentepochs(i.e.,200,400,600,800and100) the2-4-1architecturewithCDGtrainedat1000epochswas suitablebasedonstatisticalindicators.Thetrainingdataset showed correlation coefficient of 0.76, I.A.= 0.79, MBE=0.0178andRMSE=0.11.thecorrelationcoefficientforcross validationset was0.79with 0.84I.A.,MBE= -0.00057and RMSE=0.08.Thestatisticalindicatorsforbothtrainingand crossvalidationshowedcloseagreementwithlesserrorin predictionofleafspotofgroundnutwithfieldobservations
TheANN2-6-1architecturewithCDGalgorithmat200 epochs performed well with r= 0.79, I.A.= 0.80, MBE=0.0117andRMSE=0.11fortrainingsetandr=0.81,I.A.=0.84, MBE=0.0013andRMSE=0.08forcrossvalidationset.The statisticalindicatorsfor2-6-1architecturewithCDGtrained at200epochswereatparwiththesamearchitectureat400 epochs.ThecorrelationcoefficientandI.A. valuesof2-6-1 architecturewithCDGalgorithmtrainedat400epochswere increasedto0.83and0.82fortraininganddecreasedto0.31
and 0.54 for cross validation sets. Increase in error was observedforbothtrainingandcrossvalidationsetsfor2-6-1 architecturewithCDGalgorithmtrainedat400epochs.
Thestatisticalanalysisresultsofselectedbest2-2-1,2-41 and 2-6-1 ANN architectures trained with two learning algorithms and five different combinations of epochs for groundnutleafspotdetectionpresentedinTable5
Table -5: BestANNarchitectureobservedfromthe performedANNarchitecturecombinationsforgroundnut leafspotdiseasedetection
all diseased and healthy leaf samples tested 98% samples wereclassifiedcorrectlywith97%precision.F1Scorefor groundnut disease detection model was 97% which consideredbothprecisionandrecallandaccountedforboth false positive and false negative values. In calculation of accuracyonlytrue positive andtrue negative valueswere considered.PatilandNagpure[7]foundsimilarresultsfor teachable machine model developed for detection of northerncornleafblight98%accuracyat50epochs.
4.2 Teachable machine model and android application for detection of leaf spot of groundnut
Gowrishankar and Prabha [6] developed ANN model usingGLCMtechniquetoanalyzeleafspotofgroundnut.The accuracyoftheANNsystemwas98%superiorsimilartothe results achieved using proposed ANN model with two learningalgorithms.
Teachablemachinediseasedetectionmodelresultswere calculated using confusion matrix to record accuracy, precision, specificity and F1 score of Groundnut leaf spot detection model. Confusion matrix was used to describe modelperformance.Eachrowofthematrixrepresentedthe instants in actual class and each column represented instancesinpredictedclass.
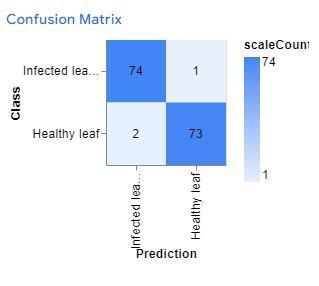
Basic terminology was used in confusion matrix were truepositive,truenegative,falsepositiveandfalsenegative. When the disease class was predicted correctly it was consideredtruepositive,ifthemodelpredictednodisease i.e.,healthyandtherewasnodiseaseonleafthenitwastrue negative,whenthemodelpredicteddiseaseclassandifthere was no disease then it was false positive, similarly if the model predicted no disease i.e., healthy then it was consideredatfalsenegative Fig.4representstheconfusion matrixofGroundnutleafspotdetectionmodel.
Groundnutdiseasedetectionmodelperformedwellwith 98%accuracywith98%recalland97%precisioni.e.,outof
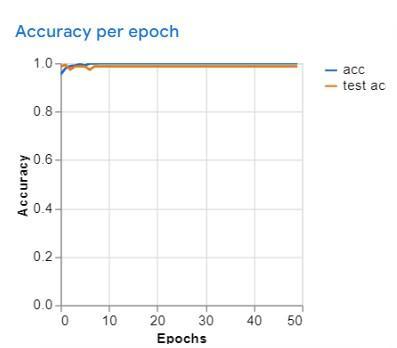
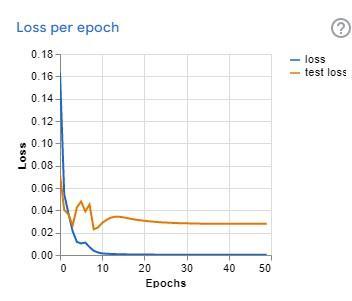
The gap between training and testing accuracy in accuracycurvewasverylow(Fig.5),sotherewerenoissues of model over fitting and concluded as the model learned correctly.LosswascalculatedateachepochshowedinFig6 Thelossattrainingwaslowinbeginninganddecreasedas thenumberofepochsincreased.
4. CONCLUSIONS
In the proposed work, the developed ANN and CNN modelsforgroundnutleafspotdiseasedetectionperformed verywellascomparedtotheexistingplantdiseasedetection techniquesdevelopedusingmachinelearning.Thiswillhelp inearlydetectionofgroundnutleafspotdisease Therefore, the disease management practices can be effectively forewarnedtothefarmerstherebyreducingthelossesdue togroundnutleafspotdiseaseineconomicalandecofriendly manner.
REFERENCES
[1] B.Waghmode,KambleA.,NavhaleV.andMahadkarU, “Groundnutresearchinkonkan:Anewlook”,Adv.agric. res.technol.j,Vol.1,Issue2,July2017.
[2] Rathod P.S, Deshmukh A. G. and Shinde K. R., “Managementofleafspot(Cercospora arachidicola and Cercosporidium personatum) disease of groundnut by using various test of fungicides”, IJCS, Vol. 7, Issue 5, 2019.
[3] SinghU.P.,ChouhanS.S.,JainSandJainS.,“Multilayer Convolution Neural Network for the Classification of MangoLeavesInfectedbyAnthracnoseDisease”,IEEE, Vol.7,2019
[4] Tiwari S, Kumar N, Pramanik A, Joshi E, Sasode D, SikarwarR S,TomarR S,TripathiM K,KandalkarV S andSinghA K, “Breedingforfoliardiseaseresistancein groundnut using conventional and molecular approaches” , Proceedings of National Conference on Current trendsinplantscienceandmolecularbiology forfoodsecurityandclimateresilientagriculture2018.
[5] Kumar S. and Sowrirajan S., “Automatic leaf disease detection and classification using hybrid features and supervised classifier”, IJAREEIE, Vol. 5, Issue 6, June 2016
[6] GowrishankarK.andPrabhaL.,“Diagnosisofgroundnut plant leaf disease using threshold-based color segmentationandartificialneuralnetwork”,IJERT,Vol 8,Issue3,2020.
[7] PatilL.andNagpureT.,“Detectionofnorthernleafblight ofmaize basedon teachable machine(AI)”AgriCos eNewsletter,Vol.3,Issue8,2022.
[8] PujariJ.D.,YakkundimathR.andByadgiA.,“Recognition and Classification of Produce Affected by Identically LookingPowderyMildewDisease” ,Acta Technologica Agriculturae,2014.
[9] DeviK.S.,SrinivasanP.andBandhopadhyayS.,“H2K–A Robust and Optimum approach for detection and classificationofGroundnutLeafDiseases” ,Computers andElectronicsinAgriculture,Vol.178,2020.
[10] Shivling V. D., Ghanshyam C., Kumar R., Kumar S., Sharma R., Kumar D., Sharma A. and Sharma S. K., “Prediction Model for Predicting Powdery Mildew usingANNforMedicinalPlant Picrorhiza kurrooa”
[11] MathewM.andThereseY.M.,“ObjectDetectionBased onTeachableMachine”,JVDSP,Vol.7,Issue2,May2021.