TURBIDITY MEASUREMENT USING NIR DIGITAL CAMERAS AND GOOGLE EARTH ENGINE: A review
 Yogesh Kunkawalekar, Milind Bharambe, Sanjyot Patil, Asiya Shaikh, Prof. A. S. Hambarde
(KJ
College of Engineering and Management Research, Pune)Abstract - In this study, a turbidity measuring device will be developed using NIR (Near Infrared) light and image-processing software. When the NIR light travels through the turbid solution, the NIR camera captures scattered and transmitted images. The RGB values are obtained from the corresponding image. Then, these RGB valuesareconvertedtoLabvalues.Thestandardturbidity value is calculated by feeding these Lab values into a neuralnetwork.
In the second part of the study, Google Earth Engine is being used to calculate turbidity. Sentinel-2 is a satellite that has a multispectral instrument that measures reflected light in different wavelengths, including visible andnear-infrared.TheB4,B3,andB2bandscorrespondto red, green, and blue, respectively, and can be combined to form an RGB image. The NDWI and NDTI are two indices thatareusedtoestimateturbidityfromSentinel-2images. NDWI is sensitive to the presence of water, and NDTI is sensitivetochangesinthe optical propertiesof thewater. Chlorophyll is a pigment that is present in algae and is used as an indicator of the presence of suspended particles.
By comparing the predictive performance of different bands and indices, specific bands can be selected to train the algorithm to accurately predict turbidity. The use of satellitedatahastheadvantageofbeingabletocoverlarge spatial areas, which is particularly useful for environmentalmonitoringapplications.
Keywords: Machine Learning, Google Earth Engine, Water Quality Monitoring, IOT, Turbidity sensor, RGB values.
1.INTRODUCTION
Waterisavitalresourcethatisusedforvariouspurposes, including drinking, agriculture, and industrial processes. However, water can contain suspended and colloidal materials, such as soil, dirt, microorganisms, and zooplankton,thatcanmakethewaterturbid.Turbidityisa measureofthedegreetowhichthewateriscloudyorhazy due to the presence of undissolved particles. Turbidity is considered a direct indicator of water quality, and its measurement is important in assessing the suitability of water for various uses. Excessive turbidity can have negativeimpactsonaquaticecosystemsandhumanhealth.
Forinstance,highturbiditycanreducetheamountoflight thatpenetratesthewater,whichcanhindertheprocessof photosynthesis in aquatic plants and impact their growth. Moreover, high turbidity can affect the storage capacity of waterreservoirs,whichcanleadtowatershortagesduring periodsofhighdemand.Therefore,itisessentialforwater quality control departments to accurately measure water turbidity and keep it within a reasonable range that does not adversely affect the ecological balance and human health.
Turbidity is a measurement that isused toevaluate a liquid'soverallclarity.Itisameasurementoftheamountof light scattered by the elements of water when light shines through a water sample. It is an optical property of water. Theturbidityincreaseswiththeintensityofscatteredlight.
When there are more suspended solids in the water, it appears murkier and has a higher turbidity The World Health Organization (WHO) has established guidelines for drinking water quality, which include a recommendation that the turbidity of drinking water should not be more than5nephelometricturbidityunits(NTU),andpreferably less than 1 NTU. This recommendation is since high turbidity levels can indicate the presence of suspended solids, microorganisms, and other impurities in the water thatcanbeharmfultohumanhealth.
The waterseems murkier and hasa higher turbidity when therearemoreoverallsuspendedsolidspresent.Turbidity istakenintoconsiderationasa terrific measureofthefine of water. The WHO (global fitness company) establishes that the turbidity of ingesting water should not be extra than5NTUandshouldpreferablybeunderneath1NTU.
There are several methods for measuring turbidity, including visual turbidity, transmission light, scattering light, and ratio methods. These methods are solely dependentonopticaltechniques,meaningtheyuselightto measuretheturbidityofwater.
Visual turbidity is a method of measuring turbidity by visually comparing a water sample to standard reference tubes of known turbidity. This method has poor accuracy and is only suitable for making hard judgments of water turbidity. The transmissionlight,scatteringlight,andratio techniques that have been based at the photoelectric detection had been evolved and have been applied to measuretheturbidity.
Volume: 10 Issue: 02 | Feb 2023
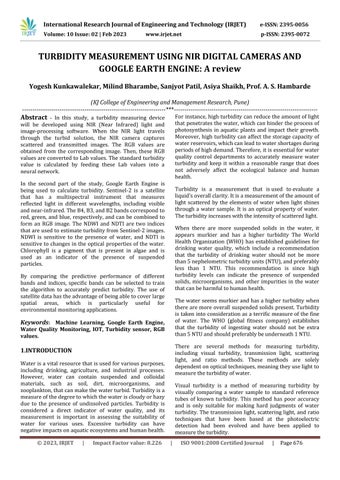
In this have a look at, a low-cost device was developed to measure turbidity using near-infrared (NIR) cameras. The device captured both transmitted and scattered light images of NIR light passing through a turbid solution. Theseimageswerethenprocessedusingimageprocessing techniquestoobtaintheRGBvalues.TheRGBvalueswere used to quantify the degree of turbidity in the solution. This simple and cost-effective method has potential applications in water quality monitoring and other fields whereturbiditymeasurementisnecessary.
2. Related work
In container One detector for incident light, positioned at 90° angle of light source (LED), is used to measure the intensityofscatteredlight,andanotherdetector,at180°,is usedtomeasuretheintensityoftransmittedlight.Because the transmission and scattering light have the same transmission medium, the influence of the change in watercolorandlightsourceonturbidityisthesame.Then, theCIE Labandthegrayscalevaluesof thesolutionimage areobtainedbyRGBvalues.WeImplementmultiplelinear regressionon
(a) Relationship in the ratio of scattering to transmissionmode.
(b) Relationship in the ratio of transmission to scatteringmode,tocreatemodel.
Two NIR cameras with the same type were used in the experiment. Both are 850 nm narrow band filters combined with ordinary CMOS cameras. The 850nm narrow-band filter with a focal length of 3.6 mm can effectively eliminate the influence of other wavelengths andimprovethesensitivity.
3. Study of Research Paper
In this paper [1], author proposes a new method for measuringwaterturbidityusingtwoNIRdigitalcameras.
The proposed method uses an NIR camera-based measuring device with image processing software. Two NIR cameras capture scattered and transmitted images when the NIR light passes through a turbid solution. The average RGB values of 400 pixels in the central region of the image are obtained and converted into CIE Lab color space values. The relationship between turbidity and the corresponding color components (R, G, B, L, a, b, and grayscale)isthenusedtodeterminewaterturbidity.
Theresultsofcomparisonwithacommercialturbidimeter show that the proposed method has a high accuracy for determining standard solution with a wider linear range. Additionally, the proposed method is consistent with turbidimeter results for measuring real samples, which verifiesthefeasibilityofthismethod.
The proposed method offers several advantages over traditional methods. It is quick and accurate and does not requireanyspecializedequipment.Additionally,theuseof NIR cameras allows for real-time measurements. The proposed method also has a wider linear range compared to traditional turbidity measurement methods, making it suitableforawiderrangeofapplications.
In conclusion, the proposed method of using two NIR digital cameras for water turbidity measurement offers a promising alternative to traditional methods. Further researchisneededtofullyunderstandthecapabilitiesand limitations of this method and to evaluate its potential for widespreaduseinvariousindustries.
This study [2] paper proposes a method using a digital camera combined with a fitting algorithm and T-S fuzzy neural network (T-S fnn) to measure water turbidity accuratelyandefficiently.
The proposed method involves using a turbiditymeasuringdeviceandimage-processingsoftwarebasedon a common camera to obtain the image of a standard solution. After passing a constant light source through the sample, the RGB and Lab values corresponding to the image are obtained. These RGB values are used as the inputforthefuzzyneuralnetworkpredictionmodel,while the corresponding standard turbidity values serve as the output. The camera-based fuzzy neural network turbidity measurementmethodisthenestablished.
Additionally,astandardcurveofturbiditymeasurementis establishedbyfittingtheturbidityusingcolorcomponents and color difference. The proposed method is applied to the measurement of standard turbidity solution, and the results are compared with those obtained using a turbidimeter. The accuracy of the fuzzy neural network and the fitting algorithm is higher than that of the turbidimeter, with the fuzzy neural network method exhibitingthehighestaccuracy,withameasurementerror ofonly±0.89%.
International Research Journal of Engineering and Technology (IRJET) e-ISSN: 2395-0056
Volume: 10 Issue: 02 | Feb 2023 www.irjet.net
The proposed method is compared to the traditional photoelectric detection method using independent sample t-tests on actual water samples. The fuzzy neural network methodexhibitedthesametrendastheturbidimeter,with no significant differences in the results. This suggests that the camera-T-S fuzzy neural network assembly can be appliedtomeasureturbidityinactualwatersamples.
The proposed method offers several advantages over traditional methods, including reduced measurement errors and costs. It may be useful in various fields, includingenvironmentaldetectionandbiomedicine.
Inconclusion,theproposedmethodusingadigitalcamera combined with fitting algorithm and T-S fuzzy neural network is a promising alternative to traditional turbidity measurementmethods.Furtherresearchisneededtofully understand the capabilities and limitations of this method andtoevaluateitspotentialforwidespreaduseinvarious industries.
Inthisresearch[3],authorsdiscoveredthatwithaview to degree the chromaticity of water and the content material of dissolved count number greater accurately, efficiently,andaffordably,achromaticitysizegadgetbased ontheimagetechniquebecameproposedandapplied.The dimension gadget used the designed acquisition tool and image processing software to acquire the Red-Green-Blue (RGB) values of the picture and converted the color photo from RGB coloration area to Hue-Saturation-depth (HSI) area to separate the chromaticity and brightness. In keeping with the definition of chromaticity, the hue (H), saturation (S) values, and chromaticity of preferred chromaticity answer pix have been outfitted through a non-linearfloor,andathree-dimensionalchromaticitysize model wasinstalledprimarilybasedontheHandSvalues of water snap shots. The proposed method outperforms spectrophotometryintermsofaccuracywhenmeasuringa standard chromaticity solution. For real water pattern measurements,thereisnofull-sizedistinctionbetweenthe outcomes of this approach and the spectrophotometer technique, which tested the validity of the approach. By establishing a correlation between the chromaticity value and the peak area of the absorption spectrum or the absorbance value of a standard chromaticity solution at a specific wavelength, a spectrophotometer is used to determine the chromaticity value of water samples. Also, with successful results, the system was used to gauge the presenceofammonia,nitrogen,phosphate,andchloridein water.
Authors [4] of this project aim to improve the process of measuring turbidity in water samples by introducing a new method that uses photo processing. Turbidity is a measure of how clear or cloudy the water is and is an important indicator of water quality. Traditionally, turbidity detection involves manual approaches that are
characterized by long calibration times, frequent errors, andlowerrepeatability.
The proposed method involves capturing water sample imagesusinga high-definitioncamera and applyingimage processing techniques to represent the samples with differentlevelsofturbidity.Adatabaseiscreatedforwater samples with varying levels of turbidity using laboratory methodsofturbiditymeasurement.Thisnewapproachcan be used anywhere and at any time in the world wherever photo processing techniques are used for turbidity detection.
The image processing results are compared with the informationinthedatabasetoprovidedirectandaccurate turbidity measurement in a fraction of seconds. This new methodofturbiditydetectionhasthepotentialtoimprove the accuracy and efficiency of water quality testing, which is essential for ensuring the safety of drinking water and protecting the environment. Additionally, this method can beappliedina varietyofsettings,includingindustrial and municipal water treatment facilities, environmental monitoring,andresearchlaboratories.
Authors [5] aim to address the problem of contaminated potable water in many parts of the world by developing a systemthat candetectand monitor various parameters of waterquality,suchaspHlevel,temperature,andturbidity.
The first step in preventing water pollution is to identify thepollutant,andthissystemwouldfacilitatethatprocess by providing real-time monitoring and analysis of water parameters. The system would utilize low-cost sensors to control and monitor these parameters, making it more accessibletopeopleinareaswithlimitedresources.
To implement this system, the authors plan to use an Arduino UNO microcontroller board and interface it with LabVIEW software, which is a graphical programming language used for data acquisition, analysis, and visualization. This would allow for easy control and monitoring of the water parameters using a computer or otherdevice.
By developing this low-cost and accessible water quality monitoring system, the authors hope to help improve accesstocleanandsafedrinkingwaterinareaswhereitis currentlyaproblem.Thissystemcouldbeusedinavariety of settings, including homes, schools, and community centers, as well as in larger-scale applications such as watertreatmentfacilitiesandenvironmentalmonitoring.
This study [6] describes the development of a mobile application called HydroColor that uses a phone's camera and auxiliary sensors to measure the remote sensing reflectance of natural water bodies. The app utilizes the phone'scamera asathree-bandradiometer,andusersare directed by the app to capture a series of three images to
International Research Journal of Engineering and Technology
Volume: 10 Issue: 02 | Feb 2023 www.irjet.net
calculate the remote sensing reflectance in the red, green, andbluewavelengthbands.
The reflectance data can be inverted to estimate the concentration of absorbing and scattering substances in thewater,includingsuspendedsediment,chlorophyll,and dissolved organic matter. This approach is similar to satellitemeasurements,butHydroColordistinguishesitself from other water quality camera methods by using radiometricmeasurementsratherthanphotocolor.
The study investigates the accuracy of HydroColor's reflectance and turbidity estimates compared to commercial instruments. The results show that HydroColor can measure the remote sensing reflectance within26%ofaprecisionradiometerandturbiditywithin 24% of a portable turbidimeter. This demonstrates that HydroColor can provide reliable water quality data, even withoutexpensiveorspecializedequipment.
OneoftheadvantagesofHydroColoristhatitusesaphone as an objective sensor rather than relying on subjective user observations or color matching using the human eye. This makes it a powerful tool for crowd sourcing aquatic optical data, as it allows users to easily collect and share waterqualitydata.
In summary, the HydroColor app represents a new and innovative approach to monitoring water quality using mobile technology. By leveraging the capabilities of a phone's camera and auxiliary sensors, HydroColor provides an accessible and low-cost method for collecting reliablewaterqualitydata,whichcanbeusedforavariety of applications, including environmental monitoring, research,andeducation.
Nowadays[7]anewconceptofaLabonacellphone(LOS) wheremultiplelaboratoryfunctionscanbeconductedona portable phone. The LOS concept was demonstrated for real-timeandon-sitewaterqualitydetectionusingtheopt electrowetting (OEW) principle. In addition to the on-chip automated sample processing capability, the LOS used a phonecameraformicroscopicdetectionoftargetcells.
TheLOSplatformcanovercometraditionallabor-intensive andtime-consumingmethodsfordetectingmicrobiological contaminantsandaquaticenvironments.Withcomparable fluorescence images and cell counting function, the LOS can provide a faster and more efficient method for water qualitymonitoring.
The OEW principle used in the LOS device involves manipulating the movement of droplets of liquid by applying a voltage to electrodes. The droplet movement is used to mix the sample and reagents, and the resulting mixture is analyzed using a fluorescence microscope. The LOS platform can detect various contaminants, including
2395-0072
Escherichia coli and Legionella pneumophila, with high accuracyandsensitivity.
OneofthesignificantadvantagesoftheLOSplatformisits portability and convenience. It can be easily carried in the field, allowing for on-site water quality monitoring and testing. The use of a phone camera for microscopic detectionalsoeliminatestheneedforexpensiveandbulky equipment, making it an affordable and accessible option forwaterqualitymonitoringinresource-limitedsettings.
Insummary,theLOSplatformoffersanewandinnovative approach to water quality monitoring using a portable phone.Bycombiningmultiplelaboratoryfunctionsandthe useoftheOEWprinciple,theLOSplatformprovidesafast, accurate, and convenient method for on-site water quality testing.Thishassignificantimplicationsforenvironmental monitoring, public health, and water resource management.
In this study [8], the authors propose a water quality assessment method using image processing techniques. They use two common biological organisms, Daphnia magna and Lemna minor, which are sensitive to water toxicity, to determine the water quality. The proposed approach involves the use of two cameras to continuously scan these two organisms in separate vessels, and the images captured are then processed independently. The authors use techniques for color-area analysis, motion analysis,andtransformationintheimageprocessingstage.
Inthecolor-areaanalysisstage,thecoloroftheorganisms is analyzed and compared to a reference image to determine any color changes. The motion analysis stage involves tracking the movement of the organisms, which canindicatechangesintheirbehaviorduetowaterquality. The transformation stage involves morphological operations, such as erosion and dilation, to remove noise andenhancethefeaturesoftheorganisms.
Finally, a relative water quality index is computed based on the extracted features from the obtained images. The indexprovidesaquantitativemeasureofthewaterquality based on the color, motion, and morphology of the organisms. The proposed approach offers a fast, automated, and non-invasive method for water quality assessment using image processing techniques, which can complement traditional methods and provide additional insightsintowaterquality.
This article [9] proposes a Water pollution has been a growing problem over the previous couple of years. Personal pride in water may be a standout amongst those primaryvariableswithcontrolwellnessandthenationfor sicknesses "round kinfolk what’s greater animals. Lakes and waterways could be those essential wellsprings for consuming water, which impressively depend on upon water private pride (refers of the bodily, chemical, what's
greater dwelling elements about water). The objective of this water high-quality monitoring machine for the usage of internet of factors is to discover the first-class of the water i.e. how the pH content material varies and sending message tothecorrespondingauthorities.Wearegoing to put this undertaking into effect at municipal water tanks and drinking water reservoir. For that we are using an Arduino board for locating pH value and GSM module for message technique. We use a led show to have non-stop observation on water parameters. Eventually the person getsamessageofpHfeeofwatersimilarlyweamplifythis undertakingbymeansofsendingthesensorinformationto cloudforglobaltrackingofwaterhigh-quality.
This article [10] proposes a low-cost system for real-time water quality monitoring and control using IoT. The authors argue that water is a prerequisite element required for humans, and therefore, there must be mechanisms in place to vigorously test the quality of drinking water in real time. To address this issue, the authors developed a system that utilizes physiochemical sensors to measure the physical and chemical parameters of water, such as temperature, turbidity, conductivity, pH, andflow.
The system can detect water contaminants using these sensors, and the sensor values are processed by a Raspberry Pi and sent to the cloud. The sensed data is visibleonthecloudusingcloudcomputing,andtheflowof waterinthepipelineiscontrolledthroughIoT.Thisallows for real-time monitoring and control of water quality, which can help to prevent the consumption of contaminated water and the spread of water-borne diseases.
The use of IoT technology makes the system highly scalableandcost-effective.Byimplementingthissystem,it is possible to ensure that the quality of drinking water always meets the required standards. This system can be deployed in various settings, such as households, industries,andmunicipalwatersystems,toensurethatthe waterissafeforhumanconsumption.
Authors [11] aim to address the problem of Sentinel2A/MSI (S2A) and Landsat-8/OLI (L8) data products present a new frontier for the assessment and retrieval of optically active water quality parameters including chlorophyll-a (Chl-a), suspended particulate matter (TSS), and turbidity in reservoirs. However, because of their differencesinspatialandspectralsamplings,itiscriticalto evaluate how well the sensors are suited for the seamless generation of the water quality parameters (WQPs). This study presents results from the retrieval of the WQP in a reservoir from L8 and S2A optical sensors, after atmospheric correction and standardization through band adjustment. An empirical multivariate regression model (EMRM) algorithmic approach is proposed for the estimation of the water quality parameters in correlation
with in situ laboratory measurements. From the results, both sensors estimated Chl-a concentrations with R2 of greaterthan70%fromthevisiblegreenbandforL8anda combinationofgreenandSWIR-1bandsforS2A.Whilethe NMSE% was nearly the same for both sensors in Chl-a estimation, the RMSE was <10 μg/L and >10 μg/L for L8 and S2A estimations of Chl-a, respectively. For TSS retrieval, L8 outperformed S2A by 31% in accuracy with R2>0:9fromL8’sred,blue, and green bands, as compared to 0:47 ≤ R2 ≥ 0:61 from S2A’sredandNIRbands.TheRMSEwerethesameasfor Chl-a, and the NMSE% were both in the same range. Both sensors retrieved turbidity with high and nearly equal accuracyofR2>70%fromthevisibleandNIRbands,with equal RMSE at <10% NTU and NMAE% from S2A being higher by more than 30% as compared to L8’s NMAE% at 15%. The study concluded that the higher performance accuracyofL8isattributedtoitshigher
SNR and spectral bandwidth placement as compared to S2A bands. Comparatively, S2A overestimated Chl-a and turbidity but performed equally well compared to OLI in theestimationofTSS.Theresultsshowthatwhileabsolute accuracy of retrieval of the WQPs still requires improvements, the developed algorithms are broadly able todiscernthebioopticalwaterqualityinreservoirs.
Inthis paper[12],westudiedthat River turbidity,serving as an important evaluation index for monitoring water contamination and guiding pollution control, is mainly measured based on the data gathered from contacting turbidity sensors or contactless space satellites. Nevertheless,theprevalenceofthoseabovementionedtwo measurementsisstronglylimitedduetothedisadvantages of low-density spatial distribution of sensor data and extremely high price of satellite data. To solve such difficulty,dependingontheGoogleearthengine(GEE)that freely supplies hyperspectral remote sensing data, in this article, we propose a novel river turbidity measurement model based on random forest ensemble. First, by fully taking advantage of each spectral information and their tuned spectral information, a newly proposed full combination subspace is deployed to generate all the possible base random forests. Second, we introduce a novel error-minimization-based pruning algorithm to circularly delete poor base random forests in accordance with the dynamic threshold. Finally, a weighted average method solved by regularized linear regression is used to aggregate the entire remainder base random forests that are preserved after pruning, thereby yielding the final measurement result of river turbidity. Experiments corroborate the superiority of our proposed model over state-of-the-art competitors and its simplified counterparts.
International Research Journal of Engineering and Technology (IRJET) e-ISSN: 2395-0056
Volume: 10 Issue: 02 | Feb 2023 www.irjet.net
4. OPEN ISSUES
Aswestudiedthatatpresent,thereislackofacentralized system for water quality monitoring in India. It implies that there is no platform available for people to interact withandmonitorthequalityofwatertheyareconsuming. The research on water quality is limited to dams and conducted in laboratory settings. This approach requires significanthumaneffort,lacksautomation,andincurshigh costs,makingitapplicableonlyonasmallscale.
Withoutacentralizedsystem,itbecomesdifficulttoensure that people are consuming safe and clean water. The lack of automation and dependence on manual labor can also resultindelaysindetectingwaterqualityissues,whichcan further lead to health problems. A centralized system can help to address these challenges by providing real-time monitoring, enabling rapid detection of water quality issues, and allowing for timely interventions. It can also provide a platform for people to interact with and access information about the quality of the water they are consuming,empoweringthemtomakeinformeddecisions abouttheirhealth
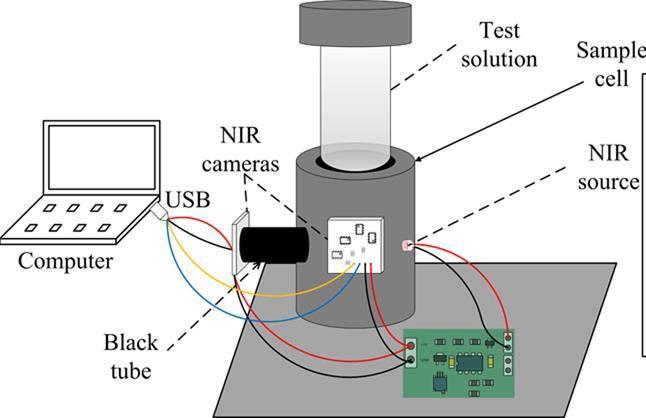
5. SYSTEM ARCHITECTURE
User - A user is a person who utilizes a computer or network service. A user often has a user account and is identified to the system by a username. Other terms for username include login name, screenname, account name, nickname and handle, which is derived from the identical citizens band radio term. Somesoftware products provide services to other systems and have no direct end users. User accesses user interface and accesses turbidity data throughit.
6. METHODOLOGY
Turbidity measurement using NIR digital cameras and Google Earth Engine involves several steps, including image acquisition, processing, and analysis, as well as calibration and validation. Here is a possible methodology forthisapproach:
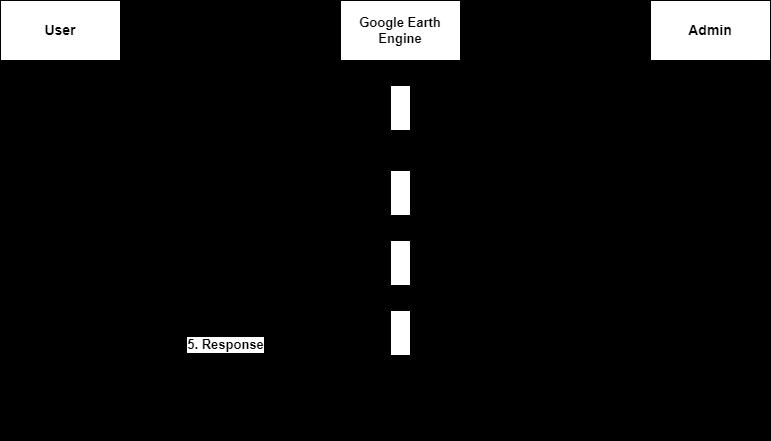
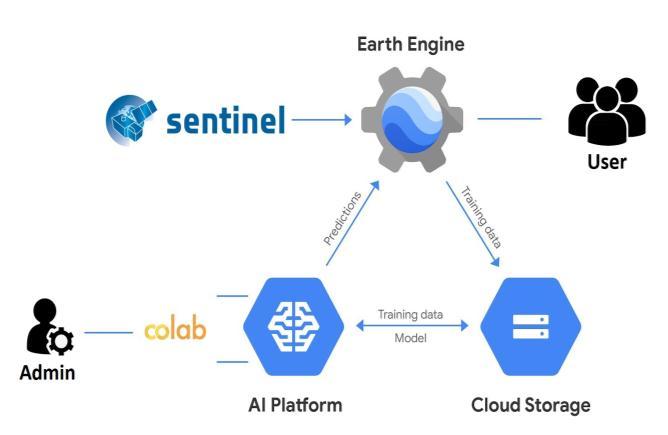
Admin
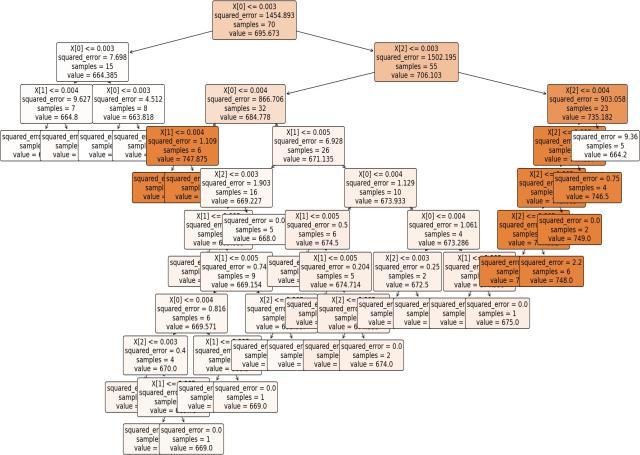
Admin in the system uses various software tools likeGoogleCollabtoaccessmachinelearningmodelssuch asmultiplelinearregressionandrandomforestregressor.
Google Earth Engine - Google Earth Engine is a cloud computing platform for processing satellite imagery and other Earth observation data. It provides access to a large warehouse of satellite imagery and the computational power needed to analyze those images. The platform was developed by Google, in partnership with Carnegie Mellon University, NASA, the United States Geological Survey and TIME. Google Earth Engine interface is accessed by admin to train machine learning models and user uses these modelsingoogle earth engine toaccessaccurate turbidity data.
1. Image acquisition: The first step in the methodology is to acquire NIR digital images of the water body to be analyzed. This can be done using various types of cameras, such as drones or satellites.Theimagesshouldcovertheentirebody of water or a representative portion of it and should be acquired under similar lighting conditions and at the same time of day to minimizetheeffectofchanginglightconditionson themeasurements.
2. Image preprocessing: The acquired images may containvarioustypesofnoiseandartifacts,which can affect the accuracy of the turbidity measurements. Therefore, the images need to be preprocessed to remove these unwanted elements. The preprocessing can include tasks such as image normalization, filtering, and segmentation.
3. Feature extraction: Once the images have been preprocessed, the next step is to extract features related to turbidity from the images. This can be done using various image processing techniques, such as texture analysis, color analysis, and machine learning. The extracted features may
include the average pixel intensity, the standard deviation of pixel intensity, the texture of the image,andthecolorofthewater.
4. Calibration: In order to establish a relationship between the extracted features and the actual turbidityvalues,acalibrationprocessisnecessary. This involves taking actual turbidity measurements at different points in the water body and correlating these measurements with thecorrespondingvaluesoftheextractedfeatures. Thiscalibrationprocesscanbedoneusingvarious statistical methods, such as linear regression or machinelearningalgorithms.
5. Turbidity measurement: Once the calibration hasbeencompleted,the extractedfeaturescanbe used to estimate the turbidity values at different points in the body of water. This can be done by applying the calibration model to the features extracted from the NIR images. The output of this process is a map of turbidity levels in the water body.
6. Validation: To ensure the accuracy of the measurements, it is necessary to validate the results against actual turbidity measurements taken at different points in the water body. The validationcanbedonebycomparingthepredicted turbidity values with the actual measurements and evaluating the accuracy of the model using statistical metrics such as mean absolute error or rootmeansquareerror.
7. Analysis and visualization:
RANDOM FORREST REGRESSOR –
RANDOM FOREST IS A FAMOUS MACHINE LEARNING
ALGORITHM THAT USES SUPERVISED LEARNING
METHODS YOU CAN APPLY IT TO BOTH CLASSIFICATION
AND REGRESSION PROBLEMS IT IS BASED ON ENSEMBLE
LEARNING, WHICH INTEGRATES MULTIPLE CLASSIFIERS
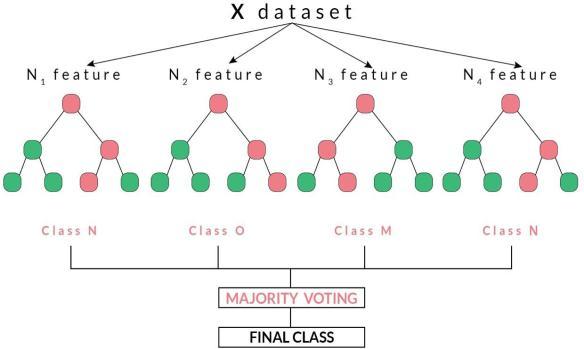
TO SOLVE A COMPLEX ISSUE AND INCREASES THE
MODEL'SPERFORMANCE
CLASSIFICATION ALGORITHMS IN DATA SCIENCE INCLUDE LOGISTICREGRESSION,SUPPORTVECTORMACHINES, NAIVE
BAYES CLASSIFIERS, AND DECISION TREES ON THE OTHER HAND, THE RANDOM FOREST CLASSIFIER IS NEAR THE TOP OF THE CLASSIFIER HIERARCHY.
The following steps can be used to demonstrate theworkingprocess:
Step 1: Pick M data points at random from the trainingset.
Step 2: Create decision trees for your chosen data points(Subsets).
Step 3: Each decision tree will produce a result. Analyzeit.
Step 4: For classification and regression, accordingly, the final output is based on Majority VotingorAveraging,accordingly.
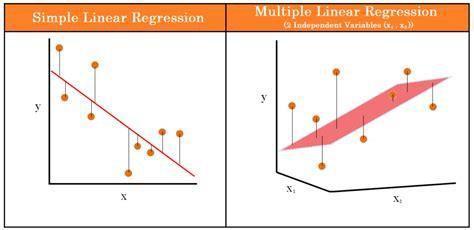
Multiple Linear Regression –
Regression models are used to describe relationshipsbetweenvariablesbyfittingalineto the observed data. Regression allows you to estimatehowadependentvariablechangesasthe independentvariable(s)change.
Multiple linear regression is used to estimate the relationship between two or more independent variablesandonedependentvariable.Youcanuse multiple linear regression when you want to know:
How strong the relationship is between two or more independent variables and one dependent variable (e.g., how rainfall, temperature, and amountoffertilizeraddedaffectcropgrowth).
The value of the dependent variable at a certain value of the independent variables (e.g., the
expectedyieldofacropatcertainlevelsofrainfall, temperature,andfertilizeraddition).
yi=β0+β1xi1+β2xi2+...+βpxip+ϵw
This research concept might be expanded in the future to be executed using Smartphone cameras and without lab conditionenvironment.Itcanalsobeusedinthefuture to find Drinkable Water Quality using other IOT based products/sensors
Where:
• yiisthedependentorpredictedvariable
• β0 is the y-intercept, i.e., the value of y whenbothxiandx2are0.
• β1 and β2 are the regression coefficients representingthechangeinyrelativetoaone-unit changeinxi1andxi2,respectively.
• βp is the slope coefficient for each independentvariable
• ϵ is the model’s random error (residual) term
8. ACKNOWLEDGMENT
Express my true sense of gratitude, sincere and sincere gratitudetomyguidetotheprojectProf.A.S.Hambardefor her precious collaboration and guidance that she gave me during my research, toinspire me and provide me withall thelaboratoryfacilities,thisitallowedmetocarryoutthis research work in a very simple and practical way. I would alsoliketoexpressmythankstoourcoordinator,HOD.Dr. Nikita Kulkarni and Principal Dr. Suhas Khot and all my friends who,knowingly orunknowingly, helped me during myhardwork.
9. REFERENCES
[1] Development of a New Method for Turbidity MeasurementUsingTwoNIRDigitalCameras Yuanyang Zhu, Pingping Cao, Sheng Liu,* Ying Zheng,andChaoqunHuang*
[2] Using a Digital Camera Combined With Fitting Algorithm and T-S Fuzzy Neural Network to DeterminetheTurbidityinWater PINGPINGCAO1,WENZHUZHAO1,SHENGLIU1, LISHI1,2,ANDHONGWENGAO3
Once the measurements have been validated, the results can be analyzed and visualized using GoogleEarthEngine.Thiscanbedonebycreating maps that show the turbidity levels at different points in the water body and by performing spatial analysis to identify areas of high or low turbidity.
Overall,themethodologyforturbiditymeasurementusing NIR digital cameras and Google Earth Engine involves a combination of image processing, statistical analysis, and machinelearningtechniquesandcanprovideaccurateand cost-effectivemeasurementsofturbidityinwaterbodies.
7. CONCLUSION
Inthissurvey,weproposed system which implementsthe procedure of water turbidity detection utilizing the Random Forrest Regressor in a well-organized and structured manner. Finding turbidity in water requires Turbidity sensor and human intervention. This all can be avoidedbyusingDigitalcamerastofindturbidityinwater.
[3] Chromaticity Measurement Based on the Image Method and Its Application in Water Quality Detection PingpingCao1,YuanyangZhu1,WenzhuZhao1, ShengLiu1,*andHongwenGao2
[4] TurbiditydetectionusingImageProcessing Vaibhav Karnawat1, Dr.S.L.Patil2 Department of InstrumentationandControlCollegeofEngineering Pune, India 411005 1vaibhav.karnawat@gmail.com, 2slp.instru@coep.ac.in
[5] Water Monitoring System Using Arduino with LabVIEW Yogesh K. Taru Electronics & Telecommunication Engineering Department, Government College of Engineering, Aurangabad, India. taruyogesh05@gmail.com. Anil Karwankar Electronics & Telecommunication Engineering Department, Government College of Engineering, Aurangabad,India.karwankar@yahoo.com
[6] TheHydroColorApp:AboveWaterMeasurements of Remote Sensing Reflectance and Turbidity
International Research Journal of Engineering and Technology (IRJET) e-ISSN: 2395-0056
Volume: 10 Issue: 02 | Feb 2023 www.irjet.net p-ISSN: 2395-0072
Using a Smartphone Camera Thomas Leeuw 1,* andEmmanuelBoss
[7] Lab on a Smartphone (LOS): A low-cost portable platform for real-time on-site water quality detection Si Kuan Thio,1 Seunguk Lee,2 Sungwoo Bae,2 and Sung-Yong Park1* 1Department of Mechanical Engineering, 2Department of Civil and Environmental Engineering National University of SingaporeSingaporempeps@nus.edu.sg
[8] WaterQualityAssessmentbyImageProcessing KarelHorak,JanKlecka,andMiloslavRichter
[9] WaterQualityMonitoringSystemUsingIOT
1Dr.NageswaraRaoMoparthiAssociateProfessor in Dept. of CSE Velagapudi Ramakrishna Siddhartha Engineering College, Vijayawada, AndhraPradesh,IndiaE-mail:rao1974@gmail.com
2 Ch. Mukesh Assistant Professor in Dept. of CSE Velagapudi Ramakrishna Siddhartha Engineering College,Vijayawada,AndhraPradesh,IndiaE-mail: mukesh.chinta@vrsiddhartha.ac.in 3 Dr. P. Vidya Sagar Associate Professor Dept. of Information Technology Velagapudi Ramakrishna Siddhartha Engineering College, Vijayawada, Andhra Pradesh, IndiaE-mail:pvsagar20@gmail.com
[10] A Low Cost System for Real Time Water QualityMonitoringandControllingusingIoT
K.GOPAVANITHA ,PG Scholar Department of ECE Vignan’s Lara Institute of Technology and Science Vadlamudi, INDIA gopavanitha94@gmail.com
S.NAGARAJU ,Assistant professor Department of ECE Vignan’s Lara Institute of Technology and Science Vadlamudi, INDIA nagarajusonti@gmail.com
[11] Modelling Reservoir Chlorophyll-a, TSS, andTurbidityUsingSentinel-2AMSIandLandsat8OLISatelliteSensorswithEmpiricalMultivariate Regression-YashonO.Ouma ,1,2KimutaiNoor,1andKipkemoiHerbert1
[12] Random Forest Ensemble for River Turbidity Measurement From Space Remote SensingData-KeGu;YonghuiZhang;JunfeiQiao