
International Research Journal of Engineering and Technology (IRJET) e-ISSN: 2395-0056
Volume: 12 Issue: 08 | Aug 2025 www.irjet.net p-ISSN: 2395-0072
International Research Journal of Engineering and Technology (IRJET) e-ISSN: 2395-0056
Volume: 12 Issue: 08 | Aug 2025 www.irjet.net p-ISSN: 2395-0072
Amit A Amin1 , Dr.L.B. Zala2 ,
1Ph.D Research Scholar, GTU Chandkheda, Ahmedabad
2 Retired Professors, Dept. of Civil Engineering, BVM Engineering college, Gujarat, India
Abstract -Urban roads play a crucial role in the infrastructure of metropolitan cities, especially in developing countrieslikeIndia, wherethesecitiessignificantlycontribute to national development. A well-planned and efficiently functioning road network is essential for the sustainable growthofany urbanarea. Urbanroadsaretypicallyclassified intoArterial,Sub-Arterial,Collector, andLocal(Street)roads. Among these, Arterial roads are of prime importance as they connect majorstateandnationalhighwaysandoftenserveas citybypasses. Understanding thetrafficflowcharacteristicsof Arterialroadsis, therefore, essentialfor urbantransportation planning. This study focuses on the SP Ring Road in Ahmedabad, selected as the representative Arterial Road stretches. Two midblock segments of 60 meters each were identified for detailed analysis: one near the Vastral and the other near the Odhav Traffic flow and speed data were collected through video recordings, while road inventory and supplementarydatawere obtainedthrough fieldsurveys. The video data was analysed using Avidemux software and processedusingMicrosoftExceltoextractvehiclecomposition, traffic volume, and speed information. Vehicles were categorized with DPCU into Two-Wheelers(0.28), ThreeWheelers(0.79), Cars, SUVs (Big Cars) (1.49), Light CommercialVehicles(LCVs)(2.1), HeavyCommercialVehicles (HCVs)(1.6),andMulti-AxleVehicles(MAVs)(5.76) Speed-flowdensityrelationships weredevelopedtounderstandthetraffic flowcharacteristics, R2 valuerangesfrom0.3277to0.9327,the estimated road capacity was found to be 4475 PCU/hour. Mathematicalspeedmodelsweredevelopedandvalidatedfor all vehicles.
Key Words: Speed-Flow, Avidemux, DPCU
1.INTRODUCTION
The transport system plays a major role in developing countriesbecauseitlinksgoodsandpassengerstothecity. Inthetransportsystem,roadtransportplaysamajorrole than any other mode of transportation. Most passengers (87%)andgoods(60%)travelthroughroadtransportation. InadevelopingcountrylikeIndiawherepeoplehavevery much use of road transportation than any other transportation facility. Because of the major use of road transportation,inIndia,roadtransportationtakestheshare of6.0to12%4%ofGDP.Indiahasaroadwaynetworkof63
lakhkilometre ofroadsasof31March2025.Theroadway networkofIndiatakesup85percentofpassengertraffic.In India,theroadwaysystemhasmainlytwotypesofroads,the first category is rural roads, and the second category is urban roads. Now, these two categories contain different types of roads like expressways, national highways, state highways,districtroads,andvillageroads.Nowintheroad transportsystem,thenationalhighwaytakesa2.13%share oftotalroads,similarly,thestatehighwayshavea3%share, thedistrictroadshavea10.17%share,theruralroadshave 72.97%share,urbanroadshave8.76%shareandlastthe projectroadshave5.71%shareofroads.
Thisstudyhasbeenconcentratedonestimationofdynamic passengercarunit(DPCU)valuesfordifferentcategoriesof vehicles under heterogeneous traffic conditions on midblock stretches under arterial of Sardar Patel Ring Road (SPRR)ofAhmedabadcityalsotoanalysesthevariationof DPCU with respect to traffic stream parameters. Two stretches of SPRR were selected based on variation of variationcriterionsuchaswidevariationinproportionsof different categories of vehicles, should be free from the effects of road side frictions, access point of intersections parkingfacilities,busstopcurvature,gradient,andmedian opening.Astraightroadmid-blockstretchesoftheselected urbanroadshasbeenselectedfordatacollectionpurpose.
The scope of this study is limited to analysing traffic composition, traffic volume, and vehicle speeds using the videography-based data collection method. Using videographicrecordings,essentialtrafficparameterssuchas speed,flow,anddensityforvariousclasseso,fvehiclesare extracted. These parameters are utilized to develop the speed–flow–densityrelationshipsfortheselectedmidblock stretches. Furthermore, the capacity of the roadway is estimated from the speed–flow curve, with analysis performedusingMicrosoftExcel.
InthepresentstudyChandramethodshasbeenadoptedfor evaluate DPCU value of different categories of vehicles. In mixtrafficstream,speedofthevehiclesismostly affected
International Research Journal of Engineering and Technology (IRJET) e-ISSN: 2395-0056
Volume: 12 Issue: 08 | Aug 2025 www.irjet.net p-ISSN: 2395-0072
among other traffic macroscopic parameter. In Chandra method speed is considered as basic parameter for determinationofDPCU,inthisstudysmallcarisconsidered asthestandarddesignvehicles
Variousresearchhasuseddifferentmethodsforpassenger carunitandmanyapproachesformodellingthespeed-flow characteristics of different classes of vehicles on highways.[1]studiedtheeffectofinfluencingparameterslike gradient, lane width, shoulder width, traffic composition, directional split, slow-moving vehicles, and pavement surfaceconditionsonthecapacityof-laneroadundermixed traffic conditions is evaluated, and adjustment factors for eachconditionareproposed. decreases with mixed traffic proportion but vehicular capacity increases for the same vehicular proportion. [2] The objective of the study is to analyse the analysis of estimated highway level of service concerning drivers’ characteristics and traffic conditions. Thefieldsurveyiscarriedoutfortrafficdatacollectionat thesametimethedriverswereaskedquestionsrelatedto thetrafficcondition.Thestudyrevealedthatthedriver’sage, gender,drivingexperience, etc.,affectthev/c ratioonthe perceived level of service. The plot of perceived level of service against v/c gives results that the relationship betweenperceivedlevelofserviceandtrafficconditionhasa linearformwithlargedifferencesinslopesandbreakpoints. Theresearcherssuggestthatdriversperceivenomorethan two or three levels of traffic conditions. Also, the study confirmsthatthelowtolerancedriversappeartobelevelof serviceAtoBandhightolerancedriversappeartobelevel ofserviceDtoE.[3]studiedthevariationofPassengerCar Unit(PCU)valueswithtrafficvolumeandcomposition on eighturbanarterialroads.Vehiclesweregroupedintofive categories,andsimultaneousequationsweredevelopedto estimate individual vehicle speeds. These equations were usedtoanalyzehowPCUvalueschangewithvaryingtraffic volumes.ThePCUvaluesderivedfromtheequationswere validatedagainstfielddata,andstatisticaltestsconfirmedno significant difference between the two, supporting the accuracy of the model [4] This paper focuses on the area occupancy of vehicles in mixed traffic conditions. The passengercarunitisestimatedwithadifferentmethodfor the eight-lane divided urban midblock stretches. For this studythreemethodsareusedforestimationthefirstmethod is to estimate the pcu using TRRL, the second method is based on the speed-area ratio and the third one is the occupancy based on the matrix solution. So, the study recommends that the area occupancy method for PCU estimationisusedwhenheterogeneous trafficisavailable andallthevehicleshavedifferentstaticcharacteristics.For more understanding of traffic flow, the Wiedemann 74 VISSIMmodelisused.Andthestudyshowsthatthenewly developed area occupancy based on matrix solution can helfull in heterogeneous traffic conditions. [5] analyzing traffic characteristics, capacity, level of service, and signal
design.ThestudyreviewedvariousPCUestimationmethods such as Speed Modeling (Chandra’s method), Headway, SpaceOccupancy,Delay-Based,MultipleLinearRegression, Simulation, and others. It emphasized that traditional methods used in developed countries may not suit mixed trafficconditionsfoundinIndia.Thepapercomparedthese methods, discussing their advantages, limitations, and challenges in application under heterogeneous traffic. Hareshkumar D. Golakiya and Ashish Dhamaniya (2019) studiedtheimpactofpedestriancrossingsonvehiclespeed, traffic flow, and capacity at urban midblock sections. The research highlights that in India, pedestrians often cross roadsunsafely,affectingtrafficmovementandincreasingthe risk of collisions. Data was collected from 15 six-lane midblocksectionsacrosssixmajorcitiesNewDelhi,Jaipur, Chandigarh, Noida, Surat, and Vadodara. The study developed speed–flow–density relationships and speed models,showinghowpedestriancrossingflowsignificantly reducesstreamspeedanddisruptstrafficflow.Thefindings stresstheneedforimprovedpedestrianfacilitiestoenhance road safety and traffic performance. Manish Patkar and AshishDhamaniya (2020) investigated the impactofnonmotorizedvehicles(NMVs)ontrafficstreamcharacteristics atsixurbanarterialmidblocksections.Usingvideography, speed–flowdatawascollectedtodevelopandvalidatetraffic speed models. The study found that an increase in NMV share leads to more disorganized traffic and significantly reduces stream speed and capacity. Specifically, road capacitydecreasedby3.6%to35.82%asNMVproportion increasedfrom5%to25%.Inthepast,varioustechniques havebeenadoptedtoestimatePCUofvehicles.Wernerand Morall(1976)proposedutilizingaheadwayratiomethodto determinePCUvaluesatlowlevelsofservice Biswas (2021) examined themethods adopted for estimating PCU and evaluated the advantages andlimitationsofeachapproach PassengerCarUnit(PCU)servesasacomparativeweighting factor assigned to different vehicle categories' traffic volumestoaddressthediversityinmixedtrafficscenarios. Numerous studies have been conducted to estimate PCUs for various vehicle categories. Some researchers have proposedfixedPCUvalues,whileothershaverecognizedthe dynamicnatureofPCUs. Thesestudieshavealso explored howPCUs vary with factors such as traffic characteristics and road geometry The review reveals that PCUs recommendedintheliteratureareoftentailoredtospecific regions due to variations in traffic patterns and driving normsamongnations,leadingtosignificantinconsistencies inoutcomes.Thesedisparitiesnotonlyexistintherangeof PCUsbutalsoinhowtheyfluctuatewithdifferentinfluencing factors This study offers a comprehensive overview of researchfindingsregardingPCUestimationonurbanroads Emer etal.(2021)initiatedthestudytoestablishthePCU valuesthatcatertothelocalsetting.Thisstudywasfocused to estimate the PCU values of multilane highwayin Addis Ababacityand determiningtheinfluenceoftrafficvolume andwidthofroadonthevalueofPCU.Inthisstudy,dynamic PCUmethodwasadoptedtodeterminethePCUvaluesand
International Research Journal of Engineering and Technology (IRJET) e-ISSN: 2395-0056
Volume: 12 Issue: 08 | Aug 2025 www.irjet.net p-ISSN: 2395-0072
linear regression analysis was performed for model development.The studyresultindicatesthat as the traffic volumeandcarriagewaywidthincrease,thePCUvaluealso increases.ItwasalsofoundthatPCUvaluesshowedhigher than those provided by highway capacity manual (HCM) Hence the PCU values obtained are reflectingthe existing conditioninthelocality.
3. Data Collection and Data Extraction
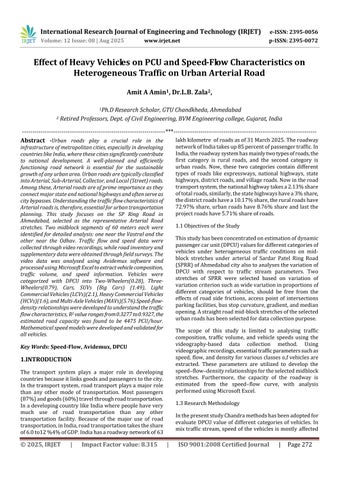
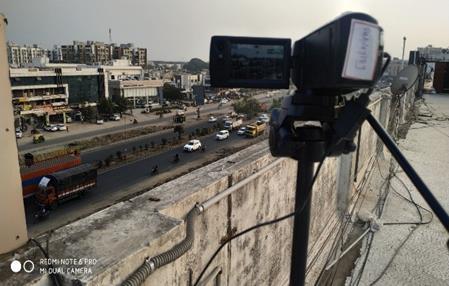
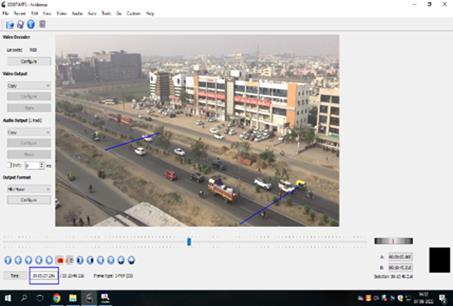
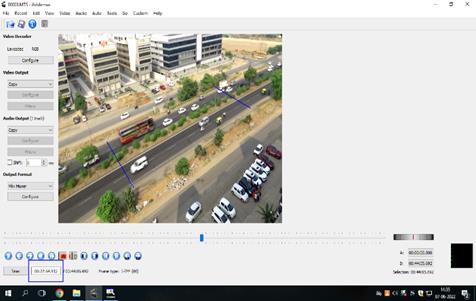
Inthisstudy,trafficdatawascollectedfromtwostretchesof the Sardar Patel Ring Road in Ahmedabad, mainly near VastralandOdhav.A60metrestraightstretchwasselected in each area, avoiding intersection, roadside stalls, and curvestoensureaccurateresults.Theseroadswereonflat terrain and had mixed traffic. Sardar Patel Ring Road of Ahmedabad city under ideal roadway and weather conditions. All the locations on level terrain have 7.5 m pavement width and 1.1 m paved the shoulders. Data collection was conducted during day time using the videography technique. Traffic flow and speed data were collected2hoursinthemorning9:00a.m.to11:00a.m.and 2hintheevening4:00p.m.to6:00p.m.inthewinterseason using video recording techniques and road inventory surveys carried out manually during conditions of good visibility.Video-recordingtechniqueswereusedtocapture accuratedata ata rateof1/25 AtVastral,thecamera was placedonaresidentialbuildingterrace,andatOdhav,ona commercial building. Longitudinal trap of 60 metres in
length was made on the road surface for measuring the speed.Thevideocameraswerepositionedonbothsidesfor upanddownvehiclemovementinsuchawayontopofhighrise buildings that each vehicle can be easily tracked throughouttheentiretrap,especiallyattheentryandexit pointsonbothsidesThenumberofvehiclespassingthrough thestretchwascountedforeachlaneanddirection.Speed wascalculatedbynotingthetimewhenthefrontbumperof a vehicle crossed the start and end points of the stretch. Initially,datawascollectedin1-minuteintervals,butitwas later changed to 5-minute intervals for better accuracy. Vehicles were classified into categories such as twowheelers, three-wheelers, cars, SUVs, light commercial vehicles (LCVs), heavy commercial vehicles (HCVs), and multi-axlevehicles(MAVs).Thismethodprovidedaccurate measurements of speed, volume, and vehicle types under mixed traffic conditions on the SP Ring Road Data extraction was done manually by playing the video in the laboratoryonaprojectorscreenfortheselectedlocations. Consequently,trafficvolume,composition,vehicularspeed, 85thpercentilespeedofeachcategory,andtimeheadway formthecollectedvideodata.
Analysis of the percentage of vehicle traffic composition givesanideaoftheproportionofawidevarietyofvehicles. Thestudyshowsthattwo-wheelersaverage(34%)bothLHS andRHSandcarbothside27.5%and29%,i.e.,motorcycles, havethehighestpercentageinthetrafficstream,truckshave the lowest percentage in the traffic stream, and the percentageofcarsshowsslightvariationinvolumeoftraffic. All these traffic distributions Average percentage compositionofbothstretches,LHSandRHS,showninTable1,indicatesignificantdifferencesinvehiclebehaviouracross thetwostretches.Understandingthesevariationscanhelpin developing targeted traffic management strategies to improveflowandsafetyontheroads.
Table1PercentageAverageVehiclesCompositionboth stretches
International Research Journal of Engineering and Technology (IRJET) e-ISSN: 2395-0056
Volume: 12 Issue: 08 | Aug 2025 www.irjet.net p-ISSN: 2395-0072
Thespeedofeachvehicleofallcategorieswascalculatedby using travel time and length of stretch. The spot speed is usually measured by measuring time taken by vehicle to traverseafixeddistancelessthan90m(Mathew,2019).The PCUfactor is based on the mean speed valuesofdifferent vehicleclasses.Thisiscalculatedbydividingthemeanspeed value of passenger cars by the mean speed value of any vehicle class The average speed of different vehicle categories at different both stretches left and right carriagewayofhighwayispresentedinTable2and3
The speed data collected from both Vastral and Odhav stretches shows noticeable variation across vehicle types and directions. Two-wheelers recorded the highest mean speed, with 46.0 km/h on the left carriageway and 43.5 km/hontheright.Three-wheelersaveraged33.0km/h(left) and31.0 km/h(right),showing morevariabilityinspeed. CarsandSUVshadhigheraveragespeeds,withcarsreaching 49.5km/h(left)and51.0km/h(right),whileSUVsaveraged 49.0 km/h (left) and 45.0 km/h (right). Light commercial vehicles (LCVs) showed a drop in speed on the right side (36.5 km/h) compared to the left (42.5 km/h). Buses maintained similar speeds on both sides, around 38–39.5 km/h, but with high-speed variations. Among multi-axle vehicles,speedsrangedbetween32.5–40.0km/hontheleft and34.0–38.0km/hontheright.Generally,heaviervehicles suchas3-axleand4-axletrucks,andsemi-trailers,showed lowermeanspeedsandhighervariations,especiallyonthe rightcarriageway.Thisdatahighlightsthatlightervehicles tend to move faster, and there’s more speed variability in right-sidetraffic,possiblydueto overtaking or laneusage patterns.
Table2Averagespeedindividualvehiclesofboththe stretchesLeftcarriageway
Table3Averagespeedindividualvehiclesofboththe stretchesRightcarriageway
Table4and5andfigure2showsthefrequencydistribution of vehicle speeds on both stretches of the SP Ring Road revealscleardifferencesacrossvehicletypes.Two-wheelers and cars show the highest speeds, with 98th percentile speeds reaching up to 57.5 km/h and 60–61 km/h respectively.Theirmedianspeedsarealsohigh,around46.0 km/h for two-wheelers and 49.5–51.0 km/h for cars, indicatingconsistentandfastermovement.SUVsandLCVs alsotravelatrelativelyhighspeedsbutshowawiderrange betweentheir15thand98thpercentilespeeds,pointingto morevariabledrivingpatterns.Three-wheelers,buses,and light commercial vehicles fall into the moderate speed category,withmedianspeedsbetween31.0and42.5km/h, and lower percentiles dropping to 21–28 km/h. This suggeststhesevehiclesoftenmoveslowly,possiblydueto traffic conditions or road sharing with heavier vehicles. Heavytrucksandtrailers,suchasmulti-axleandsemi-trailer types, are the slowest group, with median speeds mostly
International Research Journal of Engineering and Technology (IRJET) e-ISSN: 2395-0056
Volume: 12 Issue: 08 | Aug 2025 www.irjet.net p-ISSN: 2395-0072
between 29.0 and 38.0 km/h, and minimum percentiles oftenbelow30km/h.Ingeneral,theleftcarriageway
Table4AverageFrequencyDistributionforboththe stretchesLeftCarriagewaySpeed(kmph)
Vehicle
supports slightly higher speeds across most vehicle types compared to the right, especially for fast-moving vehicles like cars and two-wheelers. Overall, the data reflects that lightervehiclestravelfasterandmoresteadily,whileheavier vehicles move slower with greater speed variation. These findings highlight the importance of proper lane management, especially in mixed-traffic urban roads, to maintainsmootherandsafertrafficflow
Table5AverageFrequencyDistributionforboththe stretchesRightCarriagewaySpeed(kmph)
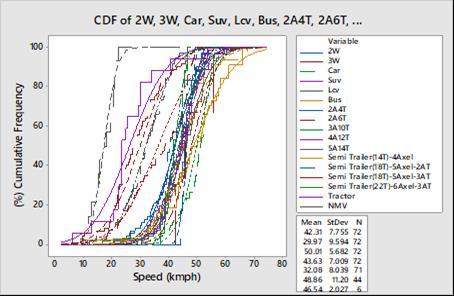
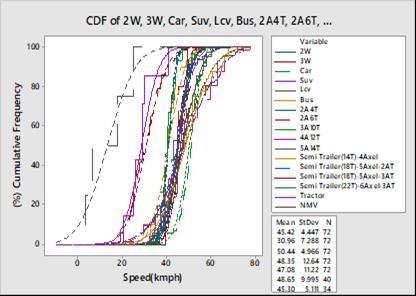
Figure 2 Cumulative frequency distribution curve
3PCUEstimation
In mixed traffic condition flow changes with changing the speedofvehiclesofeachcategoryalsothedifferentkindof vehicles affects traffic flow differently. This change may affect PCU also because in the mixed traffic condition the different categories of vehicles like two-wheelers, autorickshaw(three-wheeler), cars, SUVs (big cars), Light commercialvehicles,Buses,Heavycommercialvehicleslike twoaxelandthreeaxeltrucks,Multiaxelvehicleslikefour axelruck,fiveaxeltruck,atruckwithtrailer(Tractor-trailer truck),etc.Thesevehiclesmoveatdifferentspeedsintraffic
International Research Journal of Engineering and Technology (IRJET) e-ISSN: 2395-0056
Volume: 12 Issue: 08 | Aug 2025 www.irjet.net p-ISSN: 2395-0072
flowandtheyalsohavedifferentphysicaldimensions.These factorsaffectPCUverymuchbecausesmallsizevehicleslike two-wheeler,auto-rickshaw,andsmallcarshavemorespeed comparedtolargersizevehiclesliketrucksandbecauseof their small size these vehicles also have more mobility in traffic.Butontheotherhand,largevehiclesliketruck,buses, and MAVs requires more area and they also move slowly compared to small size vehicle in traffic. Because of all of theseconditionsPCUestimationisrequired.Thepreciseor accurate PCU estimation gives a better understanding of traffic flow characteristics and it also helps develops the differenttrafficmanagementfacilities.So,forPCUestimation alltrafficflowparametersshouldbeconsideredlikestream speed,vehiclecomposition,capacity,etc.So,Chandra(2004) givestheideaofdynamicPCUvaluesfordifferentcategories of vehicles for different traffic flow conditions. So, to estimate the dynamic PCU values following equation1 is used.
PCU=[Vc/Vi]/[Ac/Ai] (1)
In Which, Vc= Average speed of the standard car, Vi= AveragespeedofthesubjectvehicleAc=Projectedareaof thestandardcar,Ai=Projectedareaofthesubjectvehicle
Table 6 Estimated PCU Value for different categories of vehicles Sr
The speed-flow-density relationship is a fundamental conceptintrafficflowtheory,describinghowtrafficspeed, volume (flow), and vehicle density interact under varying roadwayconditions.Underfree-flowconditions,asdensity increases, the flow also increases since more vehicles are present without significantly affecting speed. However, beyond a critical density, increased congestion leads to a sharp decline in speed, causing the flow to drop as well eventually. This relationship typically forms a parabolic curvewhenplottedasflowversusdensity,andadownwardsloping curve for speed versus density. In heterogeneous traffic,suchasontheSPRingRoad,thepresenceofmixed vehicletypeswithvaryingsizesandspeedsdistortstheideal relationships. For example, heavy vehicles slow down the overall stream speed and occupy more space, increasing densityatafasterratethanflow.Asaresult,thepeakflowis reached at lower densities compared to homogeneous conditions. Understanding this relationship is crucial for effective traffic management and capacity estimation on urbanarterialroads.Thespeed–flow–densityrelationshipis a core element of traffic flow theory, illustrating the interdependence of three fundamental parameters: speed (v), flow (q), and density (k), where the relationship is mathematicallyexpressedasq=v×k.Ingeneral,whena roadisunderfree-flowconditions,vehiclesmoveatornear thedesiredspeedwithminimalinteraction,andasdensity increases, the traffic flow also increases because more vehicles are moving efficiently through the roadway stretches.However,asdensitycontinuestorise,thespace availablebetweenvehiclesreduces,leadingtomorefrequent interactionsandreducedspeeds.Beyonda certaincritical density,theflowreachesitsmaximum(knownascapacity) and begins to decline due to increasing congestion and decliningspeeds.Thiscreatesaparabolicflow–densitycurve whereflowfirstincreaseswithdensityandthendecreases, whilethespeed–densitycurvetypicallyshowsa declining trend, and the speed–flow curve shows a rising trend followedbyadropafterpeakflow.
Inthecontextofheterogeneoustraffic,suchasonSPRing Road,wherevehiclesrangefromtwo-wheelerstomulti-axle trucks,thisrelationshipbecomesmorecomplex.Thediverse dimensions, dynamic behavior, and performance characteristics of each vehicle type cause uneven spacing andinconsistentspeedprofiles.Forexample,slower-moving or larger vehicles like HCVs and MAVs increase localized density and reduce overall stream speed, thereby shifting the critical density and flow values. The presence of nonlane-based movements, frequent overtaking, and inconsistent headways further distort the ideal curves. In such traffic, PCU values and effective density become dynamic rather than fixed. This often results in early breakdownofflow,reducedcapacity,andhighervariability inspeedandflowatthesamedensitylevels.Understanding thetruenatureofthespeed–flow–densityrelationshipunder
International Research
Volume: 12 Issue: 08 | Aug 2025 www.irjet.net p-ISSN: 2395-0072
such mixed traffic is essential for planning signal timings, designing road geometry, estimating realistic roadway capacities, and formulating traffic management strategies tailored for urban Indian roadways. The relationship betweenspeed,flow,anddensitywasanalyzedusingthree trafficflowmodels:Greenshield,Greenberg,andUnderwood. Among the speed-density models, the Underwood model showed the best fit, with an R² value of 0.6147, followed closely by the Greenshield model (R² = 0.6045). This indicatesamoderatelystrongrelationshipbetweenspeed and density, with Underwood's exponential form slightly outperformingtheothers.Forthespeed-flowrelationship, allthreemodelsshowedrelativelyweakcorrelations,with R² values ranging from 0.3277 to 0.3439, suggesting that speedalonemaynotbeastrongpredictoroftrafficflow.In contrast, the flow-density relationship demonstrated the strongestcorrelations,withallmodelsperformingwell.The GreenbergmodelhadthehighestR²of0.9327,followedby Greenshield (0.9163) and Underwood (0.8754). This indicates that traffic flow is most accurately explained by density,andlogarithmicorlinearmodelslikeGreenbergand Greenshield provide reliable fits. Overall, the study shows thatdensityhasastrongerinfluenceonflowthanonspeed, andmodelslikeGreenbergaremoreeffectiveincapturing thisbehavior.
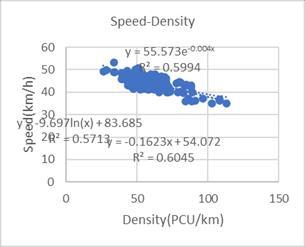
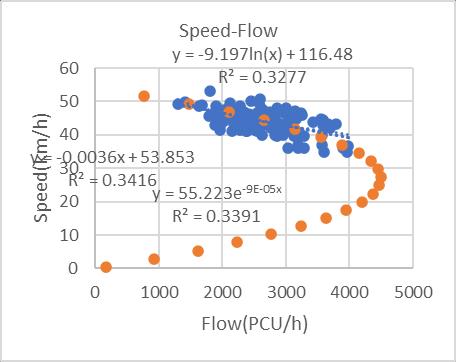
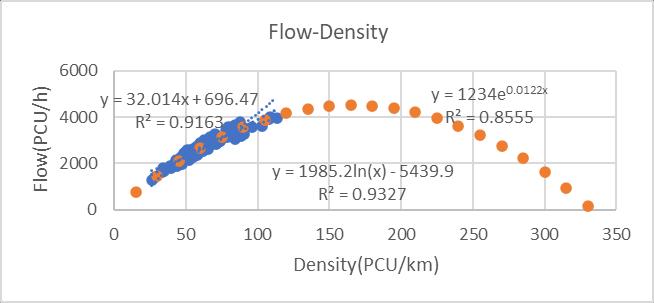
Figure3SpeedFlowdensityrelationship Table 7 SpeedFlowdensityequationsforbothstretches
Density
In this study, the effect of PCU estimating methods on roadway capacity determinationis observed for two-lane rural roads The case study stretches consideredhere are Vastral and Odhav; Both the road stretches are a part of Sardar Patel ring road Ahmedabad city. The dynamic PCU concept by Chandra and Sinha (2001) and the method suggestedinIndo-HCM(2017) ThePCUvaluesdetermined bythedynamicPCUconceptaredependentonthedynamic characteristics of a vehicle. Speed- Flow-Density relationship(Figure3andTable4AND5)forboththeroad
International Research Journal of Engineering and Technology (IRJET) e-ISSN: 2395-0056
Volume: 12 Issue: 08 | Aug 2025 www.irjet.net p-ISSN: 2395-0072
stretchesusingGreenshield’sLinearModel,Greenburgand Underwood model. Ultimately, the capacity of the two highwayswasestimatedwithdifferentPCUvaluesobtained fromdifferentPCUvalueestimatingmethods.Theanalysis of traffic flow relationships using Greenshield, Greenberg, and Underwood models reveals that flow-density relationshipsarebestdescribedbythesemodels,withthe Greenbergmodelshowingthehighestaccuracy(R²=0.93). Thisindicatesastronglinkbetweentrafficdensityandflow onthestudiedroadstretches.Incontrast,thespeed-density andspeed-flowrelationshipsarelessaccuratelypredicted, with moderate to low R² values (around 0.3 to 0.6), suggesting that factors other than speed alone influence trafficflowanddensity.Amongthespeed-densitymodels, theUnderwood model performedslightly better, while all speed-flow models showed relatively weak correlations. Overall,thefindingsemphasizethattrafficdensityisakey factor in modeling flow, and logarithmic models like Greenberg provide better predictions in mixed traffic conditions. These insights can help in traffic management andplanningforurbanroadstooptimizeflowandreduce congestion.
References
[1] S.Chandra,"Effectofroadroughnessoncapacityoftwolaneroads," Journal of Transportation Engineering, vol. 130,no.3,pp.360-364,2004.
[2] V.M.A.J.G.EleonoraPapadimitriou,"Perceivedlevelof service driver and traffic characteristics: Piecewise linear model," Journal of transportation engineering@ASCE, vol.00,no.00,pp.887-894,2010.
[3] S.D S.D.S.N.AkhileshKumarMaurya,"Studyonspeed andtimeheadwaydistributionontwo-lanebidirectional road in heterogeneous traffic condition," in 11th Transportation Planning and Implementation Methodologies for developing countries, TPMDC-2014, Mumbai,2016.
[4] N. R. M. S. A. A. G. J. Pallav Kmar, "Validating area occupancybasedpassengercarunitsandhomogeneous equivalent concept under mixed traffic conditions in India," Journal of Transportation Engineering Part A: system, vol.144,no.10,pp.0401804-1to0401804-13, 2018.
[5] K. S. A. A. U. R. S. Pooja Raj, "Review of methods for Estimation of passenger car unit values of vehicles," Journaloftransportationengineeringpart-A, vol.145,no. 6,pp.04019019-1to04019019-17,2019.
[6] S.A S.A.mehar,"Passengercarunitsatdifferentlevelsof service for capacity analysis of multilane interurban highways in India," Journal of Transportation
Engineering @ASCE, pp.81-88,2014.
[7] S. D. S. D. A. S. N. Akhileshkumar Maurya, "Study on speed and time-headway distributions on two bidirectionalroadsinheterogeneoustrafficconditions," in 11th transportation planning and implementation methodologies for developing countries, TPMDC2014,1012 December 2014,Mumbai,2014.
[8] I. G. a. s. C. Amardeep Boora, "Identification of freeflowing vehicles on two lane intercity highways under heterogeneoustrafficconditions,"in 2016International SymposiumofTransport Simulation(ISTS16conference), June 23- 25, 2016,2017.
[9] V.A.a.S.S.Arkatkar,"Microsimulationstudyoftheeffect of volume and road width on PCU of vehicles under heterogeneous traffic," Journal of Transportation Engineering @ ASCE, vol. 136, no. 12, pp. 1110-1119, 2010.
[10] S. C. Ashish Damaniya, "Speed prediction models for urbanarterialsundermixedtrafficconditions,"in 2nd International Conference of Transportation Research of India (2nd CTRG),2013.
[11] W.c.L.L.BingLi,"Lane-basedqueuelengthestimation in heterogeneous traffic flow consisting of Cars and Buses," Journal of Transportation Engineering part A: Systems, vol.146,no.2,pp.04019065-1to0401906515,2020.
[12] S.O A.Ch. Mallikarjuna,"Analysisofthemacroscopic relations for no lane-based heterogeneous traffic stream,"in Sustainable development of Civil, Urban and Transportation Engineering conference,2016.
[13] A.D.a.S.Chandra,"Conceptofstreamequivalencyfactor for heterogeneous traffic on urban arterial roads," Journal of Transportation Engineering (ASCE), vol.139, no.11,pp.1117-1123,2013.
[14] D.ChetanRPatel,"CapacityandLOSforurbanarterial road in Indian mixed traffic conditions," Social and behavioural science, vol.48,pp.527-534,2012.
[15] H. G. A. A. Dhamaniya, "Modelling speed and capacity estimation at urban midblock stretchess under the influence of crossing pedestrians," Journal of Transportation Engineering Part A: System, vol.145,no. 9,pp.04019036-1to04019036-14,2019.
[16] M. P. A. A. Dhamaniya, "Influence of nonmotorized vehiclesonspeedcharacteristicsandcapacityofmixed motorizedtrafficofurbanarterialmideblockstretchess,"
International Research Journal of Engineering and Technology (IRJET) e-ISSN: 2395-0056
Volume: 12 Issue: 08 | Aug 2025 www.irjet.net p-ISSN: 2395-0072
Journal of transportation engineering Part A: systems, vol.146,no.4,pp.04020013-1to04020013-11,2020.
[17] A. K. J. M. A. A. A. S. R. Gofran J Qasim, "Estimating a congested road capacity-headway relationship of a multi-lane highway in an urban area based on lane position," Periodicalsofengineeringandnaturalsciences, vol.8,no.3,pp.1263-1279,2020.
[18] K.R.Hari Krishan Gadam, "Speed-density functional relationshipforheterogeneoustrafficdata:astatistical andtheoreticalinvestigation," JournalofMod.Transport, vol.27,no.1,pp.61-74,2019.
[19] R.A.N.J.Ben-Edigbe,"Headwaydistributionbasedon empirical Erlang and Pearson type-III time methods compared," Research Journal of Applied Sciences, Engineering and Technology, vol. 7, no. 21, pp. 44104414,2014.
[20] G. J. S. S. A. K. R. Jabeena Mannithodi, "Study of flow characteristics and traffic stream modelling of Indian Expressway: A case study of Mahtma Gandhi Expressway,"in Proceedings of the Eastern Asia Society for Transportation Studies, Vol 10 2015,2015.
[21] J. S. A. S. M. Jain K, "Traffic flow characteristics for multilane highways in India," in 11th Transportation Planning and Implementation Methodologies for Developing Countries, TPMDC 2014,10-12 December, Mumbai,2014.
[22] S. A. S. M. Jain K, "Traffic flow characteristics for MultilanehighwaysinIndia," Transportation Research Procedia, pp.468-477,2016.
[23] A.B.P.G.A.J.JaydipGoyani,"Investigationofcrossing conflictsbyvehicletypeatunsignalizedt-interstretchess undervaryingroadwayandtrafficconditionsinIndia," JournalofTransportationPartA:Systems, vol.147,no.2, pp.05020011-1to050200-18,2021.
[24] P. K. S. A. G. Joshi, "New approach for estimating passenger car units on multilane urban roads with heterogeneoustrafficconditions,"AmericanSocietyfor CivilEngineers,JournalofTransportationEngineering, Part A: Systems, vol. 144, no. 3, pp. 04018002-1-14, 2018.
[25] C.Lee,"Developingpassengercarequivalentsforheavy vehicles in entry flow at roundabouts," Journal of Transportation Engineering, vol. 141, no. 8, pp. 04015013-1to04015013-7,2015.
[26] A.f.a.E.v.maina,"ValidationandSensitivityanalysisof adevelopedmidblockvehiculardelaymodel," Journal of TransportationEngineeringpartA:Systems, vol.143,no. 7,pp.04017023-1to04017023-12,2017.
[27] S.D.&A.K.Maurya,"Bivariatemodellingtimeheadways in mixed traffic streams: a copula approach,"Transportation Letters, the international journal of transportation research, vol. 1, no. 1, p. 10, 2018.
[28] D. D. Mr.V.Surech, "Analysis of Headway of heterogeneous traffic on Indian urban roads," Global JournalofResearchinEngineering:ECivilandStructural Engineering, vol.14,no.3,2014.
[29] S.A.J.NarayanRaju,"Modelingfollowingbehaviourof vehicles using trajectory data under mixed traffic conditions:anIndianviewpoint," TransportationLetters, Taylor & Francis, vol.00,no.00,pp.1-15,2020.
[30] P. K. A. A. M. a. G. J. Nipjyopti Bharadwaj, "Traffic data analysis using image processing technique on DelhiGurgaon expressway," Current Science, vol. 110, no. 5, pp.808-823,2016.
[31] S.Panichpapiboon,"Timeheadwaydistributiononan Expressway:caseonBangkok," Journaloftransportation engineering, pp.05014007-1to05014007-8,7January 2015.
[32] I. G. S. C. Praveena Penmetsa, "Evaluation of performancemeasuresfortwo-laneintercityhighways under mixed traffic conditions," Journal of Transportation Engineering, vol. 141, no. 10, pp. 04015021-1to04015021-7,2015.
[33] A. A. Rohit Singh, "Analysis of traffic flow in different weatherconditions," AnnalsofR.S.C.B, vol.25,no.04,pp. 11682-11691,2021.
[34] R.R.P.Saha,"Headwaydistributionmodelsoftwo-lane roadsundermixedtrafficconditions:acasestudyfrom India," Europeantransportresearchreview, vol.10,no.3, pp.1-12,2018.
[35] B.S.S.S.m.S.SandeepSingh,"Infraredsensor-based technology for collecting speed and headway data on highway under mixed traffic conditions," in 7th International Conference on Signal Processing and Integrated Networks (SPIN),Tiruchirapalli,2020.
[36] S.m.s.SandeepSingh,"EvaluationofLane-basedtraffic characteristics of highways under mixed traffic conditions by different methods," j.Inst.eng.india.ser.A
International Research Journal of Engineering and Technology (IRJET) e-ISSN: 2395-0056
Volume: 12 Issue: 08 | Aug 2025 www.irjet.net p-ISSN: 2395-0072
September 2021, vol.102,no.3,pp.719-735,2021.
[37] a. k. m. a. A. k. b. Sanhita Das, "Determinants of time headway in taggeredg car following conditions," Transportation Letters, pp.1-11,2017.
[38] A.M.SanhitaDas,"TimeheadwayanalysisforFourlane andTwolaneroads,"vol.3,no.9,pp.1-18,2017.
[39] H. w. D. h. a. J. s. Shangjia Dong, "Nonparametric modellingofvehicletypespecificheadwaydistribution in freeway work zones," Journal of Transportation Engineering, vol.14,no.11,pp.1-13,2015.
[40] V.A.ShriniwasSArkatkar,"Micro-simulationsstudyof vehicular interactiosns on upgrades of intercity roads under heterogeneous traffic conditions in India," European Transport, vol.4,no.52,pp.1-33,2012
[41] S. P. R. K. S. D. K. Singh, "Effect of Heavy Transport VehiclesonSpeed-FlowCharacteristicsofMixedTraffic on Multi-Lane Divided Intercity Highways," Resilience andSustainableTransportationSystems, Vols.2020-6,no. 176-185,2020-6.
[42] S. k. R. S. G. Tanumoy Ghosh, "Capacity estimation of multilane highways under heterogeneous traffic conditions using micro simulation technique," Samriddhi, vol.12,no.1,p.00,2020.