International Research Journal of Engineering and Technology (IRJET)
e-ISSN: 2395-0056
Volume: 12 Issue: 04 | Apr 2025
p-ISSN: 2395-0072
www.irjet.net
Dynamic linkages between Environment and Oil Consumption and their impact on Economic Growth Nosheen Mumtaz1, Tuaha Naseem2 1Nosheen Mumtaz, Dept. of Economics and Management, Anhui University of Science and Technology, Huainan,
China
2Tuaha Naseem, Dept. of Economics and Management, Chang’an University, Xi’an Shaanxi, China
---------------------------------------------------------------------***---------------------------------------------------------------------
Abstract - The dynamic links between Pakistan's economic growth, fuel consumption (FC), carbon dioxide emissions (CO₂), and population growth (POP_G) between 1996 and 2022 are examined in this paper. We verify symmetric cointegration between these variables using an ARDL bounds testing approach (F-statistic = 4.530 > 4.35 critical value), indicating a stable long-run equilibrium. One of the primary decisions was that, according to the GDPEnvironment Nexus, GDP shows a high positive connection with CO₂ (0.967) and POP_G (0.966), but a low correlation with FC (-0.031), indicating that Pakistan's growth is still energy-inefficient and emission-intensive. Population-Driven Dynamics: Population growth (POP_G) has a substantial correlation with CO₂ emissions (0.970) and a long-run elasticity of 2.22 with GDP (ARDL), suggesting that demographic pressures increase both economic output and environmental deterioration. The severe emission dependency of Pakistan is revealed by the CO₂-GDP elasticity of 69.38. Asymmetric Energy Effects: Due to structural inefficiencies in energy use, FC exhibits varying short-term effects on GDP (lagged range from -4.23 to +3.82). Rapid annual adjustment to equilibrium is indicated by the error correction term (-0.677). The findings highlight how urgent it is to match Pakistan's high CO₂-GDP elasticity (69.38) with its Renewable Energy Policy 2030 and NDC ambitions. It is advised to implement population-sensitive climate measures in order to lessen the trade-off between emission-intensive growth and agricultural production, which now accounts for 24% of GDP. In Pakistan's development framework, the study offers empirical support for policymakers to create integrated energy-population-climate plans that prioritize sustainable urbanization and the transition to renewable energy.
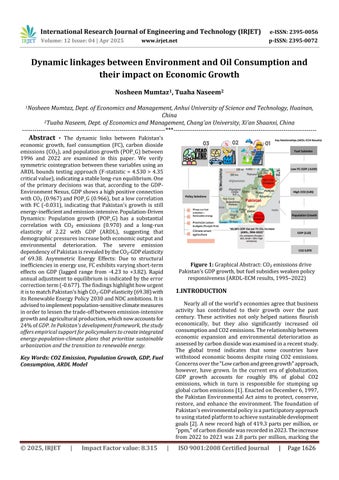
Figure 1: Graphical Abstract: CO₂ emissions drive Pakistan’s GDP growth, but fuel subsidies weaken policy responsiveness (ARDL-ECM results, 1995–2022)
1.INTRODUCTION Nearly all of the world's economies agree that business activity has contributed to their growth over the past century. These activities not only helped nations flourish economically, but they also significantly increased oil consumption and CO2 emissions. The relationship between economic expansion and environmental deterioration as assessed by carbon dioxide was examined in a recent study. The global trend indicates that some countries have withstood economic booms despite rising CO2 emissions. Concerns over the "Low carbon and green growth" approach, however, have grown. In the current era of globalization, GDP growth accounts for roughly 8% of global CO2 emissions, which in turn is responsible for stumping up global carbon emissions [1]. Enacted on December 6, 1997, the Pakistan Environmental Act aims to protect, conserve, restore, and enhance the environment. The foundation of Pakistan's environmental policy is a participatory approach to using stated platform to achieve sustainable development goals [2]. A new record high of 419.3 parts per million, or "ppm," of carbon dioxide was recorded in 2023. The increase from 2022 to 2023 was 2.8 parts per million, marking the
Key Words: CO2 Emission, Population Growth, GDP, Fuel Consumption, ARDL Model
© 2025, IRJET
|
Impact Factor value: 8.315
|
ISO 9001:2008 Certified Journal
|
Page 1626