
International Research Journal of Engineering and Technology (IRJET) e-ISSN: 2395-0056
Volume: 12 Issue: 05 | May 2025 www.irjet.net p-ISSN: 2395-0072
International Research Journal of Engineering and Technology (IRJET) e-ISSN: 2395-0056
Volume: 12 Issue: 05 | May 2025 www.irjet.net p-ISSN: 2395-0072
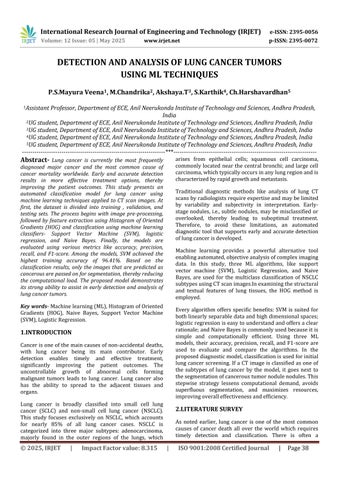
P.S.Mayura Veena1, M.Chandrika2, Akshaya.T3, S.Karthik4 , Ch.Harshavardhan5
1Assistant Professor, Department of ECE, Anil Neerukonda Institute of Technology and Sciences, Andhra Pradesh, India
2UG student, Department of ECE, Anil Neerukonda Institute of Technology and Sciences, Andhra Pradesh, India
3UG student, Department of ECE, Anil Neerukonda Institute of Technology and Sciences, Andhra Pradesh, India
4UG student, Department of ECE, Anil Neerukonda Institute of Technology and Sciences, Andhra Pradesh, India
5UG student, Department of ECE, Anil Neerukonda Institute of Technology and Sciences, Andhra Pradesh, India
Abstract- Lung cancer is currently the most frequently diagnosed major cancer and the most common cause of cancer mortality worldwide. Early and accurate detection results in more effective treatment options, thereby improving the patient outcomes. This study presents an automated classification model for lung cancer using machine learning techniques applied to CT scan images. At first, the dataset is divided into training , validation, and testing sets. The process begins with image pre-processing, followed by feature extraction using Histogram of Oriented Gradients (HOG) and classification using machine learning classifiers- Support Vector Machine (SVM), logistic regression, and Naive Bayes. Finally, the models are evaluated using various metrics like accuracy, precision, recall, and F1-score. Among the models, SVM achieved the highest training accuracy of 96.41%. Based on the classification results, only the images that are predicted as cancerous are passedon for segmentation, therebyreducing the computational load. The proposed model demonstrates its strong ability to assist in early detection and analysis of lungcancertumors.
Key words-Machinelearning(ML),HistogramofOriented Gradients (HOG), Naive Bayes, Support Vector Machine (SVM),LogisticRegression.
Cancerisoneofthemaincausesofnon-accidentaldeaths, with lung cancer being its main contributor. Early detection enables timely and effective treatment, significantly improving the patient outcomes. The uncontrollable growth of abnormal cells forming malignant tumors leads to lung cancer. Lung cancer also has the ability to spread to the adjacent tissues and organs.
Lung cancer is broadly classified into small cell lung cancer (SCLC) and non-small cell lung cancer (NSCLC). This study focuses exclusively on NSCLC, which accounts for nearly 85% of all lung cancer cases. NSCLC is categorized into three major subtypes: adenocarcinoma, majorly found in the outer regions of the lungs, which
arises from epithelial cells; squamous cell carcinoma, commonlylocated near the central bronchi;andlargecell carcinoma,whichtypicallyoccursinanylungregionandis characterizedbyrapidgrowthandmetastasis.
Traditional diagnostic methods like analysis of lung CT scansbyradiologistsrequireexpertiseandmaybelimited by variability and subjectivity in interpretation. Earlystage nodules, i.e., subtle nodules, may be misclassified or overlooked, thereby leading to suboptimal treatment. Therefore, to avoid these limitations, an automated diagnostic tool that supports early and accurate detection oflungcancerisdeveloped.
Machine learning provides a powerful alternative tool enablingautomated,objectiveanalysisofcompleximaging data. In this study, three ML algorithms, like support vector machine (SVM), Logistic Regression, and Naive Bayes, are used for the multiclass classification of NSCLC subtypesusingCTscanimages.Inexaminingthestructural and textual features of lung tissues, the HOG method is employed.
Every algorithm offers specific benefits: SVM is suited for bothlinearlyseparabledataandhighdimensionalspaces; logisticregressioniseasytounderstandandoffersaclear rationale;andNaiveBayesiscommonlyusedbecauseitis simple and computationally efficient. Using three ML models, their accuracy, precision, recall, and F1-score are used to evaluate and compare the algorithms. In the proposeddiagnosticmodel,classificationisusedforinitial lungcancerscreening.If a CTimageisclassifiedasone of the subtypes of lung cancer by the model, it goes next to thesegmentationofcanceroustumornodulenodules.This stepwise strategy lessens computational demand, avoids superfluous segmentation, and maximizes resources, improvingoveralleffectivenessandefficiency.
As noted earlier, lung cancer is one of the most common causes of cancer death all over the world which requires timely detection and classification. There is often a
International Research Journal of Engineering and Technology (IRJET) e-ISSN: 2395-0056
Volume: 12 Issue: 05 | May 2025 www.irjet.net p-ISSN: 2395-0072
misinterpretationwiththeconventionalmethodsusedfor diagnosing such as analysis of CT Scan, giving rise to a needforautomateddiagnostictechniques.
Detection of lung cancer using Machine Learning algorithms has widely been practiced. A model was proposedbyHazraetal.[1]whichappliedsupportvector machine and logistic regression on a clinical data set of 422 lung CT scans. The research focused on lung cancer predictive modeling using advanced pre-processing methods such as multiple imputation and normalization, and subsequently, feature selection through Pearson correlation. Out of the two algorithms employed, logistic regression gave the best result with an accuracy value of 77.4%andSVMwasabletoachive76.2%accuracy.
IntheworkproposedbyAgarwaletal.[2],RandomForest was the best-performing algorithm among the studied machine learning methods for lung cancer detection and exposed an accuracy level of 92.3% followed by Decision Trees with 91% accuracy, SVM at 89.7% and Logistic Regression with 88.5% showing the importance of machinelearningalgorithmsforpredictivetasks.
Zhang et al. [3] employed support vector machines in detecting a subclass of lung cancer disorder, pneumoconiosis. This work revolves around improving modelswithcustomtailoredfeaturesubsets.
Verma et al. [4] analyzed the application of several classificationmethodologiesoverdifferenttypesofcancer. The analysis indicated that simple regression for quantile lung cancer detection attained an accuracy rate of 96.7 percent lung cancer quantile detection. This illustrates how machine learning algorithms perform well given a properconsolidateddataarrangement.
Aljuaid et al. [5] applied Convolutional Neural Networks (CNN) for feature extraction, while classification was performed using Artificial Neural Network(ANN) and Naive Bayes algorithm. The ANN classifier achieved an accuracy of 95%, outperforming Naive Bayes, which achievedonly78%.
Lim et al. [6 ] and Avci [7] proposed a hybrid model that utilized SVM as a classifier, which is effective in detecting interstitiallungdiseases.
Van Belle et al. [8] employed an SVM training strategy includingsupportvectorselectionandpolynomialkernels for classification of CT scans. This method is very useful when the data set contains high-dimensional medical images.
Weber et al. [9] employed FDG-PET/CT scan imaging to obtain chemotherapeutic responses while conducting a multicenter trial. This proposed work ensuresa match
between integrated imaging biomarkers and ML algorithm-basedpredictions.
These studies conclude that the ML algorithms make a huge mark in diagnosing lung cancer. However, the study stillshowsthattherearemanychallengestobeaddressed , such as data variability and subtype differentiation. Therefore, the model is built ensuring to avoid the above limitations and focus on precise and accurate detection ofthelungcancer.
The input data includes the lung CT scan images , which havebeencollectedfrom the local hospitals.All theseCT scan images have been annotated by expert radiologists after effective analyses, ensuring high clinical accuracy. Each image is labeled as one of the four categories, includingadenocarcinoma,largecellcarcinoma,squamous cellcarcinoma,andnormallung.
The data set was divided into three subsets to ensure effectivemodeldevelopment.
Training set: This part of the data set is used for training the model, enabling the model to learn discriminative featuresassociatedwithdiverselungcancerconditions.
Validation set: This part of the data set is used for finetuning the hyperparameters, avoiding the risk of overfitting.
Test set: This part of the data set helps in developing the models generalization ability on unseen data, thereby ensuringunbiasedassessment.
This form of data division ensures effective training and validationandtesting,reflectingthereal-worldscenarios.
The CT scan images were pre-processed to standardize andtunethemforanalysispriortomodeling.
All CT images were loaded onto the system with the OpenCVlibrary.Asthesearefilledwithalltheinformation from the scan, they will have to be processed later on grayscale images for simplicity and, most importantly, on majorrelevantstructuralfeatures.
Theprinciplesofpre-processingaretwo:
Resizing: Resizingallimagesintoafixedsizeofresolution 128 by 64 pixels. The resemblance further on proved less inthe run timeof theprocessorand gaveuniform images asinputtothemodel.
International Research Journal of Engineering and Technology (IRJET) e-ISSN: 2395-0056
Volume: 12 Issue: 05 | May 2025 www.irjet.net p-ISSN: 2395-0072
Grayscale Conversion: The color images converted into grayscale to exhibit a texture and edge distinction as intensity variations. As it is viewed, the color information willnotserveasusefulwhileanalyzinglungtissuesinthe CT, thus performing grayscale conversion allows one to focus mainly on significant density patterns and the structure.
Such pre-processing steps will improve and facilitate the extraction of features and simplify the entire process of learninginthemodel.
Featureextractionconvertstherawinputdataintoasetof measurable, indicative values, or features, that represent themostimportantcharacteristicsofthatdataforagiven task, such as classification, detection, or recognition. One of the most powerful techniques in this context is the HistogramofOrientedGradients(HOG).
Histogram of Oriented Gradients (HOG): A feature descriptor widely employed in computer vision. HOG captures object shapes and structural information by doinganalysisofedgedirectionsinthelocalizedregionsin animage.
The steps include: First, the image will be pre-processed, which also consists of resizing to a standard size such as 128×64 pixels, and applying grayscale. Then, calculations of gradients are done to find pixels that would change significantly in intensity, resulting into edges. Then, the image is further divided into small cell sizes (from 8 by 8 or 16 by 16 pixel sizes) for every cell producing an orientation histogram based on the gradient direction weighted by its magnitude. This process includes several steps involving group cells in overlapping blocks to normalize the histograms made invariant to variations in lightingorcontrast.Thenormativehistogramsaremerged into one vector where the numbers describe different structural features of the image. Clearly, the CT scan data has been distilled into a format that can be processed using conventional machine learning algorithms like SupportVectorMachine,LogisticRegression,orGaussian NaïveBayes,duetoitsnumericalstructure.Theclassifiers thatweretrainedandevaluatedwiththesefeaturesaimto distinguish adenocarcinomas from large cell carcinomas, squamous cell carcinomas, and lung conditions deemed normal.
Support Vector Machine (SVM), Logistic Regression, and Naive Bayes, all widely known, were used for the classificationprobleminthisresearchanalysis.Asaresult of the well-defined features obtained through methods likeHOG,themodelswereusedtoassesstheperformance of lung cancer image classification into adenocarcinoma,
large cell carcinoma, normal, and squamous cell carcinoma.
Support Vector Machine (SVM): Among various supervised learning algorithms, the one that is most powerful is the Support Vector Machine (SVM) algorithm. It constructs a hyperplane that separates the classes of data in a high dimension feature space. The margin maximizesspacebetweenclasses,thusenablingevenvery difficult datasets to be robustly classified.In comparison with the above discussed models, this study implemented a linear SVM model, which is effective when the feature space in terms of HOG features is linearly separable. The SVMclassifierbeingtrainedwithfeaturevectorsobtained from HOG evaluated its performance using validation and test datasets on various evaluation metrics such as accuracy, precision, recall, F1-score and confusion matrix. Thesemetricsprovidedfull-fledgeddetail ofhowwell the model was classifying the images into the respective categories. Therefore, with respect to its advantages in handling high-dimensional feature spaces and providing robust decision boundaries, SVM was expected to prove a convenientmethodforlungcancerclassification.
LogisticRegression:Definitionoflogisticregressionisthat it is a probabilistic model that defines the terms in which the input features are mapped to the probability of an outcome falling into a class. The output is a probability from a logistic function, which is mapped to one of the classes.Thistimearound,LogisticRegressionwastrained on the same HOG feature vectors and judged with the same metrics as SVM: accuracy, precision, recall, the F1 score,andconfusionmatrix.UnlikeSVM,whichfocuseson finding an optimal separating hyperplane, this is probabilistic framework predicting not just class labels but also confidence values for each prediction regarding the output. This probabilistic output can really come in handy in the medical domain when one needs to understand how confident the system is about a certaindiagnosis.
Naive Bayes: This classifier is based on Bayes' Theorem andassumestheconditionalindependenceofthefeatures given the class label. This assumption eases the classification task and makes Naive Bayes a computationally efficient algorithm. In this study, the Gaussian Naive Bayes classifier was applied, which assumes a Gaussian (normal) distribution of the features. Thisassumptionfitsverywellwiththecontinuousnature of the HOG features. After training the Naive Bayes classifieron the features extracted,validation,andtesting of the classifier was performed. Evaluation of the performance was done using the same evaluation measures as for the other classifiers: accuracy, precision, recall, F1-score, and confusion matrix. Though Naive Bayes assumes conditional independence among the features, it remained competitive computationally, with easeofimplementationarguingwellinitsfavor.
International Research Journal of Engineering and Technology (IRJET) e-ISSN: 2395-0056
Volume: 12 Issue: 05 | May 2025 www.irjet.net p-ISSN: 2395-0072
To evaluate the performance of the classification models, variousmetricswhicharestandardizedsuchasprecision, accuracy, recall, confusion matrix and F1-score are utilized.Theyhelpinprovidingusadeeperunderstanding about the usefulness and classification ability of lung cancerusingHOGfeaturesthroughthemodels.
1. Accuracy: It says how accurate the model has madewiththefollowingequation:
accuracy of 56%. This model showed a more balanced generalization acrossclasses compared to SVM. It maintainedhighrecallandF1-scorevaluesforthenormal classacrossbothvalidation(1.00recall,0.96F1-score)and test sets (0.96 recall, 0.75 F1-score), suggesting robustness in identifying non-cancerous samples. However, its performance on adenocarcinoma and squamouscellcarcinomaremainedmoderate.
2. Precision:Theoveralldepictedrateofpositivesis givenbyprecisionandtheequationis:
The Naive Bayes classifier demonstrated the lowest accuracy during training, achieving 82.38%, while the accuracies for validation and testing were 69% and 44%, respectively.The model’s simplistic probabilistic assumptions led to significant reductions in predictive performance, particularly on complex or overlapping features. For example, its test F1-score for adenocarcinoma was only 0.37, and for squamous cellcarcinoma, it was 0.36, underscoring its limited capability in handling the intricacies of HOG-based features.
3. Recall: It gives the correctly predicted class with thefollowingequation:
SVMREPORT
Table -1: ValidationClassificationReportforSVM
4. F1 score: When the accuracy of Recall and Precision istaken,the resultisF1score, given by thefollowingequation:
The performance of the three supervised models i.e. Support Vector Machine (SVM), Logistic Regression, and Naïve Bayes has been evaluated through this study. Using an appropriate dataset all the mentioned models were trained,validated,andtestedsystematically.Toassessthe model’s robustness and classification efficiency, different key performance metrics like confusion matrix, precision, F1 score and recall were used for evaluation. When the three models were compared among each other, SVM model showed a great training accuracy of 96.41%, with 74% and 55% as its respective validation and testing accuracy. Although it demonstrated a high level of precision and recall for the normal and large cell carcinoma categories, its performance weakened on squamous cell carcinoma and adenocarcinoma in the test dataset, revealing a tendency to overfit despite strong training results. In particular, the SVM obtained a validation F1-score of 0.92 for the normal class and 0.79 forlargecellcarcinoma,whiletheF1-scoresonthetestset significantlydecreasedto0.84and0.47,respectively.
LogisticRegressionreachedatrainingaccuracyof96.08%, along with a validation accuracy of 78% and a test
Table -2: TestClassificationReportforSVM
International Research Journal of Engineering and Technology (IRJET) e-ISSN: 2395-0056
Volume: 12 Issue: 05 | May 2025 www.irjet.net
LOGISTICREGRESSIONREPORT
Table -3: ValidationClassificationReportforLogistic Regression
Table -4: TestClassificationReportforLogistic Regression
Table -6: TestClassificationReportforNaiveBayes
Table -5: ValidationClassificationReportforNaiveBayes
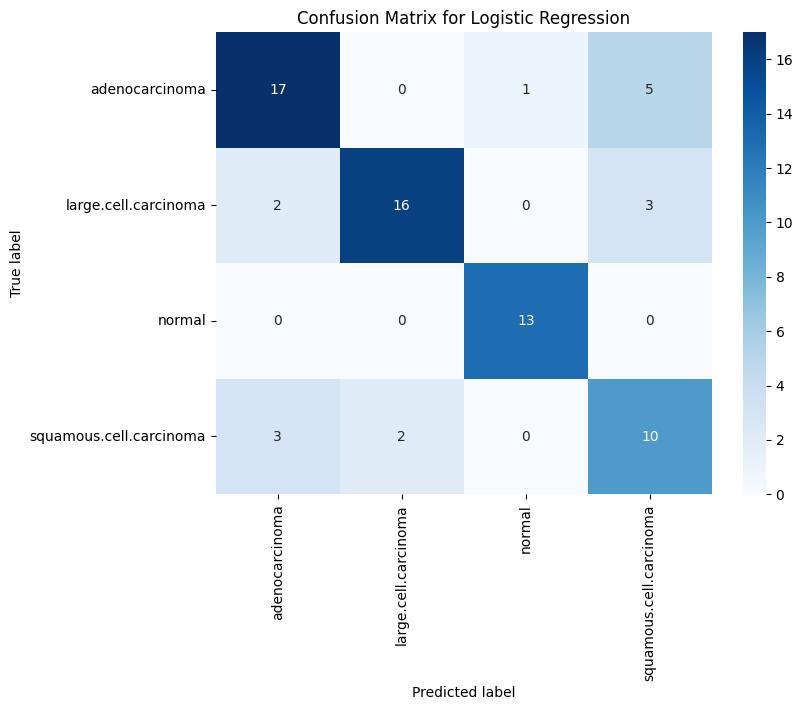
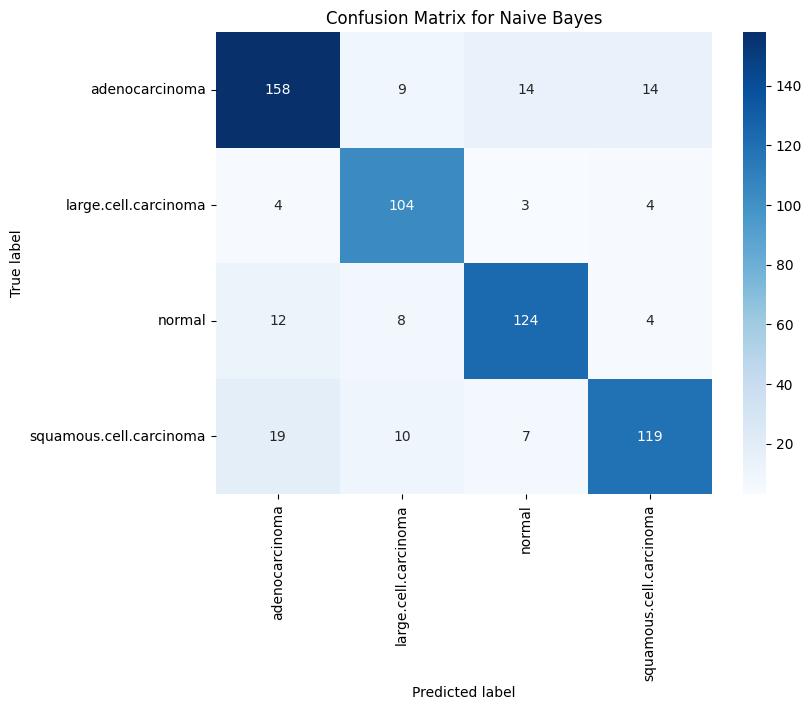
Confusion Matrix Analysis: Analysis of the confusion matrices revealed that the SVM classifier produced the fewestfalsepositivesandfalsenegativesinthevalidation set, Logistic Regression showed consistent performance withfewermisclassificationsinthenormalclassandlarge cellcarcinoma but struggled similarly with squamous cellcarcinoma. In contrast, the Naive Bayes model demonstrated a higher rate of misclassification across all classes during testing, indicating its relatively weak generalizationcapability.
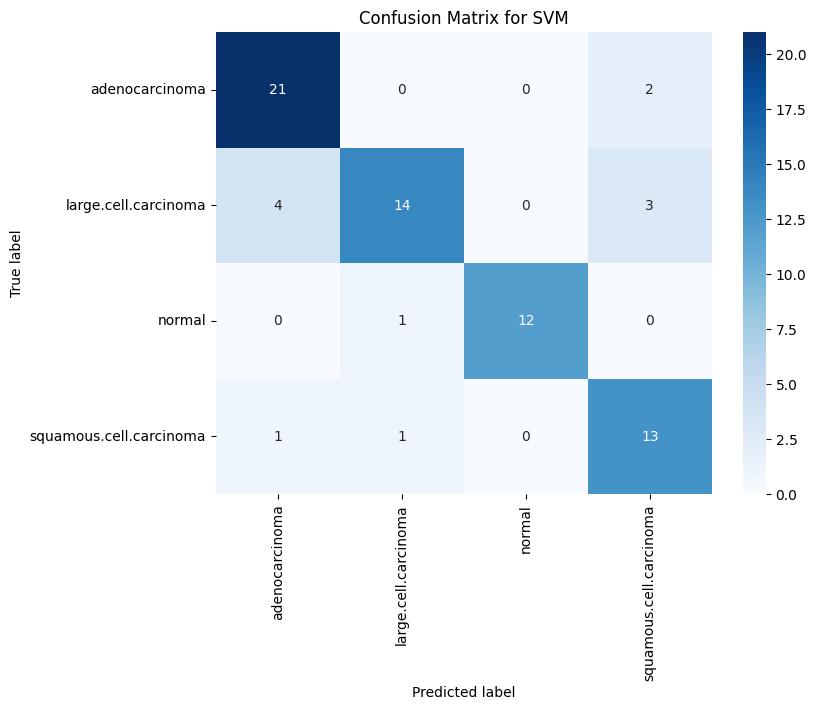
Fig -1: ValidationConfusionMatrixforSVM
International Research Journal of Engineering and Technology (IRJET) e-ISSN: 2395-0056
Volume: 12 Issue: 05 | May 2025 www.irjet.net p-ISSN: 2395-0072
-2: ValidationConfusionMatrixforLogisticRegression
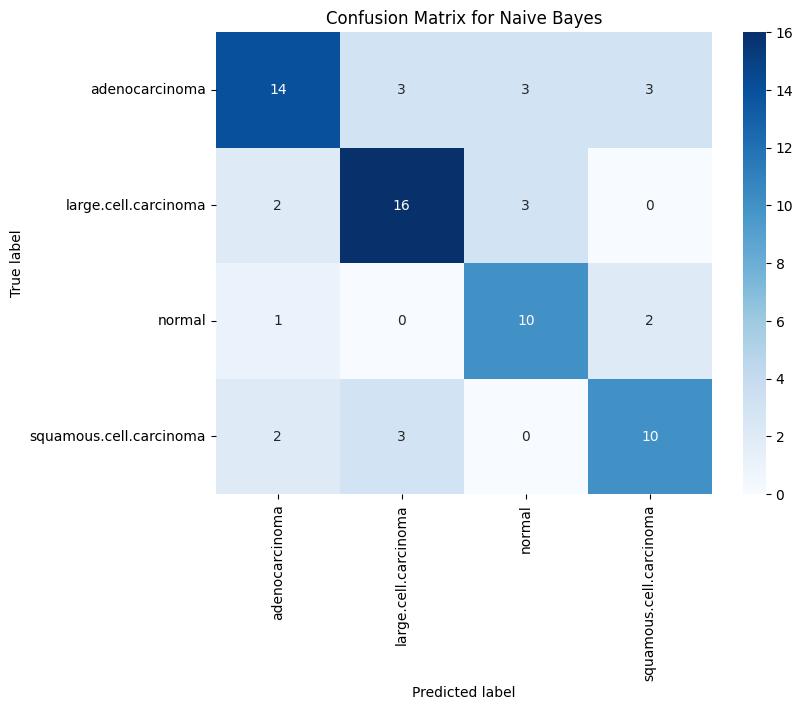
Fig -3: ValidationConfusionMatrixforNaiveBayes
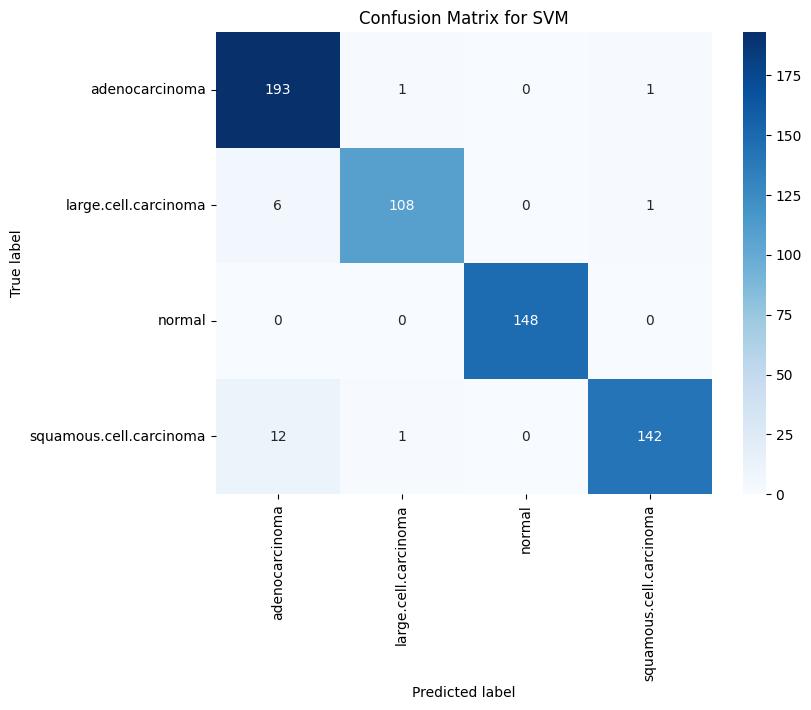
Fig -4: TrainingConfusionMatrixforSVM
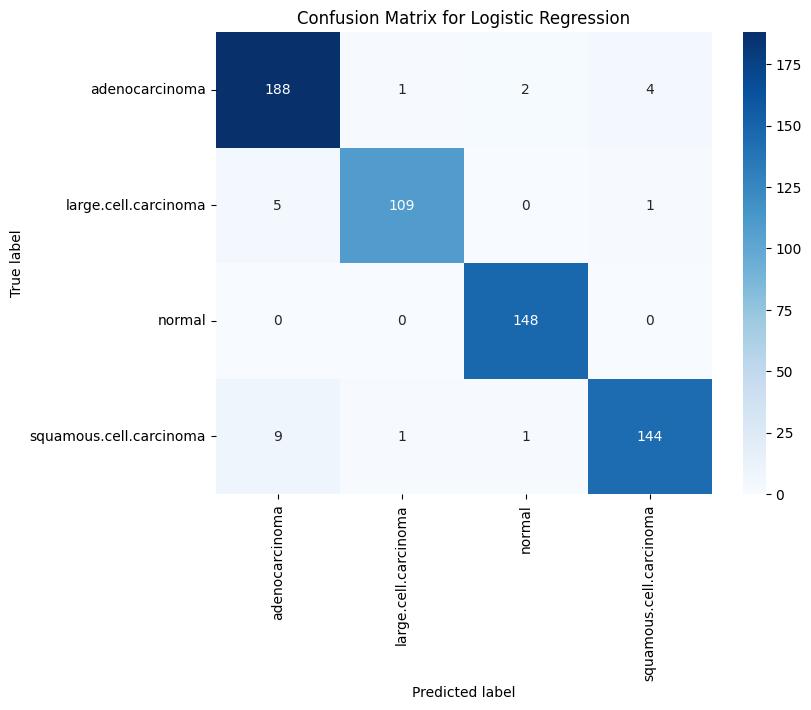
Fig -5: TrainingConfusionMatrixforLogisticRegression
International Research Journal of Engineering and Technology (IRJET) e-ISSN: 2395-0056
Volume: 12 Issue: 05 | May 2025 www.irjet.net p-ISSN: 2395-0072
This research introduces an organized and modular method for identifying and measuring tumor nodules in computed tomography (CT) scans by utilizing a blend of image processing techniques and morphological analysis. The proposed methodology aims to pinpoint possible tumorareas,extractpertinentmorphologicalfeatures,and deliver a thorough quantification expressed in medically meaningfulterms.
To start, CT scans are transformed to grayscale to ensure uniform processing. Segmentation of the images is done with Otsu’s thresholding method, which determines the best global threshold level by considering the variance between the foreground and background level of light. This processes aids in separating bright tumor-like regions from the surrounding tissues enabling the formationofabinaryimageoftheareasofprimaryfocus.
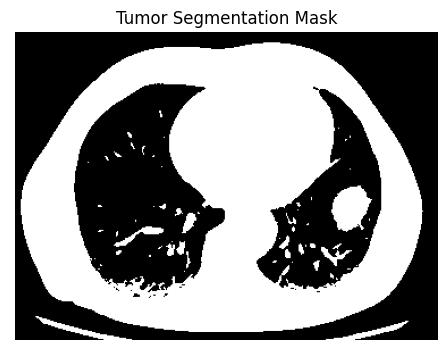
Following the segmentation process, individual prospectivetumorsaredistinguishedbythesegmentation oftheconnectedblobregions.Morphologicalattributesof each component are evaluated, including area along with eccentricityandothershapefactors,todistinguishtumorlike structures from non-relevant noisy regions. A filter is applied to retain only those regions whose shapes and complexities coincide with those expected of a tumor, largelyreducingerroneouspositives.
Foreachoftheconfirmedregions,somegeometricvalues representing length, width, radius, diameter and area are captured. These values are then transformed from pixel measurements into standard medical measurement of micrometers, millimeters and centimeters with defined spatial resolution values. This information provides a quantitative assessment of tumor nodules thereby improvingtheirclinicalinterpretation.
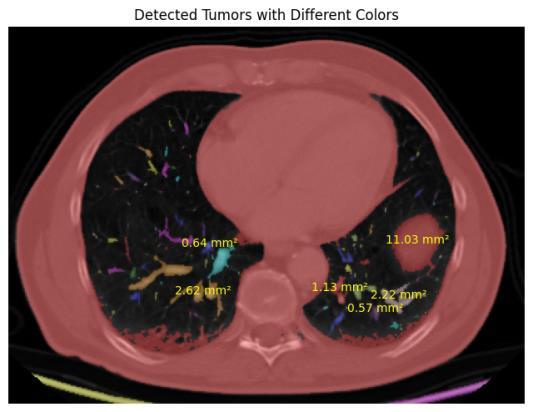
The entire catalog of morphological characteristics is structured to give relevant information regarding the size andsculptingofatumor.This,apartfromaidingdetection, will in the future assist in diagnosis, treatment planning, and disease progression monitoring. Moreover, the features which are obtained can be used along with extraction processes to aid in classification and advanced analysispredictiveanalyticsinimaging.
International Research Journal of Engineering and Technology (IRJET) e-ISSN: 2395-0056
Volume: 12 Issue: 05 | May 2025 www.irjet.net p-ISSN: 2395-0072
This study demonstrated the effectiveness of computerbased techniques on the detection of lung cancer from CT scans. While Naive Bayes was the most computationally simple to execute, SVM achieved the highest training accuracy of 96.41% followed closely by Logistic Regressionwith96.08%.Apartfromclassification,certain segmentation and preprocessing methodologies were utilized to refine the delineation of tumor areas to ensure accuracy. The approach has the potential to improve and streamline real-world clinical decision-making and support early diagnosis. The proposed approach shows strong potential for enhancing early diagnosis and supporting clinical decision-making in real-world health caresettings.
[1] A. Hazra, B. Mitra, and S. Roy, "Lung cancer survivability prediction using SVM and logistic regression," International Journal of Healthcare InformationSystemsandInformatics,vol.12,no.4,pp.1–12,2017.
[2]S.Agarwal,S.Thakur,andA.Chaudhary,"Performance evaluationofmachinelearningtechniquesforlungcancer prediction,"InternationalJournalofAdvancedResearchin ComputerScience,vol.10,no.5,pp.42–47,2019.
[3] R. Zhang, G.-B. Huang, N. Sundararajan, and P. Saratchandran,"Detectionofpneumoconiosisusingsubset featuresandsupportvectormachines," NeuralComputing andApplications,vol.19,pp.543–550,2010.
[4] A. Verma, R. Singh, and S. Rathore, "Comparative analysisofdataminingclassificationalgorithmsforcancer prediction,"ProcediaComputerScience,vol.132,pp.400–408,2018.
[5] M. Aljuaid, A. Almotiri, and A. Khan, "A hybrid deep learningapproachforlungcancerclassificationusingCNN and ANN," Computational Intelligence and Neuroscience, vol.2022,ArticleID2154879,2022.
[6] J. Lim, N. Kim, J. Seo, Y. Lee, Y. Lee, and S.-H. Kang, "ImproveddiagnosisofinterstitiallungdiseaseusingSVM on high-resolution CT images," Medical Imaging and Diagnosis,vol.33,no.2,pp.151–158,2020.
[7] E. Avci, "A new approach for lung disease diagnosis using SVM and image texture analysis," Expert Systems withApplications,vol.36,no.4,pp.7610–7615,2009.
[8] V. Van Belle, K. Pelckmans, S. Van Huffel, and J. Suykens,"Improvedsupportvectormachineclassifiersfor high-dimensional data using kernel-based learning," IEEE
Transactions on Neural Networks, vol. 22, no. 6, pp. 984–995,Jun.2011.
[9] W. A. Weber et al., "Repeatability of 18F-FDG PET/CT in advanced non-small cell lung cancer: prospective assessment in 2 multicenter trials," Journal of Nuclear Medicine,vol.56,no.8,pp.1137–1143,2015.