
International Research Journal of Engineering and Technology (IRJET) e-ISSN: 2395-0056
Volume: 12 Issue: 11 | Nov 2025 www.irjet.net p-ISSN: 2395-0072
International Research Journal of Engineering and Technology (IRJET) e-ISSN: 2395-0056
Volume: 12 Issue: 11 | Nov 2025 www.irjet.net p-ISSN: 2395-0072
Fahad Mesfer F Alsubaie 1 , Awad Anis Abdullah1
1College of Computing, Fahad Bin Sultan University, Saudi Arabia ***
Abstract - This study analyzes the average daily water consumption per capita across Saudi Arabia’s thirteen regionsin2022usingdatafromtheSaudiOpenDataPortal.
The dataset, managed by the Ministry of Environment, Water and Agriculture, was cleaned and visualized through Google Sheets and Looker Studio. An interactive dashboard with bar and pie charts highlights regional differences, showing the Central and Eastern regions with the highest consumption and Najran and Asir with the lowest. The results demonstrate how visual analytics can enhance understanding of national water use and support sustainability efforts. The designed dashboard is analyzed fromsecurityandprivacyperspectives.
Key Words: Water Consumption, Saudi Arabia, Data Visualization, Google Looker Studio, Sustainability, Security,Privacy
1. INTRODUCTION
Waterisoneofthemostcriticalnaturalresourcesfor human survival and economic growth. In Saudi Arabia, water sustainability has become a key national priority due to limited natural freshwater sources and increasing population demands [1]. This study explores official data published by the Ministry of Environment, Water and Agriculture, which reports the average daily per capita water consumption across the Kingdom’s regions for 2022.
The objective is to analyze this data using modern data visualization tools and highlight consumption differences among regions. By building an interactive dashboard,thisprojectaimstosimplifytheunderstanding of national water use and demonstrate how data visualization can support environmental awareness and policyplanning.
1.1
Water is an essential natural resource, and its sustainable use is a growing global concern. In Saudi Arabia,thescarcityofnatural freshwaterresourcesmakes efficient consumption a top national priority [2]. The goal of this project is to analyze the average daily water consumption per capita across the thirteen administrative regionsoftheKingdomfortheyear2022andvisualizethe findingsthroughaninteractivedashboard.
1.2
Understanding regional differences in water consumption is critical for developing informed conservation strategies. Although national averages are available,regional variationsare noteasilyinterpretedby the general public or policy makers. Therefore, this study leveragesopengovernmentdataandmodernvisualization tools to present regional consumption patterns in a clear andaccessibleform.
This section is structures so that it presents a description about used data set and its resource, connection data set with dashboard, and visualization of data.
Thedatasetusedinthisstudy,entitled“AverageDaily Water Consumption per Capita for All Regions of the Kingdom(2022),”wasobtainedfromtheSaudiOpenData Portal managed by the Ministry of Environment, Water, and Agriculture [3]. It contains 13 entries, each representing one administrative region of Saudi Arabia, and two attributes: Region and Average Daily Per Capita Consumption (Liters/day). The file was cleaned in Google Sheets by removing empty rows, translating Arabic headers to English, standardizing region names, and verifyingvaluesagainsttheministrysource.
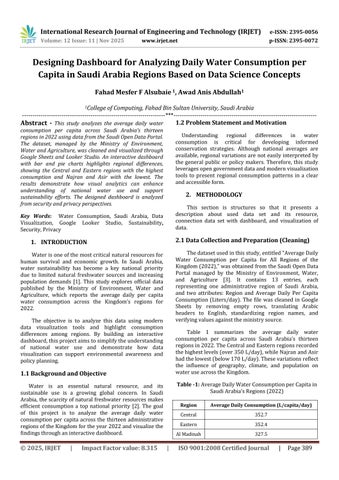
Table 1 summarizes the average daily water consumption per capita across Saudi Arabia’s thirteen regionsin2022.TheCentralandEasternregionsrecorded thehighestlevels(over350L/day),whileNajranandAsir hadthelowest(below170L/day).Thesevariationsreflect the influence of geography, climate, and population on wateruseacrosstheKingdom.
Table -1: AverageDailyWaterConsumptionperCapitain SaudiArabia’sRegions(2022)
International Research Journal of Engineering and Technology (IRJET) e-ISSN: 2395-0056
Volume: 12 Issue: 11 | Nov 2025 www.irjet.net p-ISSN: 2395-0072
The Bar chart ranks the 13 administrative regions by their average daily water consumption per capita. The Central and Eastern regions recorded the highest consumption, while Najran and Asir had the lowest. The chartallowsforeasyvisualcomparisonacrossregions.
Figure 2 illustrates the overall designed dashboard based on combination of the data represented by the Bar chart,Piechart,andLabelsofdata.
ThecleaneddatasetwasuploadedtoGoogleSheetsand connectedtoGoogleLookerStudiousingtheGoogleSheets connector [4]. The fields were configured as: Dimension = Regions, Metric = Average daily per capita consumption (Liters/day). Two visualizations methods were produced: (i)averticalbarcharttorankregionsbyconsumption;and (ii) a pie chart to show the proportional share of each region. Both charts were assembled into a single dashboardforside-by-sideinterpretation.
The dataset provides the foundation for the visual analyses presented in the following sections, allowing regional trends to be interpreted more effectively through the accompanying charts and dashboard visualizations. Figure1illustratesthedatasetintermsofhistogram(i.e., regionsagainstaverageoffalls).
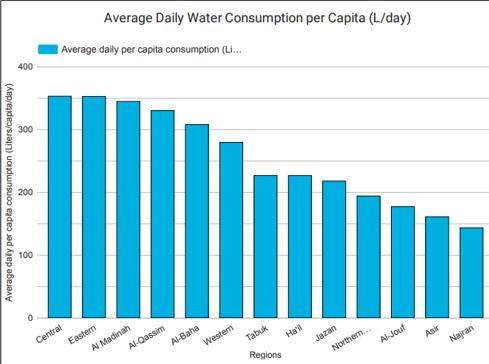
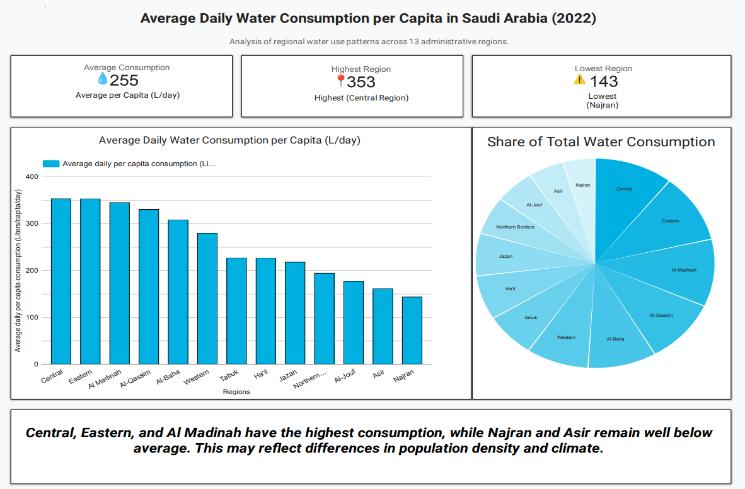
Fig -2:Dashboardshowingregionalcomparisonofwater consumption(KSA,2022)
The Looker Studio dashboard combines bar and pie charts to visualize both ranking and proportional share of waterconsumptionamongall13regions,whereresultsare collectedautomaticallyinthreelabelsofdata.Ithighlights regional variation, supporting data-driven insights for sustainabilityawarenessandplanning.
The combination of Table-1, Figure 1, and Figure 2 provides a complete view of regional water consumption patternsinSaudiArabia.Thetablepresentstherawvalues from the official dataset, while the bar chart emphasizes differencesbetweenregions,andthedashboardintegrates both charts into an interactive visualization. Together, these tools illustratehow data visualizationcan transform numerical data into clear, interpretable insights that supportdecision-makingandsustainabilityawareness.
Thissection provides results of dashboard with details related to the average of water falls and their exploration. Then,adiscussionbasedonsecurityandprivacyofdataie presented.
The dashboard visualization clearly highlights regional differencesinwaterconsumptionacrossSaudiArabia.The
International Research Journal of Engineering and Technology (IRJET) e-ISSN: 2395-0056
Volume: 12 Issue: 11 | Nov 2025 www.irjet.net p-ISSN: 2395-0072
Central (352.7 L/day) and Eastern (352.4 L/day) regions recordedthehighestpercapitaconsumption,whileNajran (143.2L/day)andAsir(160.8L/day) reportedthelowest. The overall national average was approximately 299 L/day.Thesevariationscanbeattributedtofactorssuchas urbanization,industrialactivities,andclimatedifferences.
The interactive Looker Studio dashboard allows for clear comparison across regions and provides a datadriven foundation for water sustainability awareness and policydiscussions.
Securityisanimportantaspectindatascience,whereit mustbeprotectedduringdataanalyzingandpresenting.As the data obtained from internet, some web application security controls can be applied for the purpose of protection [5]. This work can be enhanced when taking into consideration such techniques. Moreover, the data collection,analyzing,andcleaningcanbedoneusingsmart agents [6]. However, security of agents is critical if taking intoaccountthathostmachinescanactasmaliciousparty. Inthework [7],amethodcanbeusedtoenhancesecurity ofthedashboardbygeneratingmultipletasks(oneofthem isreal andtherestarefalse). Furthermore,selfprotection approach [8] can be implemented to enable more data protection level using encryption method. Since designing dashboardsisstronglylinkedwith bigdata anditsrelated techniques. data mining methods accompanied with securitymethodscanbeusedtoenhancethesecuritylevel ofpresenteddatawithinthedashboard[9].
As for privacy of data, protection privacy of both information of users and sensitive data is important. The privacy issue can be highlighted through the following scenario:
1. Usersarerequestedtocreateaccountstologinthe dashboard. In this step, personal information are entered, suchasID,Address, Age,Affiliations, and interests.
2. After creating accounts, login can be performed usingsmartmobilesbasedonlocationofusers.
3. Queries are performed on the dashboard to retrieveresults.
4. Resultsaredisplayedondashboardalongwiththe personalinformation.
The previous scenario reveals some privacy issues relatedtothedashboard,whichcanbelistedasfollows:
1. For the first step, personal information can be tracked by attackers. Attackers can collect sensitive data about users and may use them
later for blackmail for an example. Actually, work [10] presented a comprehensive study relatedtoprivacyissue.
2. For second step, locations of users using GPS canbetrackedandanalyzedbyattackers,which leadstoaprivacyconcern.Inthiscontext,some enhancement can be done using some approaches provided in [11-13] as well as enhancing power consumption when execution ofthedashboardonmobiledevices.
3. Forthirdstep,analyzingofsentqueriesmaybe analyzed and linked to the ID of users, and opens door for attackers to collect more personal data about users. In this aspect, enhancement on the dashboard can be performedusingthemethodpresentedinwork [14].
4. For last step, obtaining and visualizing data on the dashboard can be presented using deep learning techniques. In this context, some approaches can be performed to enhance the quality of the dashboard and its privacy level usingwork[15]foranexample.
This study demonstrated how open data combined with visualization tools can simplify understanding of national water consumption patterns. The Central and Eastern regionsshowedthehighestper-capitausage,whileNajran andAsirshowedthelowest.TheLookerStudiodashboard offers an accessible way to present data and encourages better awareness of regional disparities. Many security and privacy issues are addressed with some proposed methodsforthepurposeofenhancement.
[1] Alotaibi, Bader Alhafi, et al. "Water scarcity management to ensure food scarcity through sustainable water resources management in Saudi Arabia."Sustainability15.13(2023):10648.
[2] Alodah, Abdullah. "Towards sustainable water resources management considering climate change in the case of Saudi Arabia."Sustainability15.20 (2023): 14674.
[3] SADAIAwebsite.Online[Available]:
(accessed November1,2025).
[4] Asher,Jansnio,andEkaPutriRachmawati."Visualisasi Data Operasi SAR BASARNAS Di Indonesia Menggunakan Google Looker Studio."The Indonesian JournalofComputerScience13.2(2024).
International Research Journal of Engineering and Technology (IRJET) e-ISSN: 2395-0056
Volume: 12 Issue: 11 | Nov 2025 www.irjet.net p-ISSN: 2395-0072
[5] Albarrk, Majed Abdullah, and Mohamad Shady Alrahhal. "Web Applications Security: More Collaboration."(2020).
[6] Bandar Alluhaybi, Mohamad Shady Alrahhal, Ahmed Alzhrani and Vijey Thayananthan. “A Survey: Agentbased Software Technology Under the Eyes of Cyber Security, Security Controls, Attacks and Challenges”. International Journal of Advanced Computer Science and Applications (IJACSA) 10.8 (2019). http://dx.doi.org/10.14569/IJACSA.2019.0100828
[7] Alluhaybi, Bandar, et al. "Dummy-based approach for protecting mobile agents against malicious destinationmachines."IEEEAccess8(2020):129320129337.
[8] Alluhaybi,Bandar,etal."Achievingself-protectionand self-communication features for security of agentbasedsystems."(2020).
[9] Alrahhal, Mohamad Shady, and Adnan Abi Sen. "Data mining, big data, and artificial intelligence: An overview,challenges,andresearchquestions."(2018).
[10] Alrahhal, Mohamad Shady, Maher Khemakhem, and Kamal Jambi. "ASURVEY ON PRIVACYOFLOCATIONBASED SERVICES: CLASSIFICATION, INFERENCE ATTACKS, AND CHALLENGES."Journal of Theoretical &AppliedInformationTechnology95.24(2017).
[11] Mohamad Shady Alrahhal,Muhammad Usman Ashraf, Adnan Abesen and Sabah Arif. “AES-Route Server ModelforLocationbasedServicesinRoadNetworks”. International Journal of Advanced Computer Science and Applications (IJACSA) 8.8 (2017). http://dx.doi.org/10.14569/IJACSA.2017.080847
[12] Alrahhal,Hosam,etal."Asymbioticrelationshipbased leader approach for privacy protection in location based services."ISPRS International Journal of GeoInformation9.6(2020):408.
[13] Alrahhal, Mohamad Shady, Maher Khemekhem, and Kamal Jambi. "Achieving load balancing between privacy protection level and power consumption in location based services."International Research Journal of Engineering and Technology5.3 (2018): 619-625.
[14] Mohamad Shady Alrahhal, Maher Khemakhem and Kamal Jambi. “Agent-Based System for Efficient kNN Query Processing with Comprehensive Privacy Protection”. International Journal of Advanced Computer Science and Applications (IJACSA) 9.1 (2018). http://dx.doi.org/10.14569/IJACSA.2018.090108
[15] Abdullah S. Alyousef, Karthik Srinivasan, Mohamad Shady Alrahhal, Majdah Alshammari and Mousa AlAkhras. “Preserving Location Privacy in the IoT against Advanced Attacks using Deep Learning”. International Journal of Advanced Computer Science and Applications (IJACSA) 13.1 (2022). http://dx.doi.org/10.14569/IJACSA.2022.0130152
2025, IRJET | Impact Factor value: 8.315 | ISO 9001:2008