
International Research Journal of Engineering and Technology (IRJET) e-ISSN:2395-0056
Volume: 12 Issue: 04 | Apr 2025 www.irjet.net p-ISSN:2395-0072
International Research Journal of Engineering and Technology (IRJET) e-ISSN:2395-0056
Volume: 12 Issue: 04 | Apr 2025 www.irjet.net p-ISSN:2395-0072
CH. kishore1, CH. Ramesh2, M. Durgaprasad3, M. Shivaprasad4 , B. Prudvi Rani5
1234 Students, Department of Civil Engineering, Sanketika Vidya Parishad Engineering College Visakhapatnam, A.P, India.
5 professor department of civil Engineering, sanketika vidya parishad engineering college Visakhapatnam, A.p, india.
Abstract - This study analysis traffic flow patterns between Maddilapalem and Pothinamallayapalem, a vital urban corridor experiencing increasing vehicular congestion. Data was collected through vehicle counts, speed monitoring, and GPS-based surveys during peak and off-peak hours. The primary focus was to identify traffic volume, peak hours, and factors contributing to delays After analyzing the traffic flow and the capacity of NH-16 from maddilapalem to Pothinamallayapalem some of the important improvements are required which will suggested in my research which will help to control the traffic volume and the capacity of NH-16. In this I will also estimate the fuel cost which are waste due to traffic signals.
Key Words: trafficvolume,PCU,(passengercarunit) Averagedailytraffic,delay,fuelconsumption
The findings will help in estimating the Level of Service (LOS) and identifying potential bottlenecks or congestion points. Based on the analysis, recommendations can be made for improving traffic management, optimizing signal timing, and proposing future infrastructural upgrades. The study plays a vital role in enhancing road safety, reducing travel time, and improving the overall efficiency of the transportation system in the region. Traffic flow studies are accompanied to determine the number, movement and type of vehicles at a given location. Traffic flow analysis helps to improve the capacity of flow. Traffic flow concepts to also describe in the mathematically way the vehiclesbetweenanddriver.
L B Zala et al. (2014) in this the author calculated the different type of traffic parameters of a selected area on theconceptofpreviousparametersofthatareawhichthe author selects. Author conducted different type of analysis like traffic volume, speed etc. also find the capacityoftheroad.
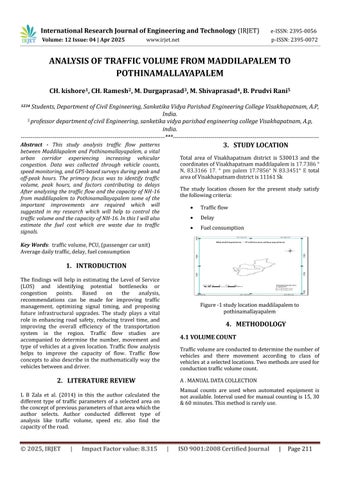
Total area of Visakhapatnam district is 530013 and the coordinatesofVisakhapatnammaddilapalemis17.7386° N, 83.3166 17. ° pm palem 17.7856° N 83.3451° E total areaofVisakhapatnamdistrictis11161Sk
The study location chosen for the present study satisfy thefollowingcriteria:
Trafficflow
Delay
Fuelconsumption
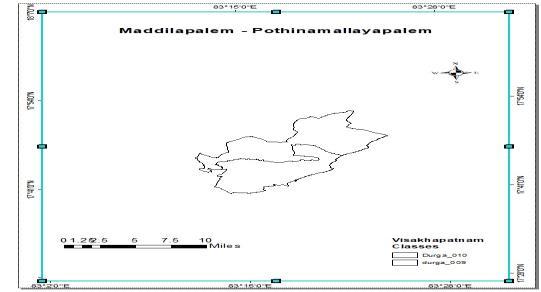
Figure-1studylocationmaddilapalemto pothinamallayapalem
Trafficvolumeareconductedtodeterminethenumberof vehicles and there movement according to class of vehiclesataselectedlocations.Twomethodsareusedfor conductiontrafficvolumecount.
Manual counts are used when automated equipment is notavailable.Intervalusedfor manualcountingis15,30 &60minutes.Thismethodisrarelyuse
Volume: 12 Issue: 04 | Apr 2025 www.irjet.net
(TrafficdataofSaturday(22/02/2025)
thefollowingaregraphswhichshowsthedailyhourwisetrafficvolumedatainPUC
(TrafficdataofSunday(23/02/2025) Table3.2.2
Volume: 12 Issue: 04 | Apr 2025 www.irjet.net
(TrafficdataofTuesday(25/02/2025)
Table3.2.4
Table3.2.5
Volume: 12 Issue: 04 | Apr 2025 www.irjet.net
Table3.2.7
(TrafficdataofSaturday(01/03/2025) Table3.2.8
(TrafficdataofSunday(02/03/2025) Table3.2.9
Volume: 12 Issue: 04 | Apr 2025 www.irjet.net
(TrafficdataofMonday(03/03/2025)
Table3.2.10
(TrafficdataofTuesday(04/03/2025)
Table3.2.11
(TrafficdataofWednesday(05/03/2025)
Table3.2.12
Volume: 12 Issue: 04 | Apr 2025 www.irjet.net
Table3.2.13
(TrafficdataofFriday(07/03/2025)
Table3.2.14
Trafficdelayreferstotheextratimespentbyvehiclestravelingona roadcomparedtothetimeitwouldtakeunderfreeflow conditions. It occurs due to factors such as congestion, traffic signals, accidents, road maintenance, or poor road conditions.
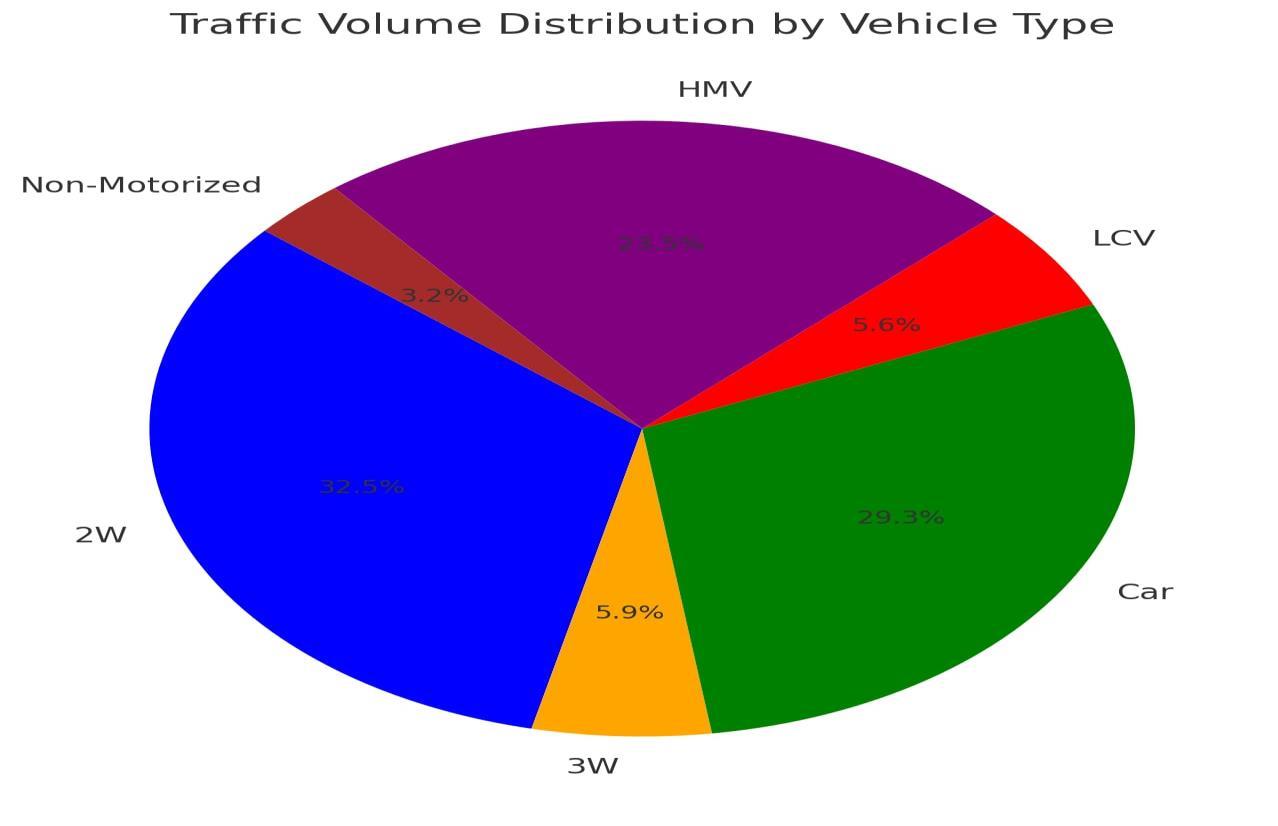
DelayVehicleperminute
Delay Vehicle per minute value as per IRC for different vehicle which is shown in Fig.No.13 delay time forvehiclesfor non-motorised,2W,3W,Car,LCV,HMVare32.5,5.9,29.3,5.6,23.5
International Research Journal of Engineering and Technology (IRJET)
Volume: 12 Issue: 04 | Apr 2025 www.irjet.net p-ISSN:2395-0072
5.3.2Delayinvehicleperhour(day-1)
5.3.3Delayinvehicleperhour(day-2)
International Research Journal of Engineering and Technology (IRJET) e-ISSN:2395-0056
Volume: 12 Issue: 04 | Apr 2025 www.irjet.net p-ISSN:2395-0072
Table5.3.4Delayinvehicleperhour(day-3)
Typeofvehicle No
Typeofvehicle No
Table5.3.5Delayinvehicleperhour(day-4)
Table5.3.6Delayinvehicleperhour(day-5)
Typeofvehicle Noofvehicles
Table5.3.7Delayinvehicleperhour(day-6)
Typeofvehicle Noofvehicles
International Research Journal of Engineering and Technology (IRJET) e-
Volume: 12 Issue: 04 | Apr 2025 www.irjet.net p-ISSN:2395-0072
Table5.3.8Delayinvehicleperhour(day-7)
Table5.3.9Delayinvehicleperhour(day-8) Type
Typeofvehicle No
Table5.3.10Delayinvehicleperhour(day-9)
Table5.3.11Delayinvehicleperhour(day-10)
Typeofvehicle Noofvehicles
International Research Journal of Engineering and Technology (IRJET) e-
Volume: 12 Issue: 04 | Apr 2025 www.irjet.net p-ISSN:2395-0072
Table5.3.12Delayinvehicleperhour(day-11)
Typeofvehicle No
Typeofvehicle Noof
Table5.3.13Delayinvehicleperhour(day-12)
Table5.3.14Delayinvehicleperhour(day-13)
Typeofvehicle Noofvehicles
Table5.3.15Delayinvehicleperhour(day-14)
Typeofvehicle Noofvehicles
International Research Journal of Engineering and Technology (IRJET) e-ISSN:2395-0056
Volume: 12 Issue: 04 | Apr 2025 www.irjet.net p-ISSN:2395-0072
Traffic Volume Assessment: The investigation determined that the corridor from Maddilapalem to Pothinamallayapalem along NH-16 exhibits a substantial traffic volume, with a peak Passenger Car Unit (PCU) valueof4795.9PCU/hrrecordedduringthestudyperiod.
TemporalDistributionofPeakFlows:Dataanalysisrevealeddistinctpeaktrafficperiods,predominantlyoccurring between 08:00–09:00 and 16:00–17:00 across the surveyed days from 22 February to 7 March 2025. The maximum traffic intensity was observed on 24 February 2025 (Monday) at 04:00–05:00, reflecting variability influencedbydailyactivitypatterns
DelayQuantification:Thestudyquantified vehiculardelaysattributable totrafficsignalsandcongestion,withan average delay of 1556.202 PCU/hr for heavy motor vehicles (HMVs) and a cumulative passenger delay of 99,596.92 hours per day for HMVs alone. Annualized delay estimates indicate an average of 214.3 hours per passengerperyear,highlightingsignificanttimelossesinthetransportnetwork.
Fuel Consumption and Economic Impact: Results indicate an annual idle fuel consumption of 98,757.62 liters of petrol and 18,381.49 liters of diesel due to congestion-induced idling. This translates to an economic cost of approximatelyINR 12,115,476.6,calculatedatprevailingfuel rates(INR 105/literforpetrol andINR 95/liter for diesel),emphasizingthefiscalburdenofinefficienttrafficflow.
High Traffic Congestion Identified: The study reveals significant traffic congestion along the urban corridor from MaddilapalemtoPothinamallayapalem,acriticalstretchonNH-16inVisakhapatnam.
Peak Hours Established: The analysis identifies peak traffic hours as varying slightly day-to-day but predominantly occurringbetween8:00AMto9:00AMand4:00PMto5:00PM,withthehighestrecordedPassengerCarUnit(PCU)value reaching4795.9PCU/hr.
SignificantDelaysDuetoSignals:Trafficsignalscontributesubstantiallytodelays,withvehiclesexperiencingextratravel time compared to free-flow conditions. The study quantifies this delay, noting an average delay of 214.3 hours per passengerperyearoncertaindays
Fuel Wastage Quantified: Congestion leads to considerable fuel wastage, estimated at 98,757.62 liters of petrol and 18,381.49 liters of diesel annually. This translates to an economic loss of approximately 12.1 million INR per year, calculatedusingfuelpricesof105INRperliterforpetroland95INRperliterfordieselasof2025.
Proposed Improvements: The study suggests improvements such as optimizing signal timing, enhancing traffic management strategies, and potential infrastructural upgrades (e.g., overbridges at crossings) to reduce congestion, save fuel, and decrease travel delays. These measures aim to improve the Level of Service (LOS) and overall transportation efficiency.
XuLuhang(2015)“AresearchofDatamininginTrafficFlowData”ShandongUniversity.
Dr.LBZALA(2014)“Trafficflowcharacteristicsfortheheterogeneoustrafficonurbanroad”BVMEngineeringCollege,Gujrat, India.
International Research Journal of Engineering and Technology (IRJET) e-ISSN:2395-0056
Volume: 12 Issue: 04 | Apr 2025 www.irjet.net p-ISSN:2395-0072
GeetamTiwari(1999)“RoadDesignforImprovingTrafficFlow”INDIANINSTITUEOFTECHNOLOGY,Delhi,India.
Babitha Elizabeth Philip (2014) “Traffic flow Modelling and study of Traffic Congestion” Toc H Institute of Science and Technology,Keral,India.
GeetamTiwari(2003)“TrafficFlowandsafetyinnewmodelsforHeterogeneousTraffic”
S.Yamuna (2014) “Study of Traffic flow characteristics for heterogeneous traffic”, Rajeev Gandhi Memorial College of EngineeringandTechnology,Nandyal,AndhraPradesh,India.
ShekharK.Rahane(2014)“Trafficcongestioncausesandsolution:AstudyofTalegaonDabhadecity”Dr.D.Y.PatilInstituteof EngineeringandTechnologyAmbi,UniversityOfPune,Maharashtra,India.
E.Elangaon(2015)“StudyonTrafficflowcharacteristicsusingProbeVehicles”DivisionofTransportationEngineering,Anna University,Chennai.
GaboroneBotswana(2004)”TraficDataCollectionandAnalysis”SouthernAfrica”
ManrajSinghBains(2012)“ModellingofTrafficFlowonIndianExpresswaysusingSimulationTechnique”BirlaInstituteof TechnologyandScience,Pilani,Rajasthan,India.
FredL.Hall(2014)“TrafficStreamCharacteristics”McMasterUniversity,Hamilton,Ontario,Canada.
KPTiwari(2013)“FuelWastageAndEmissionDueToIdlingOfVehiclesAtRoadTrafficSignals”ISSTEngineeringcollege, ISST,Indore.
RandyB. Machemehl (1998) “Fuel ConsumptionEstimation AndOptimalTraffic Signal Timing” The University of Texas at Austin,Austin.
MaduErramrpali(2015)“EffectOfCongestionOnFuelCostAndTravelTimeCostOnMulti-LaneHighwaysInIndia”National InstituteofTechnology,Surathka,India.
Yorii Ryabokon (2016) “The Method of Determining the Number of Phases in the Traffic Light Cycle on the Allowable IntensityofConflictingFlows”SiberianStateAutomobileandHighwayAcademy,5Miraav.,Omsk,644080,Russia.
Dr. M Ali Ahmed (2013) “Performance Analysis Of Rotary Intersection: Case Study, Silchar, Assam” Civil Engineering Department,NITSilchar,Assam-788010,India