
International Research Journal of Engineering and Technology (IRJET) e-ISSN: 2395-0056
Volume: 12 Issue: 04 | Apr 2025 www.irjet.net p-ISSN: 2395-0072
International Research Journal of Engineering and Technology (IRJET) e-ISSN: 2395-0056
Volume: 12 Issue: 04 | Apr 2025 www.irjet.net p-ISSN: 2395-0072
Manya Agarwal, Dr. M S Suganthiya, Dr. Bhawna Sharma
Student, Amity Business School, Amity University Mumbai Assistance Professor, Amity Business School, Amity University Mumbai Director, International Affairs and Programs, Officiating HOI, Amity Business School ,Amity University Mumbai
Abstract - Thisstudyexaminestheimpactoffinancialratio analysisoncorporatevaluation,usingRelianceIndustriesLtd. asacasestudy.Financialratiosprovidecriticalinsightsintoa firm's profitability, solvency, liquidity, and market performance, serving as essential tools for investors and analysts.Thisstudyanalyzesmajorfinancialcoefficientsfor five years, emphasizes their role in understandingcomplexanddiversifiedcompanyevaluation, investmentdecisions,and strategic financial managementofcomplex and diversified companies such as RelianceIndustriesLTD.
Key Words: Financial Ratios,CorporateValuation,Reliance Industries, Liquidity, Profitability, Solvency, P/E Ratio, EPS, ROE
1.INTRODUCTION
Analysis of the financial ratio is the cornerstone of the modernevaluationmethodandprovidesaclearpictureof the company's financial health. This research focuses on Reliance Industries Ltd., one of India’s largest conglomerates,andinvestigateshowfinancialratiosreflect intrinsicvalueandguideinvestmentdecisions.Thisstudy showsthestrategicimportanceofcorporatefiscalanalysis while studying profitability, liquidity, payment ability and marketcoefficients.
1. To analyze the significance of financial ratios in valuingRelianceIndustriesLtd.
2. Toevaluatethe roleofkey ratiosinassessingthe company'sfinancialhealth.
3. Toexaminehowfinancialratiosimpactinvestment decisionsandvaluation.
Financialratioshavelongbeendeterminedasanimportant toolwhenevaluatingourperformanceandratings.Scientists suchasPenman(2013)andDamodaran(2012)highlightthe role of profitability and market-based conditions in estimating internal value. Altman's Z-score and Beaver's research shows prioritization of economic difficulties. In India,researchersemphasizetheneedtoadapttraditional ratioanalysistocomplexcompaniessuchastrust.Overall,it hasbeenshownthatfinancialsituationsinfluenceinvestor
behaviour, support valuation models and provide insight intothehealthofthecompany.Inotherwords,itisessential for the analysis of diverse conglomerates such as the RelianceIndustry.
3.1 Area of
ThisstudyfocusesonRelianceIndustriesLtd.andanalyzesh owyourfinancialsituationreflectstheimpactofyourperfor manceandvaluation. It bridges internal financial metrics with external investor perception, emphasizing the relevanceofratioanalysisinacomplexcorporatestructure.
3.2 Sample of
ThesamplewasRelianceIndustriesLtd.,whichwaschosen becauseofitsdiversestructureanditsrelevancewiththe sample.Thestudywasextendedforoverfiveyearsfrom19 to 2022 to 23, documenting the impact of important economiceventsonperformance.
3.3 Type of
This study is descriptive and analytical. This analytically interpretsfive-yearratiodatatoexplaintherationaleand importance of financial rates and to identify trends and impactsonvaluations.
3.4
Secondarydatafromtrustedsourcessuchasmanagement reports,financialwebsites(moneycontrols,screeners),and marketmanagementwereused.Thetermscollectedinclude profitability, liquidity, solvency, efficiency, and market valuationmetrics.
3.5 Method of
Analysesincludedtrendanalysis,descriptivestatistics,and correlation tests.Graphical representations(lines and bar diagrams) were used to interpret the financial situation individually and how the financial situation existed along withvaluationandinventoryperformance.
International Research Journal of Engineering and Technology (IRJET) e-ISSN: 2395-0056
Volume: 12 Issue: 04 | Apr 2025 www.irjet.net p-ISSN: 2395-0072
1. Single Company Focus: The study focuses only on Reliance Industries Ltd., so the findings may not be applicable to companies in other industries or with simplerbusinessmodels.
2. Excludes Qualitative Factors: Non-financial aspects likemanagementquality,innovation,andbrandvalue are not included, which may limit the comprehensivenessofthevaluation.
3. Reliance on Secondary Data: Analysisreliessolelyon datafromcompleteddatafromfinancialplatforms.This requiresaccuracyand integrity without independent reviews.
4. No Macroeconomic Consideration: Externalfactors likeinflation,interestrates,andpolicychangesarenot accounted for, which can impact company valuation andinvestorsentiment.
5. Historical Perspective Only: Financial ratios are based on pastperformance andmay not fullyreflect future risks or opportunities, especially in volatile marketconditions.
This analysis examines the role of financial ratios in the valuationofRelianceIndustriesLtd.Fiveyearswereanalyzed usingkeyrelationshipssuchasEPS,ROE,currentratios,and P/Etoassessfinancialhealthandmarketperformance.The results show that investors' perceptions and stock prices have been highlighted. Vacancies and market-based conditions reflect consistent growth and stability. Comparative data highlights a strong position of trust, but capitalefficiencyremainslowerthanitscolleagues.Overall, the analysis confirms that financial situation is a reliable indicatorforunderstandingreviewsandperformance.
5.1 Data Presentation
Table-1: Five-YearFinancialsofRelianceIndustriesLtd.
Table 2: KeyFinancialRatios
Table-3: ComparativeAnalysiswithSectoralBenchmarks (2022-23)
From Table 2, we analyzed the mean, median, and standard deviation ofkey financial ratios from 2018–19 to 2022–23,focusingon liquidity, leverage, profitability, and valuation. This helped assess Reliance Ltd.’s financial stability and performance trends over time. Liquidity and leverage ratios highlighted the company’s abilitytomanageobligationsandcapitalstructure,while profitability and valuation metrics reflected its
efficiencyandmarketperception.Thestatisticalmeasures offeredclearinsightsintotheconsistencyandfluctuations inReliance’sfinancialhealth.
International Research Journal of Engineering and Technology (IRJET) e-ISSN: 2395-0056
Volume: 12 Issue: 04 | Apr 2025 www.irjet.net p-ISSN: 2395-0072
vs. Stock price
IndicatesReliance’s steady liquidity management. Despitebeingbelow 1,itreflectsefficient workingcapitaluse given strong cash flows.
Shows balanced leverage and a decliningtrenddue to strategic debt reduction post majorinvestments.
Reflects stable capital efficiency, with a postpandemic recovery driven by digital andretailgrowth.
Interpretation- Thisextremelystrongpositivecorrelation confirms that earnings per share are the most critical factor driving stock price. As Reliance improves profitability per share, investors respond with higher valuations.Thisunderlines EPS as the dominant valuation metric
Improving margin trend, with variability during the pandemic and oilshocks.
Interpretation- A high liquidity buffer boosts investor confidence,especiallyincapital-intensivefirmslikeReliance. Post its investment phase, Reliance’s improved liquidity signals financial prudence, which positively impacts marketsentiment
Market pricing in growth; moderate fluctuations reflect investor sentiment andmacroshifts.
Stable multiple showing steady market confidence in Reliance’s operating performance.
FromTable2,APearsoncorrelationanalysiswasconducted toassesstherelationshipbetweenkeyfinancialratiosand RelianceIndustries’stockprice.Theresultshighlightwhich ratiosmostinfluenceinvestorsentimentandhavepredictive valueinstockvaluation.
Interpretation- A high P/E indicates that the market has highexpectationsforfuturegrowth.Thestrongcorrelation showsthat stock price movements are partially driven by investor optimism,oftentiedtoprojectedperformance.
Interpretation-Indicates investors are valuing Reliance based on core operating performance, especially its scalable digital and retail businesses. Growth in EBITDA leadstohigherenterprisevaluations,liftingthestock
International Research Journal of Engineering and Technology (IRJET) e-ISSN: 2395-0056
Volume: 12 Issue: 04 | Apr 2025 www.irjet.net p-ISSN: 2395-0072
Net Profit Margin vs. Stock Price
Interpretation- While only moderately correlated, improved efficiency in turning revenue into profit contributespositivelytovaluation.However,absoluteprofit (EPS)hasagreatereffectthanmarginsalone.
ROE vs. Stock Price
-0 282
Interpretation- A weak inverse correlation might be explainedbycapitalbaseexpansion(e.g.,equityissuance), which reduces ROE in the short term. Despite this, stock pricegrowthcontinued,showingmarketfocusonbroader growthprospectsratherthanefficiencyalone.
ROCE vs. Stock Price
Interpretation- Ascapital-intensiveinvestmentsincreased, ROCE temporarily dipped. Yet the stock price rose, suggestingthatinvestorsarepricinginlong-termreturns, evenifcurrentreturnsoncapitalaresuppressed.
Debt- Equity Ratio vs. Stock Price
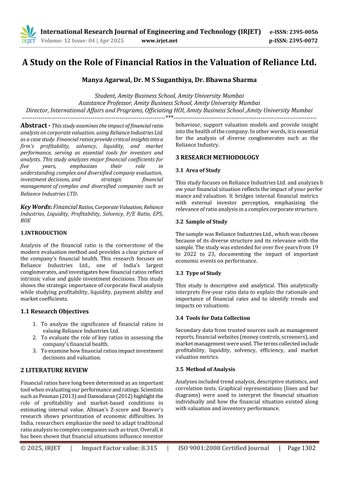
Interpretation: TCSleadswiththehighestROCE,showing superiorcapitalefficiency.ONGCfollowswithasolidreturn, whileRelianceandBhartiAirtellag,indicatinglesseffective useofcapitalemployed.
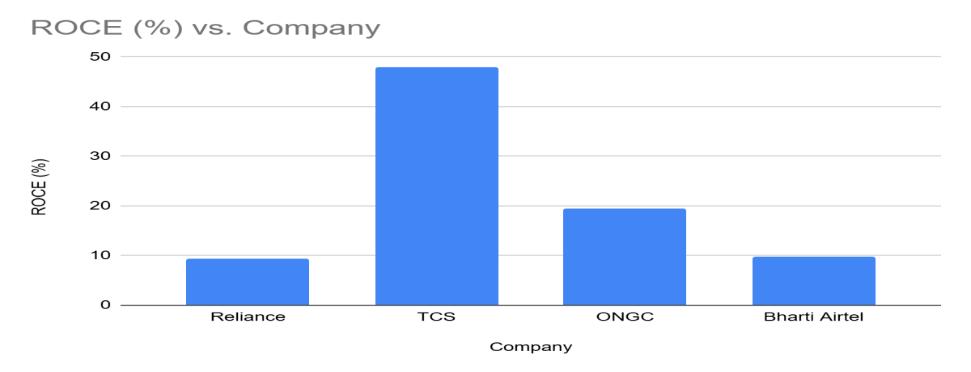
Interpretation: TCSagaindominateswiththehighestROE, signallingexcellentreturnsonshareholders'equity.ONGC and Reliance show moderate performance, while Bharti Airtel’s low ROE suggests weaker profitability from shareholders’funds.
Interpretation: This strongest negative correlation highlightsthatdeleveraging(reducingdebt)hassignificantly boosted investor confidence and stock price. Investors favouramoreconservativecapitalstructurewithlowerrisk.
ThegraphsbasedonTable3offeraclearcomparisonofkey financial ratios across selected companies, highlighting differencesinfinancialperformance.
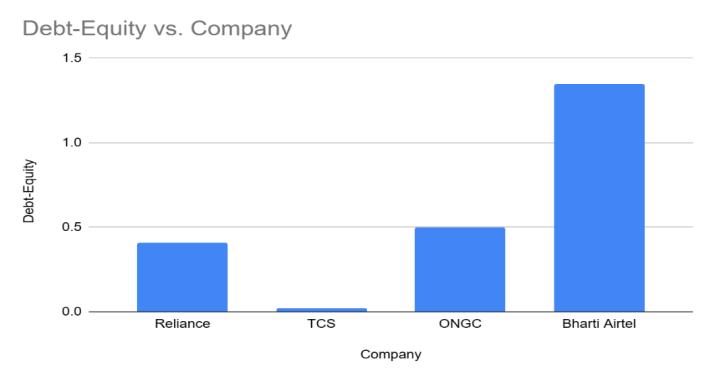
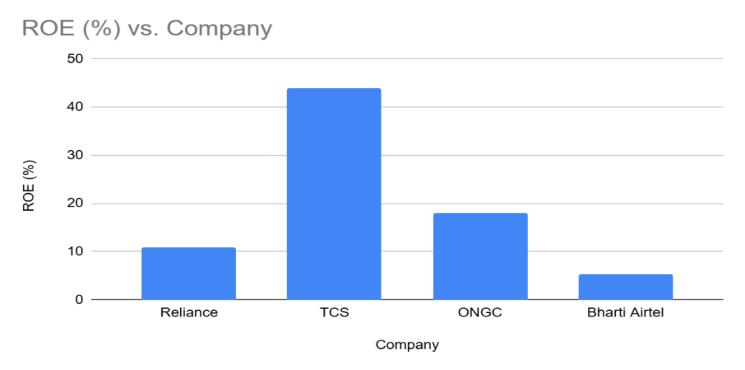
Interpretation: TCS and ONGC maintain very low debt levels, suggesting strong solvency. Reliance is moderately leveraged,whileBhartiAirtelhasahighdebt-equityratio, indicatinghigherfinancialrisk.
International Research Journal of Engineering and Technology (IRJET) e-ISSN: 2395-0056
Volume: 12 Issue: 04 | Apr 2025 www.irjet.net p-ISSN: 2395-0072
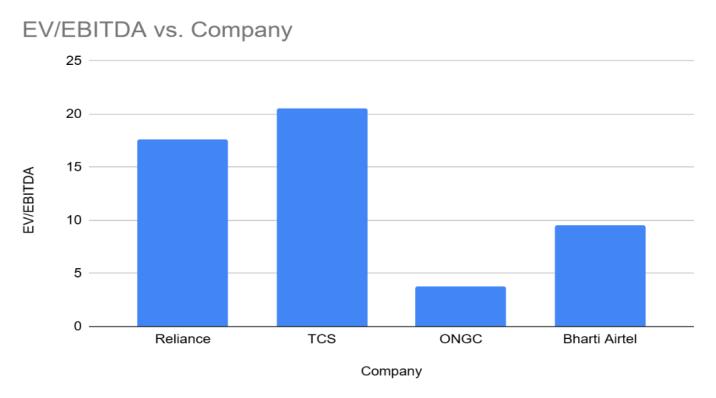
6: EV/EBITDA Comparison Among Selected Companies
Interpretation: ONGChasthemostattractiveEV/EBITDA, indicating potential undervaluation. TCS and Bharti Airtel have high values, showing premium valuation, while Reliancestandsinbetween.
Interpretation: HighROCEandROEindicateefficientuseof
capital and strong shareholder returns. Low debt-equity suggests financial stability, while high net profit margins reflect good cost control. A high P/E signals growth expectations;alowonemaysuggestundervaluation.Lower EV/EBITDAimpliesattractivevaluation,whilehighervalues indicateexpectedgrowth
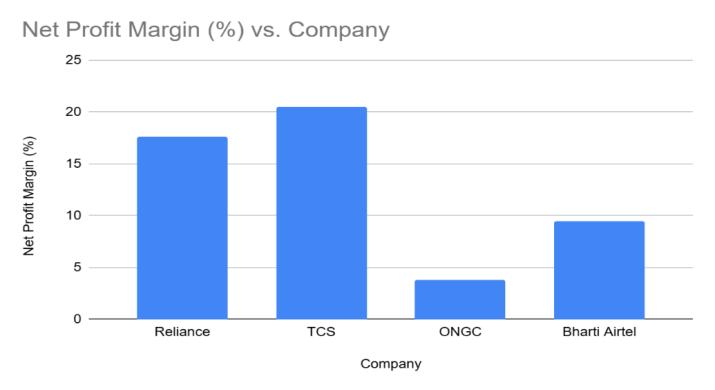
Interpretation: ONGCandTCSshowrobustprofitmargins, implying efficient cost control and strong profitability. Relianceholdsamiddleground,whereasBhartiAirtel’slow marginreflectstightearnings.
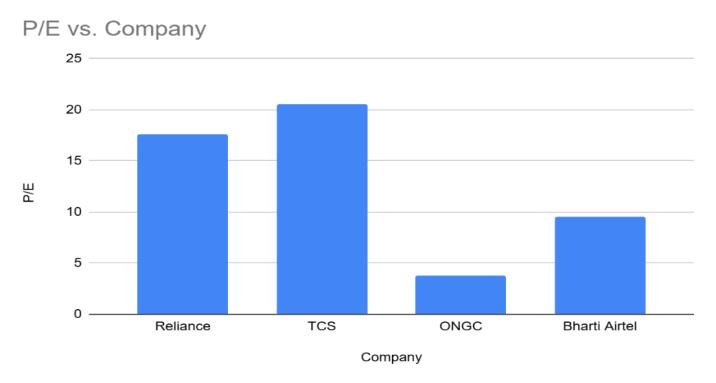
Figure 5: Price-to-Earnings Comparison Among Selected Companies
Interpretation: BhartiAirtelhasthehighestP/E,suggesting investoroptimismorovervaluation.TCSandReliancehave moderate values, while ONGC's low P/E may imply undervaluationormarketconcerns.
3.5 Trend Analysis
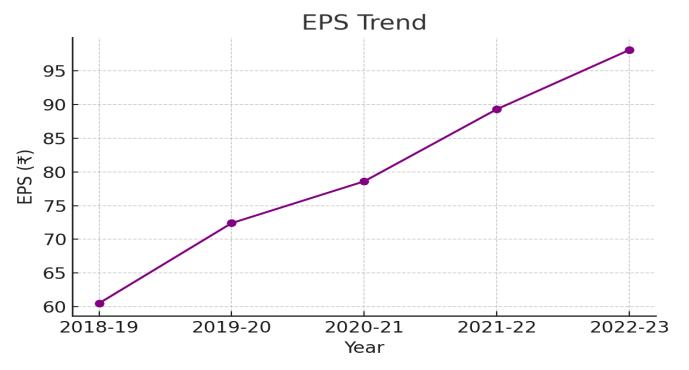
Figure 7: Trend of EPS for Reliance (2018–2023)
Interpretation: TheEPSshowsaconsistentrisefrom₹60.5 in 2018–19 to ₹98.2 in 2022–23, indicating strong profitability growth. This upward trend reflects enhanced earningspotentialandvaluecreationforshareholders.
International Research Journal of Engineering and Technology (IRJET) e-ISSN: 2395-0056
Volume: 12 Issue: 04 | Apr 2025 www.irjet.net p-ISSN: 2395-0072
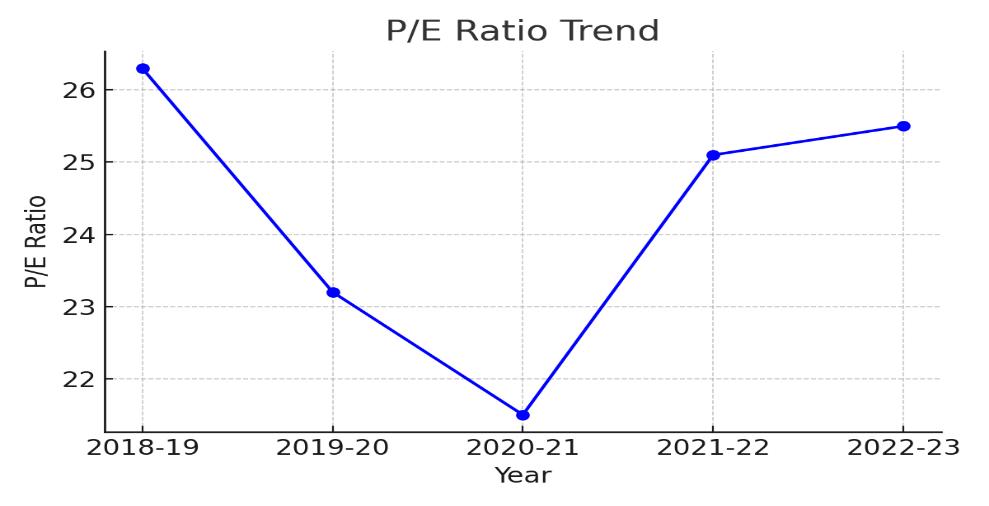
Interpretation: The P/E ratio declined till 2020–21 but rebounded sharply, reflecting initial market caution and later renewed optimism. This indicates growing investor confidence and willingness to pay a premium for the company’searnings.
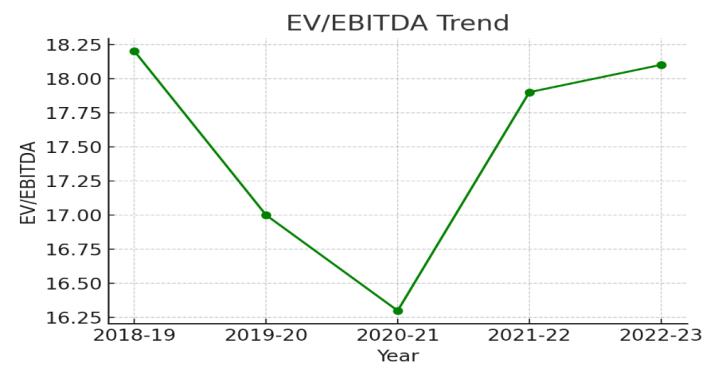
Interpretation: TheEV/EBITDAratiodippedtill2020–21 andthenrecovered,suggestingtemporaryundervaluation during the pandemic followed by regained investor confidence. The return to higher levels indicates a fairer valuationalignedwithearningsstrength.
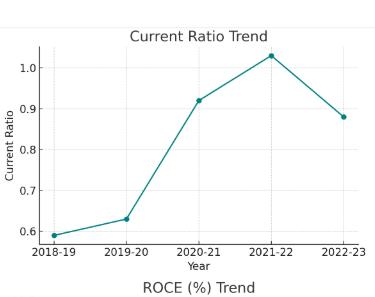
Interpretation: Thecurrentratioincreasedsteadilyfrom 0.59in2019toapeakof1.03in2022,indicatingimproving short-termliquidity.However,itslightlydeclinedto0.88in 2023, suggesting a moderate reduction in the company’s abilitytocovershort-termobligations.
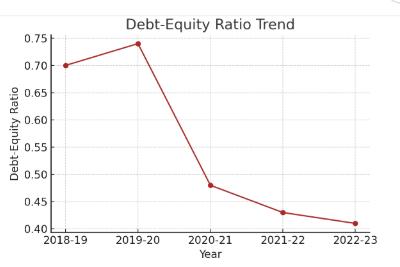
Interpretation: Thedebt-equityratioconsistentlydeclined from 0.70 in 2019 to 0.41 in 2023. This trend reflects a strong move toward deleveraging and a healthier capital structurewithlowerrelianceondebt.
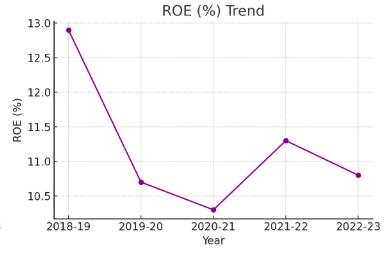
Interpretation: ROEdroppedfrom12.9%in2019to10.3% in2021,followed bya modest recovery to 11.3% in 2022 andaslightdipto10.8%in2023.Thetrendshowspressure onshareholderreturns,thoughrecoveryeffortsarevisible.
International Research Journal of Engineering and Technology (IRJET) e-ISSN: 2395-0056
Volume: 12 Issue: 04 | Apr 2025 www.irjet.net p-ISSN: 2395-0072
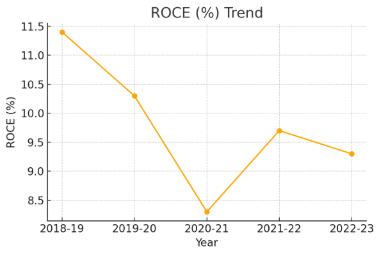
Interpretation: ROCEdeclinedfrom11.4%in2019toalow of 8.3% in 2021 but rebounded to 9.7% in 2022 before slightly tapering to 9.3% in 2023. This indicates some recoveryinoperationalefficiencypost-pandemic.
Thestudyconcludesthatfinancialratiosareessentialtools for evaluating the performance and valuation of Reliance Industries Ltd. Ratios like EPS, ROE, and Debt-to-Equity provide valuable insights into profitability, stability, and investor perception. The analysis confirms that these indicatorssignificantlyinfluencestockvaluationandmarket confidence. For a diversified company like Reliance, ratio analysis is critical in understanding segment-wise performance and guiding strategic decisions. Overall, financialratiosserveasreliablebenchmarksforassessing corporatehealthandlong-termvalue.
1. . Adopt a Multi-Ratio Approach: Relyingonasingle ratiocanbemisleading.Acombinationofprofitability, liquidity, solvency, and market-based ratios gives a moreaccuratefinancialpicture.
2. Benchmark with Industry Peers: Comparingratios with similar companies helps identify areas of strengthandweakness,improvingstrategicdecisionmaking.
3. Focus on Long-Term Trends: Analysingratiosover several years provides insight into consistent patternsandavoidsmisinterpretation due to shorttermfluctuations.
4. Integrate Qualitative Factors: Combine financial ratios with non-financial aspects like ESG performance, leadership quality, and innovation capacityforbettervaluation.
5. Consider External Influences: Regulatorychanges, interest rates, and economic trends can impact financialratiosandshouldbefactoredintoanalysis.
6. Use Financial Technology Tools:Usemoderntools anddashboardsforreal-timefinancemonitoringand visualanalysisofratiotrends.
7. Promote Investor Education: Ensurethatinvestors, particularlyretailers,cancorrectlyinterpretfinancial quotas and make decisions that are discovered properly.
1. Cross-Industry Comparison: Study how financial ratiosvaryinimportanceacrosssectorsliketechvs. manufacturing.
2. Qualitative Factors: Includenon-financialelements (e.g., governance, macroeconomics) to enhance valuationaccuracy.
3. Advanced Analytics: Use AI, ML, and statistical modelstoimprovethepredictivepoweroffinancial ratios.
4. Long-Term & Post-Pandemic Trends: Analysedata over10–20yearsandpost-COVIDtoassesslong-term ratiobehaviour.
5. Investor Behaviour: Explorehowdifferentinvestor types react to financial ratios using sentiment and behaviouralfinance.
6. Alternative Metrics: Comparetraditionalratioswith metricslikeEVAandDCFforbettervaluationinsights.
7. Global Benchmarking: Contrast Reliance’s ratios with global peers to understand cross-border valuationeffectiveness.
I sincerely thank Dr. Bhawna Sharma and Dr. M. S. Suganthiya for their invaluable guidance and support throughoutthisproject.IalsoextendmygratitudetoAmity UniversityMumbaiforprovidingtheplatformtoundertake this research. My heartfelt thanks to all faculty members whoseinsightsenrichedthisstudy.
[1] Damodaran, A. (2012) – Investment Valuation: Tools andTechniquesforDeterminingtheValueofAnyAsset
[2] Penman,S.H.(2013)–FinancialStatementAnalysisand SecurityValuation
[3] White,Sondhi&Fried(2003)–TheAnalysisandUseof FinancialStatements
[4] Brigham, E. F. & Ehrhardt, M. C. (2019) – Financial Management:Theory&Practice
[5] Altman, E. I. (1968) – Financial Ratios, Discriminant AnalysisandthePredictionofCorporateBankruptcy
[6] Khan,M.Y.&Jain,P.K.(2015)–FinancialManagement
[7] Foster,G.(1986)–FinancialStatementAnalysis
[8] Beaver,W.H.(1966)–FinancialRatiosasPredictorsof Failure
[9] Ramakrishnan, K. (2017) – Application of Financial RatiosinEvaluatingIndianConglomerates
[10] Sharma, R. & Singh, S. (2014) – Impact of Financial RatiosonInvestorBehaviourinIndianMarkets
[11] Reliance Industries Limited – Annual Reports and FinancialStatements https://www.ril.com
[12] MoneyControl–RelianceFinancialRatio&StockData https://www.moneycontrol.com
International Research Journal of Engineering and Technology (IRJET) e-ISSN: 2395-0056
Volume: 12 Issue: 04 | Apr 2025 www.irjet.net p-ISSN: 2395-0072
[13] NSEIndia–FinancialsandCorporateFilingsofReliance https://www.nseindia.com
[14] Yahoo Finance – Historical Financials of Reliance Industrieshttps://in.finance.yahoo.com
[15] Investopedia–DefinitionsandExplanationsofFinancial Ratioshttps://www.investopedia.com
[16] SEBI – Regulatory Guidelines and Filings https://www.sebi.gov.in
2025, IRJET | Impact Factor value: 8.315 | ISO 9001:2008