
International Research Journal of Engineering and Technology (IRJET) e-ISSN: 2395-0056
Volume: 12 Issue: 06 | Jun 2025 www.irjet.net p-ISSN: 2395-0072
International Research Journal of Engineering and Technology (IRJET) e-ISSN: 2395-0056
Volume: 12 Issue: 06 | Jun 2025 www.irjet.net p-ISSN: 2395-0072
Amit Dattatray Salamwade1, S.M.Bhosale2
1Amit Dattatray Saamwade,Student Department of Technology,Shivaji University, Kolhapur,Maharashtra,India
2 Prof, Dept. Of Civil Engineering, Department of Technology, Shivaji University, Kolhapur, Maharashtra, India
Abstract - This research explores the viability of utilizing wastewater from sea food processing industries as substrate for bioelectricity generationthrough dual chamber microbial fuel cell(MFCs). MFCs among few technologies that directly, harness microbial metabolism to produce electricity, addressing the urgrnt global energy demand. The generated current in MFCs is dependent on microbial oxidation of organic substrates and the resultant electron transfer to the anode. This method allows electricity production from waste material without the need for external energy input. The seafood processing units typically discharges wastewater through operations such as drying, fermenting, canning and smoking. Such wastewaters are characterized by high BOD5 (100–3000 mg/L), COD (1000–18000 mg/L). This study evaluates power output variation due to electrode surface area by comparing two MFCc setups, each employingdifferent graphite rod diameter. The findings indicate that increasing electrode surface area improves MFCS performance.
Key Words: Microbial fuel cell (MFC), Bioelectricity, Substrate, BOD, COD, Current and Power Density electron transfer process.
Theglobalsurgeinenergydemand,coupledwithincreasing dependence on fossil fuels necessitates exploration of sustainablealternative.TheGlobalconsumptionin2010was 520quadrillion.BTUsandisexpectedtoincreaseby56%in 2040. Recent studies prove that biodegradable waste can serve as the best source for energy generation and also controlpollutionandminimizethedependenceonremaining fossil fuel. Oneof such innovative in recent technology is Microbial Fuel Cell (MFC),which utilizes the microbial processes of microorganism to break down the organic matter and generate electricity via electron transfer. Now wastewater emerges as one of the valuable resource notonlyfornutrientrecoverybutalsoforsustainableenergy generation.
Generaladvantages’ofMicrobialfuelcellwhenimplemented inwastewatertreatmentareasfollows:
Converts direct substrate Energy to Electricity.
Minimal sludge compared to Anaerobic Digestion andConventionalActivatedSludge.
Insensitivetooperationenvironment(low temperatures);
Requiresno gastreatment;
Applicationinlocationswithinsufficient electricalinfrastructures.
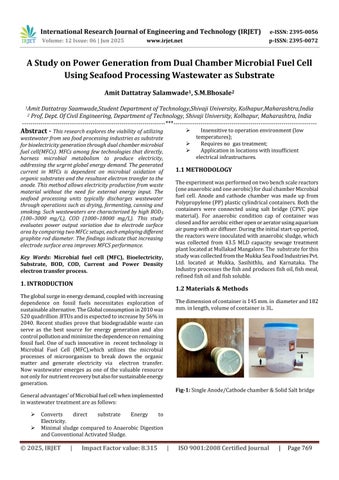
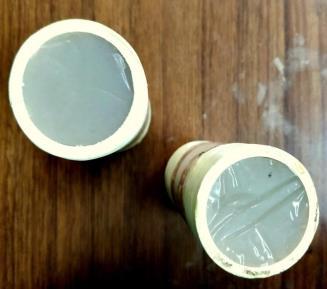
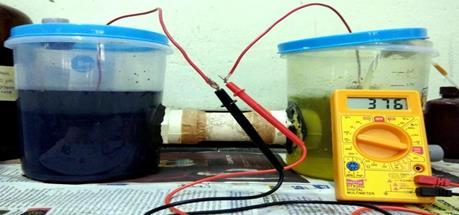
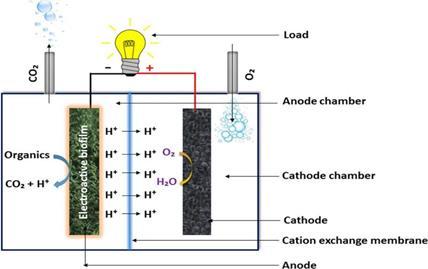
Theexperimentwasperformedontwobenchscalereactors (oneanaerobicandoneaerobic)fordualchamberMicrobial fuel cell. Anode and cathode chamber was made up from Polypropylene(PP)plasticcylindricalcontainers.Boththe containers were connected using salt bridge (CPVC pipe material). For anaerobic condition cap of container was closedandforaerobiceitheropenoraeratorusingaquarium airpumpwithairdiffuser.Duringtheinitialstart-upperiod, thereactorswereinoculatedwithanaerobicsludge,which was collected from 43.5 MLD capacity sewage treatment plantlocatedatMullakadMangalore.The substrateforthis studywascollectedfromtheMukkaSeaFoodIndustriesPvt. Ltd. located at Mukka, Sasihithlu, and Karnataka. The Industryprocessesthefishandproducesfishoil,fishmeal, refinedfishoilandfishsoluble.
Thedimensionofcontaineris145mm.in diameterand182 mm.inlength,volumeofcontaineris3L.
International Research Journal of Engineering and Technology (IRJET) e-ISSN: 2395-0056
Volume: 12 Issue: 06 | Jun 2025 www.irjet.net p-ISSN: 2395-0072
ExperimentalSetupof
1.3. Experimental Procedure:
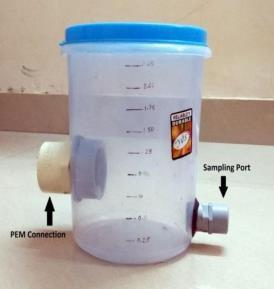
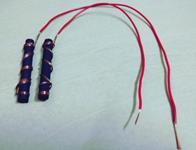
ADualchamberMFCwasconstructedbasedona145mm. diameterand182mm.highcylindricalPolypropylene(PP) plastic(5mm.thick)withthetotalreactorworkingvolume of 3 L. The MFC reactor was separated into anode and cathodechambersbySaltBridge.TheSaltBridgeconnection was assembled as mentioned in section 3. The CPVC pipe containingthesalt-agarmixturewasfixedbetweenthetwo containersandbehavedlikethesalt-bridgeassistinginthe proton transfer mechanism during the MFC operation. Graphiterodsofdifferentsizewereused anodeandcathode (electrodes)ofDualchamberMFC.Copperwirewaswinded along cylindrical surface of Graphite rod to collect and transferelectronssufficiently
Duringtheinitialstart-upperiod,theMFCreactorswere inoculated using 1.5 L of anaerobic sludge from 43.5 MLD capacitysewagetreatmentplant.Ethanolabout2mLand0.1 NSodiumHydroxide(NaOH)forpHmaintenanceswasadded daily. ForoperationofMFC,usinganaerobicmetabolismthe anode chamber was spurged with nitrogen to remove DO. Theanodechamberwascompletelysealedandthesetupwas
placedinaroomatatempof27°Cto35°C.2g/LSodium2bromoethanesulfonate (C2H4BrNaO3S) (RM3180-25G) Himediasaltwasaddedinanodechamberforevery24hour toinhibitthegrowthofmethanogenicorganism.Incathode chamberwithsameworkingvolume(1.5L.)wasfilledwith 50 mM potassium ferricyanide (K3Fe(CN)6) in a 100mM phosphatebuffer(pH=7.0).Airwasspurgeintoitwiththe helpofanairSpurgerusingVenusaquaaquariumair Pump (AP-408A) with capacity of 4L/min. The electrodes were connectedtoexternalresistance(R)1000Ω,cellvoltage(V) acrossa1000Ωusingadigitalmultimeter(GenericDT830D, HAOYUE)wererecorded.Graphiterodsofdifferentsize8mm and10mmwereusedforeachofDualchamberMFC.Two DualChamberMFCwasconstructedMFC-1andMFC-2.MFC1 consists of 8 mm. Graphite Rod as electrode and MFC-2 consists of 10 mm. Graphite Rod as electrode. All reactor operationwasunderBatchfedMode.Afterinoculationfor period of 30 days along with development of biofilm on surface of electrodes and achieving voltage stabilization. Seafoodprocessedwastewater1.2L.with30%ofactivated (inoculated) sludge was filled in anodic chamber. The salt bridges of both MFC-1 and MFC-2 for collecting and transferringprotonwereexhausted.NewSaltBridgeofsaltagar mixture of same concentration as mentioned in3.1.2 waspreparedforbothMFC-1andMFC-2respectively.The CatholytewasreplacedbysimilarconcentrationofPotassium Ferricyanide(3.1.4)inbothMFC-1andMFC-2respectively. ForAnaerobicconditionNitrogenGaspurgedtoremoveair and was sealed was completely sealed and the setup was placedinaroomatatempof27°Cto35°C.Airwassparged intoitwiththehelpofanairspargerincathodechamberfor continuous aerobic condition. All reactor operation under BatchfedMode.Theelectrodeswereconnectedtoexternal resistance(R)1000Ω,cellvoltage(V)acrossa1000Ωusing a digital multimeter (Generic DT830D, HAOYUE) were recorded.ForHRTof15daysvoltage(mV)acrossexternal (1000Ω)andinternalresistancewasrecorded.Sampleswere taken from MFC-1 and MFC-2 anode chamber for the measurementsofCODwereperformedaccordingtostandard methodsweredonedaily.Allexperimentswerecarriedoutat aroomtemperatureof28±2°C.
Powerdensity(mW/m2)andcurrentdensity(mA/m2)are calculated according to the projected Graphite rod surface area.Voltage(mV)wasmeasuredusingdigitalmultimeterand thereadingsare plottedonagraphwithHRT.Voltage (mV) wasmeasuredacross1000Ωexternalresistanceandcurrent wascalculatedbyOhm’sLaw:
I=V/R
The maximum power (P) generated was calculated by using above the formula(Equation 8),where V is the maximum voltage obtained and I is the corresponding currentproducedinm.Ampagainstanexternalresistance.
International Research Journal of Engineering and Technology (IRJET) e-ISSN: 2395-0056
Volume: 12 Issue: 06 | Jun 2025 www.irjet.net p-ISSN: 2395-0072
CurrentdensitymA/m2 wascalculatedbytheformulae.
Currentdensity(C.D) = I(max)/A
AndPowerdensitymW/m2 wascalculated bythe formulae
Powerdensity(P.D) = P(max)/A
WhereAisthesurfaceareaoftheanodewhichis obtainedbythefollowingcalculation
Surfaceareaoftheanode(A)=2(πr 2)+(2πr)h.
Anaerobic sludge was collected from 43.5 MLD capacity sewagetreatmentplantlocatedat Mullakad,Mangalore.Initialparametersweredeterminedby using standard methods. The below values represent average of 3 samples except Colour and VS/TS ratio. All experimentswerecarriedoutataroomtemperatureof28± 2°C.
3.1.Anaerobic Sludge Characteristics of STP, Mangalore .
Parameters Values Units
pH 6.8Colour BlackTurbidity 1350 NTU
ForMFC-1Voltage(mV)wasmeasureddailyfor29days across1000Ωexternalresistanceusingdigitalmultimeter. Current (mA) was calculated as mentioned in section 3.3. CurrentDensity(mW/m2)andPowerDensity(mW/m2)was calculated using surface area (0.000352 m2) of 8 mm. graphite rod. Graph of Voltage (mV) v/s time (days) was plottedforMFC-1 (Chart-1).
3.2.Seafood Processed WastewaterCharacteristics.
Units pH 5.59Colour LightGray -
440 NTU Conductivity 12.98 ms/cm
mg/L
mg/L
0
0
0
0
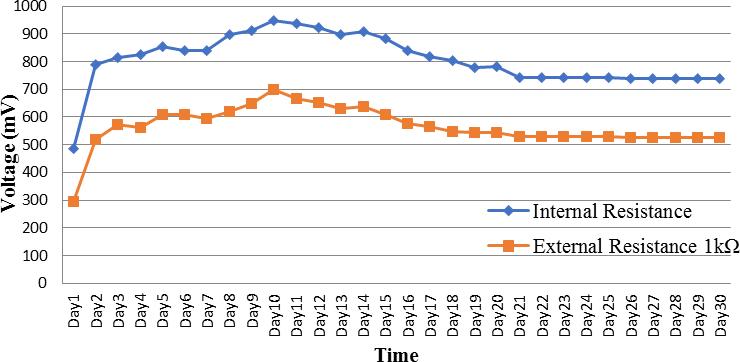
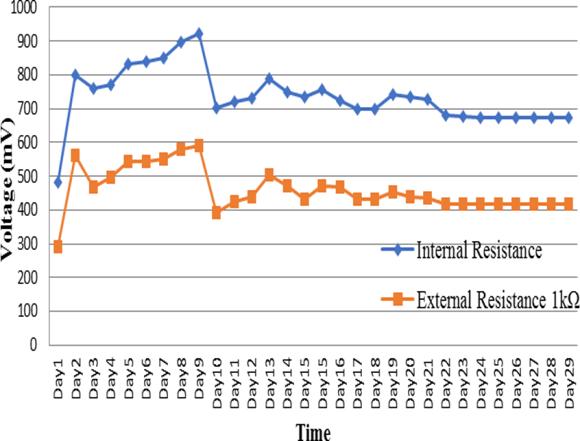
Chart -1:VoltageGenerationofMFC-1
Voltage (mV) was measured daily for both cell internal resistance and external resistance 1000 Ω in MFC-1.Itwas observed that on Day 1 voltage across external resistance was increased from 136 mV to 296 mV, then further increased to 520 mV on Day2 and maintained in rangeof 500-600 mV till Day 8. There was further rise in voltage, reachingpeakof698mVwithcorrespondingCurrentDensity of1982.955mA/m2andPowerdensity1384.102mW/m2on Day10.Thevoltagestabilizationanddevelopmentofbiofilm occurredbetween540mV-525mVduringDay18-Day30.
Voltage (mV) was measured daily for both cell internal resistance and external resistance 1000 Ω in MFC-1.Itwas observed that on Day 1 voltage across external resistance was increased from 136 mV to 296 mV, then further increased to 520 mV on Day2 and maintained in rangeof 500-600 mV till Day 8. There was further rise in voltage, reachingpeakof698mVwithcorrespondingCurrentDensity
International Research Journal of Engineering and Technology (IRJET) e-ISSN: 2395-0056
Volume: 12 Issue: 06 | Jun 2025 www.irjet.net p-ISSN: 2395-0072
of1982.955mA/m2andPowerdensity1384.102mW/m2on Day10.Thevoltagestabilizationanddevelopmentofbiofilm occurredbetween540mV-525mVduringDay18-Day30.
ForMFC-2Voltage(mV)wasmeasureddailyfor29days across1000Ωexternalresistanceusingdigitalmultimeter. Current (mA) was calculated as mentioned in section 3.3. CurrentDensity(mW/m2)andPowerDensity(mW/m2)was calculated using surface area (0.000471 m2) of 10 mm. graphite rod. Graph of Voltage (mV) v/s time (days) was plottedforMFC-2(Chart-2)
Table: 3.4 Voltage Generation of MFC-2
International Research Journal of Engineering and Technology (IRJET) e-ISSN: 2395-0056
Volume: 12 Issue: 06 | Jun 2025 www.irjet.net p-ISSN: 2395-0072
Voltage(mV)wasmeasureddailyforbothcell internal resistanceandexternalresistance1000ΩofMFC-2.Itwas observed that on Day 1 voltage across external resistance was increased from 257 mV to 290 mV, higher when comparedtoMFC-1thenfurtherincreasedto560mVand decreasedto461mVonDay2andmaintainedinrangeof 450-550 mV till Day 7. There was further rise in voltage, reachingpeakof594mVwithcorrespondingCurrentDensity of1982.955mA/m2andPowerdensity1384.102mW/m2 on Day 9. On Day 10, unstable condition was occurred where,voltage when measured across both internal and externalresistancesuddenlydecreased699mVand380mV respectively. This unstable condition was overcome by adding 10 mL of Sodium Acetate (CH₃COONa) of concentration 0.3 mg/L .The voltage stabilization and developmentofbiofilmoccurredbetween430mV-420mV duringDay17-Day29.
3.5 Voltage Generation using Seafood Processed Wastewater in MFC-1
Thevoltage(mV)wasmeasureddailyforHRTof15days across1000Ωexternalresistanceusingdigitalmultimeter, whenSeafoodProcessedWastewaterwasusedassubstrate inMFC-1.ThevoltagefromDay2toDay16wasmeasured thriceinaday.Current(mA)wascalculatedasmentionedin section3.3.CurrentDensity(mW/m2)and Power Density (mW/m2)wascalculatedusingsurfacearea(0.000352m2) of8mm.graphiterod.GraphofVoltage(mV)v/stime(days) wasplottedforMFC-1(Chart3).
International Research Journal of Engineering and Technology (IRJET) e-ISSN: 2395-0056
Volume: 12 Issue: 06 | Jun 2025 www.irjet.net p-ISSN: 2395-0072
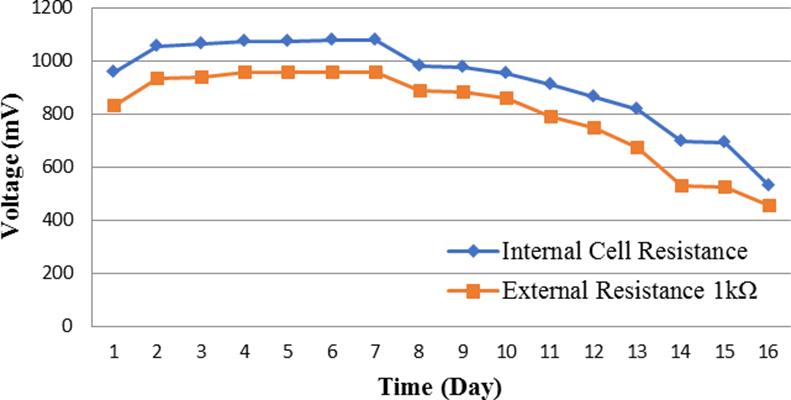
Chart-3: VoltageGenerationusingSeafoodProcessed WastewaterofMFC-1
TheVoltage(mV)wasmeasuredforHRTof15daysforboth cell internal resistance and external resistance 1000 Ω of MFC-1. It was observed that the voltage when measured across1000ΩonDay1wasincreasedfrom603mVto833 mV.FromDay2toDay7thevoltagemeasuredwasshowing stable reading in the range of 930 mV- 960 mV. The maximumvoltagegeneratedwas960mVacross1000Ωon Day 6 with corresponding maximum Current Density of 2727.273 mA/m2 and maximum Power Density 1956.688 mW/m2forMFC-1.Thevoltagewasdecreasedfrom890mV456mVfornexteightdaysindicatingnosufficientamountof nutrients present in substrate to achieve anaerobic metabolism
3.6 Voltage Generation using Seafood Processed Wastewater in MFC-2
Thevoltage(mV)wasmeasureddailyforHRTof15days across1000Ωexternalresistanceusingdigitalmultimeter, whenSeafoodProcessedWastewaterwasusedassubstrate inMFC-2.ThevoltagefromDay2toDay16wasmeasured thriceinaday.Current(mA)wascalculatedasmentionedin section 3.3. Current Density(mW/m2)and Power Density (mW/m2)wascalculatedusingsurfacearea(0.000471m2) of10mm.graphiterod.GraphofVoltage(mV)v/stime(days) wasplottedforMFC-2(Chart4)
International Research Journal of Engineering and Technology (IRJET) e-ISSN: 2395-0056
Volume: 12 Issue: 06 | Jun 2025 www.irjet.net p-ISSN: 2395-0072
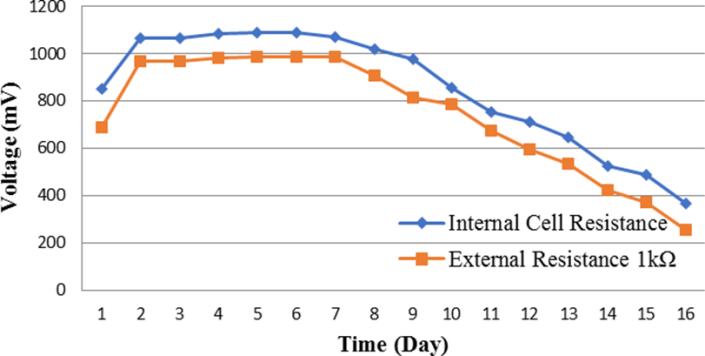
Chart-3: VoltageGenerationusingSeafoodProcessed WastewaterofMFC-2
TheVoltage(mV)wasmeasuredforHRTof15daysfor bothcellinternalresistanceandexternalresistance1000Ωof MFC-2. It was observed that the voltage when measured across1000ΩonDay1wasincreasedfrom603mVto690 mV.FromDay2toDay7thevoltagemeasuredwasshowing stable reading in the range of 910 mV- 990 mV. The maximumvoltagegeneratedwas988mVacross1000Ωon Day 5 with corresponding maximum Current Density of 2097.665 mA/m2 and maximum PowerDensity2072.493 mW/m2forMFC-2.Thevoltagewasdecreasedfrom985mV257mVfornext10daysindicatingnosufficientamountof nutrients present in substrate to achieve anaerobic metabolism.
The MFC-2 with 10 mm. graphite rod was performed betterwhencomparedtoMFC-1with8mm.graphiterodin terms of Power Density generation, COD, Nitrates and Phosphateremoval.Hereallparametersuchasconcentration ofsaltbridge(Agar-salt),volumeofseafoodwastewater(1.5 L)andconcentrationoforganicmatter(COD28000mg/L) weresameinbothMFC-1andMFC-2.
BioelectricitywassuccessfullygeneratedusingSeafood Processed Wastewater as a renewable source in a Dual ChamberMicrobialFuelcell(MFC)withSaltBridgeasPEM. Theresultsfoundwasveryencouragingwhencomparedto otherMFCstudies.Highreproducibilityintermsofvoltage
generation(max.=988mVat1000Ω)wasachievedforbatch fedMFCreactor.
Based on the experimental results obtained from the presentstudyonPowerGenerationofDualChamberMFC using Seafood Processed wastewater as substrate, the followingconclusionscanbedrawn.
1)TheMFC-1andMFC-2wasoperatedwithseafood processingwastewaterwasabletogeneratepower continuouslyforalmost16days.
2) The maximum voltage generated was 960 mV across 1000 Ω on Day 6 with corresponding maximumCurrentDensityof2727.273mA/m2and maximum Power Density 1956.688 mW/m2 for MFC-1
3) The maximum voltage generated was 988 mV across 1000 Ω on Day 5 with corresponding maximumCurrentDensityof2097.665mA/m2and maximum Power Density 2072.493 mW/m2 for MFC-2.
4) The MFC-2 with 10 mm. graphite rod was performedbetterwhencomparedtoMFC-1with8 mm.graphiterod.
5) Salt bridge MFC is the simplest biological fuel cellthatcanbedesignedandstudied
1) Cecconet D., Molognoni D., Callegari A. and Capodaglio A.G., (2017) .Agro-food industry wastewater treatment with microbial fuel cells: Energetic recoveryissues.InternationalJournalof Hydrogen Energy, Vol 43, No.1, pp.500-511 http://dx.doi.org/10.1016/j.ijhydene.2017.07.231
2) Chinnammai S., (2014). A Study on Energy Crisis and Social Benefit of Solar Energy. International JournalofEnvironmentalScienceandDevelopment, Vol5No.4,pp.404.
3) Chowdhury P., Viraraghavan T. and Srinivasan A., (2010). Biological treatment processes for fish processing wastewater–a review. Bioresource Technology,Vol.101No.2,pp.439-449.
4) ChoudhuryP.,UdayU.S.P.,MahataN.,TiwariO.N., Ray R.N., Bandyopadhyay, T.K. and Bhunia, B., (2017).Performanceimprovementofmicrobialfuel cells for waste water treatment along with value addition:Areviewonpastachievementsandrecent perspectives.Renewable and Sustainable Energy Reviews,Vol.79,pp.372-389.
International Research Journal of Engineering and Technology (IRJET) e-ISSN: 2395-0056
Volume: 12 Issue: 06 | Jun 2025 www.irjet.net p-ISSN: 2395-0072
5) Du Z., Li H. and Gu T., (2007). A state of the art review on microbial fuel cells: a promising technology for wastewater treatment and bioenergy. Biotechnology Advances, Vol.25, No.5 pp.464-482.
6) Elakkiya E. and Matheswaran M., (2013), Comparisonofanodicmetabolismsinbioelectricity productionduringtreatmentofdairywastewaterin Microbial Fuel Cell. Bioresource Technology, Vol.136,pp.407-412.
7) Sonawane J.M., Yadav A., Ghosh P.C. and Adeloju S.B., (2017). Recent advances in the development andutilizationofmodernanodematerialsforhigh performance microbial fuel cells. Biosensors and Bioelectronics,Vol.90,pp.558-576.
8) Schröder U., (2007). Anodic electron transfer mechanismsinmicrobialfuelcellsandtheirenergy efficiency. PhysicalChemistryChemicalPhysics,Vol.9 No.21,pp.2619-2629.
9) ShowK.Y.,2008.Seafoodwastewatertreatment. In Handbookof WaterandEnergyManagementinFood Processing (pp.776-801).