
International Research Journal of Engineering and Technology (IRJET) e-ISSN:2395-0056
Volume: 12 Issue: 09 | Sep 2025 www.irjet.net p-ISSN:2395-0072
International Research Journal of Engineering and Technology (IRJET) e-ISSN:2395-0056
Volume: 12 Issue: 09 | Sep 2025 www.irjet.net p-ISSN:2395-0072
Sanat Punj1
1British School Jakarta, Indonesia ***
Abstract - This study proposes a novel, globally applicable framework for evaluating wind energy potential and identifying optimal sites for wind power generation, demonstrated through a case study in Indonesia. The framework integrates past meteorological and geospatial data, machine learning with hyperparameter tuning, and real-time GIS and weather data retrieval via API pipelines. The dataset, Wind Power Generation Data Forecasting, comprises 175,200 hourly observations from January 2017 to December 2022 across four geographically distinct turbine sites. Each record includes ten climatic variables (e.g., wind speed, direction at multiple heights, temperature, humidity) and turbine power output. Power output values were normalized on a 0-1 scale to enable consistent training across sites, where 1 represents maximum achievable power. Seven machine learning models were evaluated: ensemble tree-based (XGBoost, Gradient Boosting, Random Forest), neural-networks (ANN, RNN, GRU), and Support Vector Regression. Hyperparameters were systematically tuned, with model-performance assessed using MSE, RMSE, MAE, MedAE, and R². XGBoost achieved the best generalization, combining the lowest error metrics with the strongest fit, making it the optimal choice for deployment. Real-time GIS-based weather data was retrieved via the Copernicus Climate Data Store (CDSAPI) for fixed coordinate-intervals in Indonesia, filtered using the Natural Earth polygons dataset. The trained model assessed normalized wind energy potential at each coordinate, with values sampled across months and times, then averaged to estimate site-specific potential. Ultimately, 145 evenly spaced onshore coordinates (580 ERA5 grid points) generated 3,480 spatiotemporal instances, enabling a spatial map of Indonesia’s wind energy potential and identifying optimal turbine-placement sites
Key Words: Wind Energy Potential, Machine Learning, Geographic Information System, Renewable Energy, Wind Turbine, Optimisation, Indonesia
1.INTRODUCTION
Wind power has become a very popular energy resource recently, given its nature of producing clean and renewable energy. It provides electricity without burning fuel or polluting the air, being a technologically mature
source with no combustion and zero direct emissions (Particulate matter, Volatile Organic Compounds (VOC), Greenhouse Gases) [1]. Thus, various studies have been conductedinordertooptimizeandexploitwindenergyto maximize clean energy potential in various geographical areas in countries and provinces [2]. Common methodologies for analyzing Renewable Energy Potential inpreviousstudiesgivena particulargeographicalsetting include the popular Weibull Parameter Estimation Methods, which is dependent on using the statistical analysis of Wind Speed Data to estimate the shape and scale parameters of the Weibull Distribution [3]; some other common methods employed include heavy computational based statistical analysis methods including but not limited to the use of the Geographic InformationSystem(GIS)data.
Machine learning methods for assessing wind energy potential started to gain traction from the early 2000s with the initial use of Artificial Neural Networks (ANN) [4][5] and Support Vector Machines (SVM) [6] for wind forecasting and renewable energy potential estimation. These models were utilized in their specific domains for identifying nonlinear relationships and regression-based linear relationships. These models were able to dynamically adjust to different wind regimes based on training data, unlike certain statistical analytic methods, such as the Weibull, and were thus heavily proposed and utilised in studies during that era. With the increasing sophistication of Artificial Intelligence models as their performance optimizes at a groundbreaking rate over the last15-20years, machine learning algorithms such as the ensemble method, decision trees and deep learning methods such as the Recurrent Neural Network (RNN) became popularized improving prediction accuracyandhandlinglargedatasetsfromremotesensing technologiessuchastheLIDAR[7][8].
In the Indonesian context, the main challenges to implementing wind turbines are also the variability of conditionsanddifficultyinidentifyingoptimalsitesforthe windturbineinstallation,asidentifiedbythefamousbook by Taufal Hidayat, “Wind Power in Indonesia: Potential, Challenges, and Current Technology Overview“ [9]. By integratingGISandmachinelearningmethods,theseareas
International Research Journal of Engineering and Technology (IRJET) e-ISSN:2395-0056
Volume: 12 Issue: 09 | Sep 2025 www.irjet.net p-ISSN:2395-0072
can be accurately mapped, enabling the identification of optimalwindpowergenerationsitesbasedonwindspeed data, land use constraints, and environmental factors. By using APIs that work for any given country, a reliable framework can be developed for wind energy potential analysisinanygivencountry.
This research is particularly relevant for Indonesia, as Indonesia has 60.6 GW of onshore wind energy potential according to the Indonesian Ministry of Energy and Mineral Resources [9]. However, less than 0.1% of the windenergypotentialisbeingutilised[9].TheIndonesian government has set large-scale and ambitious targets for achieving net-zero emissions by utilising renewable energy and has urged development in terms of wind energy, recently starting to develop and implement some turbines. There have not been any notable studies on assessing wind energy potential throughout Indonesia to identify plausible locations for generating large amounts ofwindenergy, makingthis study particularlycrucialand novel[9].
This study proposes a working framework for evaluating thewindenergypotentialofdifferentsites,withaspecific focus on Indonesia, by integrating past data analysis, model benchmarking, and real-time geospatial weather dataretrieval.Thisframeworkisapplicablegloballyforall countries.
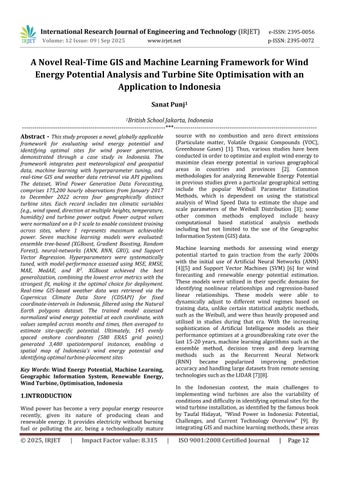
-1:ProposedFrameworkofthestudy
The framework developed by this research paper to find thewindenergypotentialofIndonesiaisthefollowing:
1. Identify a suitable dataset that combines climatic GIS and weather data from an existing wind turbine’ s surroundings with the corresponding windpoweroutput.
2. Study past research papers to identify commonly usedmodelsforpredictingwindenergypotential.
3. Evaluate different types of machine learning models to determine the optimal one for predicting wind energy potential, based on standardised hyperparameter tuning of each individualmodel.
4. Find a suitable and reputable online dataset with live tracking of weather and GIS data values, as required by the model, in real time for all global coordinates.
5. Generate fixed coordinate intervals in Indonesia and verify their onshore nature using polygon mappingofIndonesia’sboundaries.
6. Develop a data pipeline for Indonesia to retrieve real-timeweatherandGISdataviaAPIcalls
7. Parse the API data through optimal machine learningtoassesswindenergypotential
8. Assess the wind energy potential (normalised) in differentregionsofIndonesiabasedonthemodel outputs and API data values, and generate a spatialmap.
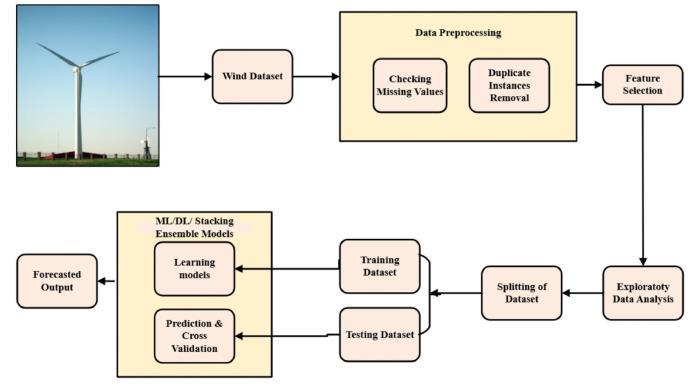
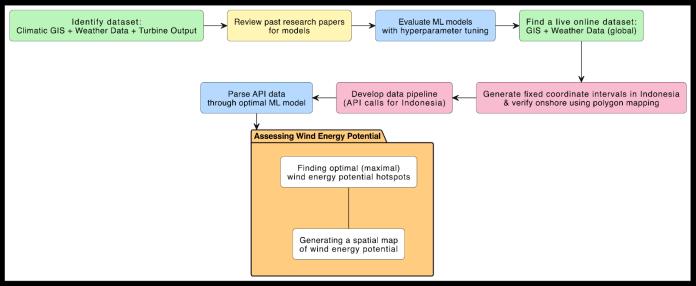
Fig -2:Workflowfordevelopingaccuratemodels assessingwindenergypotential[10]
The workflow of the methodology is adapted from previous studies, as shown in the figure above. Specifically, the study adopted 80-20 data splitting between testing and training. The forecasted output for the best set of hyperparameters was compared for each distinctmodeltoevaluateandfindtheoptimalmodel.
Thedataset chosento beusedinthis research was “Wind PowerGenerationData–Forecasting”byMubashirRahim [11], which is a compilation of environmental
International Research Journal of Engineering and Technology (IRJET) e-ISSN:2395-0056
Volume: 12 Issue: 09 | Sep 2025 www.irjet.net p-ISSN:2395-0072
observations and wind power generation data from a company's wind turbine sites. The dataset comprises hourly meteorological and wind turbine power output measurements from four sites located in different places, making it geographically diverse and thus more reliable due to the diversity of data. It comprises hourly meteorological and power output measurements over a continuous6-yearperiodfromJanuary2017toDecember 2022. This equates to 42,800 rows of data for each location,totalling175,200rowsintheentiredataset.
Thus,thedatahasanextensivetemporaldepth,capturing both intra-annual seasonal cycles and inter-annual climatic variability. Along with this, the inclusion of multiple sites spanning distinct geographical areas also ensures that the dataset encapsulates heterogeneity in wind patterns, temperature, and atmospheric conditions for developing models with strong spatial generalisation, withoutoverfittingtosite-specificdata.
Thisdesignchoiceispivotalfortheaimofthepaper,since many countries, including Indonesia, do not have many existing wind energy power plants, with Indonesia only having 0.15 GW utilised till 2020. Thus, models that generalisewellbeyondtheirtrainingdomainarerequired.
Each observation contains ten core variables: the timestamp (date and time), temperature at 2 m, relative humidity at 2 m, dew point at 2 m, wind speed at 10 m, wind speed at 100 m, wind direction at 10 m, wind directionat100m,windgustsat10m,andthenormalized turbine output (Power). These parameters collectively provide a comprehensive representation of the atmospheric and environmental conditions that affect turbineperformance,asusedbypastresearch
Preprocessing involved deriving Year and Month from timestamps, facilitating temporal pattern recognition and seasonal trend modelling more easily with the dataset. The dataset contained no missing values or duplicate instances, ensuring statistical reliability during model training.
Fig -3:Analysingdatasetfeaturesdistributions
Initial inspection of the variable distributions, through Figure 3, revealed several notable features. Temperature and dew point exhibited bimodal patterns, reflecting the alternation between wet and dry seasons in tropical and coastal Indonesian climates. Relative humidity values are clusteredpredominantlybetween70–100%,underscoring the dataset’ s representation of high-moisture air masses typical in Indonesia, which have fluctuated typically from 69%to91%.[12]
This section illustrates the choice of a machine learning model to train on this dataset, and the methodology used bythispapertotunehyperparameters.Basedonprevious studies on wind turbine power output prediction, ensemble tree-based models [13], neural network [14], and kernel-based regression [15] models were optimal models to capture non-linear relationships, non-linear dependencies & higher-dimensional trends, respectively, giventheregressionnatureofthepoweroutput,duetoits continuousvalues.
The specific models identified through previous research and eventually compared for this study were XGBoost (XGB),GradientBoostingRegressor(GBR),RandomForest Regressor (RF), Gated Recurrent Units (GRU), Recurrent Neural Networks (RNN), Artificial Neural Networks (ANN), and Support Vector Regression (SVR).For clarity, the RNN implemented in this work was a vanilla RNN,
International Research Journal of Engineering and Technology (IRJET) e-ISSN:2395-0056
Volume: 12 Issue: 09 | Sep 2025 www.irjet.net
representing the simplest recurrent architecture without gating mechanisms, while the ANN was a dense ANN, employing fully connected layers to capture complex nonlinear relationships. The diversity in model selection enables a more comprehensive evaluation of algorithmic suitability for wind turbine power output forecasting, ensuring that both temporal and non-temporal predictive patterns are adequately observed and considered. The diverse set of models enables the comprehensive determination of the suitable algorithm for forecasting wind turbine power output by ensuring that both temporal and non-temporal predictive patterns are adequatelyobservedandconsidered.
To ensure methodological rigour and comparability to select the optimal model, all candidate models were implemented with a fixed random seed (42) to maintain reproducibility Hyperparameter optimisation was conducted using Grid Search Cross-Validation (GridSearchCV) with early stopping where feasible, thus balancing the need for thorough parameter exploration againstcomputationalconstraints. Otherwise,GridSearch features were implemented manually, looping over differentparameters.
For ensemble tree-based models, which are Random Forest (RF), Gradient Boosting Regressor (GBR), and XGBoost (XGB), hyperparameter ranges were selected to explore bothshallowand deep treestructures in order to capture the complex, non-linear interactions observed in
p-ISSN:2395-0072
the dataset between wind speed, gusts, and turbine output.Thenumberofestimatorswasvariedbetween100 and 200 to assess the trade-off between computational efficiency and variance reduction, while the maximum depth parameter was tested at5, 10,andunlimited levels in RF, and at 5 and 10 for GBR and XGB, in order to evaluate the bias-variance trade-off. For GBR and XGB, learning rates of 0.05 and 0.1 were included, since lower rates can enhance generalisation while higher rates accelerate convergence without necessarily introducing severeoverfitting.
Neural network architectures, Artificial Neural Networks (ANN), Recurrent Neural Networks (RNN), and Gated Recurrent Units (GRU), were configured with 32 and 64 units to regulate model capacity, while batch sizes of 32, 64, and 128 were examined to study their influence on convergence behaviour and generalisation performance. Epoch counts were set at 30 and 50 to ensure sufficient training cycles for convergence without overfitting data. This is an important consideration due to the temporal structure of the dataset and the presence of cyclical, seasonal patterns. For the Support Vector Regressor (SVR), parameter tuning was deliberately constrained to twovaluesofthepenaltyparameterC(10and50),witha gamma value of 0.01 to promote smooth decision boundaries, and an epsilon of 0.1 to permit minor prediction deviations, avoiding overfitting to atmospheric noisethatcouldbeexhibitedinthedata.
Table -1: ComparativePerformanceMetricsofMachineLearningModelsforWindTurbinePowerPredictionbasedon5 keymetrics:MeanSquaredError(MSE),RootMeanSquaredError(RMSE),MeanAbsoluteError(MAE),MedianAbsolute Error(MedAE),CoefficientofDetermination(R²)
Gradient Boosting Regressor(GBR)
Random Forest Regression(RF)
Gated Recurrent Unit (GRU)
Recurrent Neural Network(VanillaRNN)
Artificial Neural Network(DenseANN)
Support Vector Regression(SVR)
International Research Journal of Engineering and Technology (IRJET) e-ISSN:2395-0056
Volume: 12 Issue: 09 | Sep 2025 www.irjet.net
Performanceevaluationonthetestset,asseeninTable1, demonstrated a clear advantage for ensemble tree-based methods,whichconsistentlyachievedR²valuesexceeding 0.66 alongside the lowest error metrics. XGBoost in particular achieved the best overall generalisation, producing the lowest MSE (0.0220440), RMSE (0.1484723), MAE (0.1104790), and Median AE (0.0826255), while maintaining a competitive R² of 0.6654. GBR attained the highest R² value (0.6694) but with slightly worse error performance compared to XGB (MSE, RMSE, MAE, MedAE). Whereas RF offered a robust and interpretable baseline, achieving an R² of 0.6617 and an MAE of 0.1107704, its predictive performance was marginally lower than XGB (R² = 0.6654, MAE = 0.1104790andGBR(R²=0.6694,MAE=0.1107704).
Neuralmodelsdisplayedmoderateresults,withR²values between 0.605 and 0.653, suggesting that while these architecturescanlearnnon-linearpatterns,theywereless accurate in this context due to the absence of extensive temporal feature engineering. The GRU outperformed ANN and RNN among neural models. This was likely due to its ability to retain longer temporal dependencies, which aligns with the sequential nature of wind speed fluctuations observed in the dataset. In contrast, the SVR performed worst, with an R² of 0.54, reflecting both its limitedparametertuningrangeanditspoorscalabilityfor thehigh-volumedatausedinthisstudy.
As such, XGBoost was selected as the optimal model for subsequent wind energy potential analysis forintegration into an API-based pipeline capable of taking live weather datafromaclimaticdatasettogeneratespatiallyresolved forecastsforoptimalturbineplacementinIndonesia.
2.5 Generating fixed coordinate intervals in Indonesia with Polygon Mapping
Indonesia’ s latitude bounds were identified as –11° to 6°, where–11°representstheminimumand6°themaximum latitude[16].Similarly,thelongitudeboundsweredefined as 95° to 141°, with 95° as the minimum and 141° as the maximum. These values were obtained by rounding the lower bounds down and the upper bounds up to prevent excludinganyareas.
Togeneratetestingcoordinatesforwindenergypotential, a rectangular bound was defined using Indonesia’ s latitudeandlongitudelimits,withastepsizeof1°applied to both. This step size ensured reliability, yielding 145 coordinate points evenly spread across the Indonesian map for testing. Smaller step sizes would improve precision, but also require iterating through many more points; 1° was found to be a suitable step size after visualisationonIndonesia’ smap.
p-ISSN:2395-0072
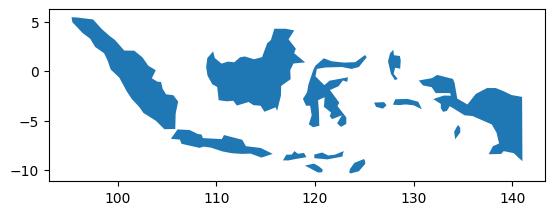
Fig -4: Indonesiamappedthroughthe ne_110m_admins_0_countriesdatasetfromtheNatural EarthDatasetsingPython’sGeopandasLibrary.Thex-axis andy-axisrepresentthelongitude(°)andlatitude(°), respectively
As shown in Figure 4, to check whether the coordinates are valid onshore coordinates in Indonesia, this research made use of the polygons of Indonesia that have been mapped by the country polygons shapefile from the Natural Earth dataset (ne_110m_admins_0_countries dataset) [17]. This dataset sets and defines Indonesia’ s accurate bounds. This dataset was used in this study to check whether a point was contained within the land ofn Indonesia,toverifyitsonshorenature.
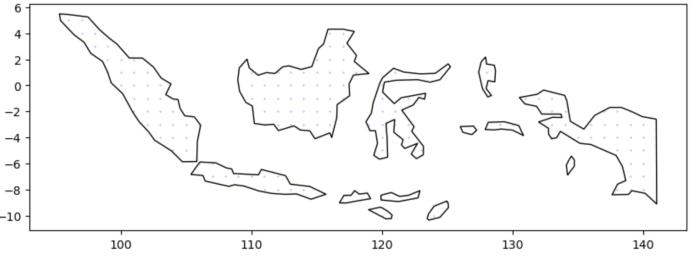
Fig -5: Indonesiamappedwithfilteredcoordinates throughthene_110m_admins_0_countriesdatasetfrom theNaturalEarthDatasetusingPython’sGeopandas library;Thex-axisandthe y-axisrepresentthelongitude (°)andlatitude(°),respectively
Figure 5 shows the filtered coordinate points (longitudelatitudepairs)plottedwithinIndonesia’spolygonfromthe NaturalEarthdataset,afterapplyingtheonshorefiltering. The map is generated using a latitude and longitude step sizeof1,asdefinedbefore.
Thepurposeofgeneratingthesecoordinateswastocreate evenly spaced onshore test points across Indonesia for reliably evaluating wind energy potential and finding the optimalturbineplacementlocations.
The live dataset employed by this research paper is the Copernicus ERA5 Hourly dataset [18], as it is a highly reputableandaccuratelivedatasetthathasbeenupdated
International Research Journal of Engineering and Technology (IRJET) e-ISSN:2395-0056
Volume: 12 Issue: 09 | Sep 2025 www.irjet.net
for more than 80 years, demonstrating remarkable reliability and stability. Previous research has shown the dataset to be more accurate than other famous meteorological datasets, such as the MERRA-2, in every single season. Furthermore, research shows how ERA5 captures detailed variations in complex and coastal regions,makingitsuperiortootherexistingdatasets[19]. This especially makes it the optimal dataset for studying the Wind energy potential in Indonesia, given that its coastline exceeds 50,000 km with more than 17,000 islands.
ERA5 provides hourly measurements of numerous atmospheric variables at high spatial resolution, enabling precise environmental characterisation for wind energy assessments. Its comprehensive nature and open accessibility, even fora largenumber ofAPI calls, madeit an ideal choice for real-time geospatial modelling in this studyandintheframework.
To retrieve the required environmental features, an interface with the Copernicus Climate Data Store (CDS) API [20] was developed using the ‘cdsapi ’Python library. The pipeline iterated over a predefined set of onshore coordinates in Indonesia, identified in earlier stages via polygon mapping of the national boundaries, and extracted data for each location individually. For each coordinate, a small surrounding area (±0.2° latitude and longitude)wasretrievedfromtheERA5dataset,yielding4 grid points per coordinate. These points were then averaged to produce a single representative wind energy value for each location, reducing grid-level noise and ensuringreliableestimatesofwindpotential
In total, 145 onshore coordinates were initially selected across Indonesia. Due to the ERA5 dataset’ s fixed 0.25° × 0.25°spatialresolution, eachcoordinatecoveredacluster of 4 grid points, yielding 580 distinct locations. For each location, data were extracted for three representative months (January, April, August) and two daily time steps (00:00 and 12:00 UTC), resulting in 6 temporal samples per location. Altogether, this produced 3,480 individual instancesthatwerepreprocessedandeventuallyanalyzed bythemodel,bolsteringitsaccuracy.
Following the retrieval of the API data, all Numerical Control (NC) data files that were generated from the API calls were merged into a single file by using Python’ s ‘Xarray ’library to concatenate points along the ‘point ’ dimension
The dataset was subjected to preprocessing to ensure compatibility with the XGBoost model developed previouslyonthewindturbinedataset.Observationswith
p-ISSN:2395-0072
missing values for all key meteorological variables were removed during model training. Temperature values, originally provided in Kelvin, were first converted to degrees Celsius for physical calculations and then to degrees Fahrenheit for consistency with units used in the modeltrainingdataset.
In addition to temperature, other meteorological parameters retrieved included near-surface dewpoint temperature (2 metres) as well as horizontal and vertical wind components at both 10 m and 100 m heights. Since relativehumidityisnotdirectlyprovidedinthedataset,it can be derived from the air temperature and dewpoint temperature.
Relativehumidity(RH)isdefinedastheratiooftheactual vaporpressure e(Td) tothesaturationvaporpressure e(T), expressedasapercentage[21]:
���� =100× ��(����) ��(��)
where T is the air temperature (°C), and Td is the dew pointtemperature(°C).
The saturation vapor pressure e(T) can be estimated by the Magnus-Tetens equation. Substituting Td for T gives the actual vapor pressure. The saturation vapor pressure e(T) is estimated using the Magnus-Tetens approximation:
��(��)=61078������ 75�� ��+2373
Substitutingthedewpointtemperature(Td)forTgivesthe actual vapor pressure. Thus, relative humidity is calculatedas: ���� =100×
The wind speed and wind direction need to be derived fromthegivenhorizontal(u)andvertical(v)components ofvelocity,duetotherequirementofthemodel.
From these, wind speed and wind direction were derived usingthefollowingrelationships:
Windspeed= ��2 +��2
Winddirection=(270∘ ������������ �� �� × 180 �� )������360
International Research Journal of Engineering and Technology (IRJET) e-ISSN:2395-0056
Volume: 12 Issue: 09 | Sep 2025 www.irjet.net p-ISSN:2395-0072
Thesetransformationswereappliedatboth10mand100 m heights, yielding two sets of wind speed and wind directionvalues.
This merged dataset of environmental data was parsed through the optimized XGBoost model to find the normalisedwindturbinepoweroutputforeachindividual instance(row).Thesecalculationsaremadeatthesample level, rather than as averages across longitude-latitude pairsaggregatedovermultipleinstances.Theresultswere then ranked in descending order of predicted turbine output,asshowninthefigurebelow.
Table -2: Maximalnormalisedwindenergyoutputvalues fromallinstancesofdata
Table -3: Showingthe5maximalnormalisedwindenergy outputvaluesfromthe580ERA5gridlocations
Table 2 highlights the five samples with the highest predicted outputs in the dataset. The maximum turbine output was identified at a latitude of -3.2 and a longitude of129.8, duringthemonth ofDecember, with a predicted power value of 0.518589. This demonstrates the capacity of the model to pinpoint precise locations and time periodswherewindenergypotentialismaximized.
Notably, all five top-ranked normalised power output instancesoccurredinJanuary,indicatingthatwindenergy potential is greatest during January, compared to April andAugust.
Since turbine output varies across months and times due to seasonal and diurnal changes, the predictions are averaged across the months (January, April, August) and time steps (00:00 and 12:00 UTC) for each coordinate in subsequent analysis for 580 ERA5 grid locations. This provides fair estimates of the mean normalised wind energypotentialateachlocation,servingasanindicatorof the site’ s suitability for turbine installation over an entire year.
As shown in Table 3, the maximum turbine output was identified at a latitude of -8.2 and a longitude of 138.05, with a predicted mean normalized power value of 0.302673. It can be observed that the longitude range producingthemaximal windpowerlies between 138and 139.05, which encompasses the 4 greatest mean normalizedpowervalues.
Furthermore, the latitude range with the maximum potentialforwindpowerextendsfrom-8.2to-7.95,with4 coordinates within the band producing the 1st to 4th highestmeannormalisedpowers.Specifically,thelatitude of -8.2 produced the 1st, 2nd, and 4th highest mean normalized powers, rendering it optimal for wind turbines.
Geographically, this high-potential cluster lies in the southernpartofPapua(PapuaProvince,Indonesia),close to the Arafura Sea. This coastal region is known to experienceconsistent tradewinds, which mayexplainthe highwindenergypotential
These findings suggest that southern Papua, particularly along the coastal band between -8.2 to -7.95 latitude and 138 to 139.05 longitude, would be the most optimal zone for wind turbine installation. The consistent clustering of high values within a narrow range strengthens the reliability of this area as a potential wind energy hotspot. Southern Papua has previously been identified as a locationwithpromisingwindenergypotential,supporting the results of this study [22][23], which identify that it could be the most optimal location for installing wind turbinesinIndonesia.
Importantly, such locations arerelatively underdeveloped in terms of renewable energy infrastructure, highlighting theopportunityforwindenergypotential.
Beyond the primary hotspot identified around latitude8.20 to - 7.95 and longitude 138.05 to 139.80 (Southern Papua), several other regions also demonstrated
International Research Journal of Engineering and Technology (IRJET) e-ISSN:2395-0056
Volume: 12 Issue: 09 | Sep 2025 www.irjet.net p-ISSN:2395-0072
comparatively high mean normalized wind power potential.Somenotablelocationsincludeareasnear-3.20, 129.80 to 130.05 (Ambon, Maluku) and -3.95, 133.05 (Kaimana, West Papua), which consistently record values above0.23.
Additionally,centralregionssuchas-2.95to-3.20,110.80 to 112.05 (Central Kalimantan) and western zones near5.95 to -7.20, 107.05 to 108.80 (southern West Java) exhibitpromisingwindenergypotentialwithmeanpower valuesintherangeof0.22–0.23.
These findings suggest that, while eastern Indonesia demonstrates particularly strong potential, multiple regions across the archipelago, spanning Papua, Maluku, Kalimantan, and Java, also have a large wind energy potentialandareviableforturbineinstallation.
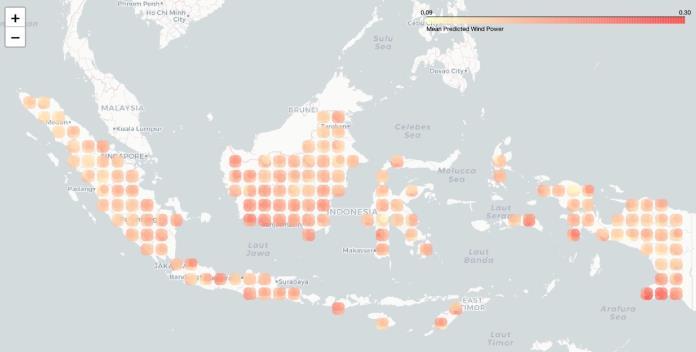
Fig -6: SpatialmapofwindenergypotentialinIndonesia
As part of this study, a spatial map of wind energy potential across Indonesia was generated (Figure 6). The map illustrates the comparative distribution of wind energy potential across Indonesia, where darker, redder areas signify a higher wind power generation on average, as opposed to lighter yellow, orange colors. The map shows the presence of clusters of high wind energy potential in eastern Indonesia, particularly Southern Papua and parts of Maluku. In contrast, much of Sumatra, Kalimantan, and Java is dominated by milder red shading, suggesting comparatively lower but still viable wind resources.
This map reinforces the quantitative findings observed through the tables and the output of code by illustrating that Indonesia’ s strongest wind energy potential is concentrated in the eastern islands (Papua, Maluku, and parts of East Nusa Tenggara), while mildly western and central regions (Java, Sumatra, Kalimantan) display moderatesuitability.
In contrast, the westernmost regions of Indonesia show the lowest levels of wind energy potential. Lighter yellow and orange areas cover most of northern Sumatra, particularly around Medan, extending to Padang and
further to the western land directly above Jakarta. These zones reflect much weaker wind energy potential (wind energy potentials as low as 0.089906) compared to the darker red clusters in central, eastern Indonesia, indicating that large-scale wind turbine development in theseregionsmaybelessfavorable.
Such insights are critical for guiding the strategic placement of turbines, ensuring investment is directed toward areas with consistently higher potential for generatingwindenergy.
This study developed and demonstrated a practical, globally applicable framework for wind energy resource assessmentthatintegratespastturbineperformancedata, model benchmarking, and real-time geospatial weather retrieval via API. On the Wind Power Generation Data –Forecasting dataset (175,200 hourly observations from 2017–2022 across four locations), XGBoost emerged as the preferred model after preprocessing and systematic hyperparameter tuning against ensemble tree methods, simple neural baselines, and a kernel regression model. Using the trained model, we retrieved ERA5 fields over onshore Indonesia (filtered with Natural Earth polygons) andpredictednormalized turbinepoweratevenlyspaced coordinates.
Applied to 145 onshore seed coordinates (aggregating to 580ERA5gridpointsand3,480spatiotemporalsamples), the framework generated high-resolution maps of normalizedwindoutput.Thestrongesthotspotappearsin Southern Papua, particularly the coastal band between latitudes −8.20 to −7.95 and longitudes 138.05 to 139.80. Additional promising clusters include Ambon (Maluku), Kaimana (West Papua), Central Kalimantan, and parts of WestJava,whilewesternIndonesia(Java,Sumatra)shows moderate but viable resources. The maximum mean predictedoutputamongsampledlocationswasatlatitude −8.2, longitude 138.05, with a normalized value of 0.302673.
These results should be interpreted as a first-pass resource screening rather than bankable micro-siting. ERA5’ s 0.25° grid under-resolves complex coastal and orographic flows common in Indonesia; our neural baselines were not sequence-optimized; and we did not model wakes, extreme winds, grid proximity, or economics(e.g.,LCOE).Theseconstraintsdefinethescope butdonotdiminishtheframework’ sutilityforidentifying wheretoinvestigatefurther.
Looking ahead, the same pipeline can be strengthened with denser sampling over hotspots, sequence-aware models, and higher-resolution or local measurements for
© 2025, IRJET | Impact Factor value: 8.315 | ISO 9001:2008 Certified Journal | Page19
International Research Journal of Engineering and Technology (IRJET) e-ISSN:2395-0056
Volume: 12 Issue: 09 | Sep 2025 www.irjet.net p-ISSN:2395-0072
downscaling and validation. Incorporating additional constraints, such as distance to transmission/roads and environmental buffers, will convert resource maps into more actionable resource-constrained suitability maps. Despite these limitations, the framework is reproducible, transferable to other countries by swapping coordinate sets, and immediately useful for guiding subsequent measurementsandplanningforrenewabledeployment.
1. R. Salsabila, M. S. Perdani, N. S. Kitakawa, and H. Hermansyah, “Production of methyl caffeate as an intermediate product to produce caffeic acid phenethyl ester by esterification using cationexchange resin,” Energy Reports, vol. 6, pp. 528–533, Feb. 2020, doi: https://doi.org/10.1016/j.egyr.2019.09.020.
2. M. T. Khan, G. A. Thopil, and J. Lalk, “Review of proposalsforpracticalpowersectorrestructuringand reforms in a dynamic electricity supply industry,” Renewable and Sustainable Energy Reviews, vol. 62, pp. 326–335, Sep. 2016, doi: https://doi.org/10.1016/j.rser.2016.04.056.
3. A. Bulut and O. Bingöl, “Weibull parameter estimation methods on wind energy applications - a review of recent developments,” Theoretical and Applied Climatology, vol. 155, no. 10, pp. 9157–9184, Oct. 2024, doi: https://doi.org/10.1007/s00704-02405184-2.
4. M.A.Obeidat,B.N.AlAmeryeen,A.M.Mansour,H.Al Salem, and A. M. Eial Awwad, “Wind Power Forecasting using Artificial Neural Network,” WSEAS TRANSACTIONS ON POWER SYSTEMS,vol.17,pp.269–279, Sep. 2022, doi: https://doi.org/10.37394/232016.2022.17.28.
5. F. Dias and A. J. Naik, “Wind Power Prediction Model Using Artificial Neural Network,” E3S Web of Conferences, vol. 472, p. 03008, 2024, doi: https://doi.org/10.1051/e3sconf/202447203008.
6. J. Zeng and W. Qiao, “Support vector machine-based short-termwindpowerforecasting,” IEEE Xplore,Mar. 01, 2011. https://ieeexplore.ieee.org/stamp/stamp.jsp?tp=&arn umber=5772573(accessedAug.22,2025).
7. S. Zhang, E. Robinson, and M. Basu, “Wind power forecasting based on a novel gated recurrent neural network model,” Wind Energy and Engineering Research, vol. 1, p. 100004, Aug. 2024, doi: https://doi.org/10.1016/j.weer.2024.100004.
8. “Remote Sensing,” Mdpi.com, 2025. https://www.mdpi.com/journal/remotesensing/speci al_issues/Wind_Energy_RS(accessedAug.22,2025).
9. T. Hidayat, “Wind Power in Indonesia: Potential, Challenges, and Current Technology Overview,” Indonesia Post-Pandemic Outlook: Strategy towards Net-Zero Emissions by 2060 from the Renewables and Carbon-Neutral Energy Perspectives, Nov. 2022, doi: https://doi.org/10.55981/brin.562.c7.
10. T.A.RajaperumalandC.C.Columbus, “Enhancedwind power forecasting using machine learning, deep learning models and ensemble integration.,” PubMed, vol. 15, no. 1, pp. 20572–20572, Jul. 2025, doi: https://doi.org/10.1038/s41598-025-05250-3.
11. M. Rahim, “Wind Power Generation DataForecasting,” Kaggle.com, 2017. https://www.kaggle.com/datasets/mubashirrahim/w ind-power-generation-data-forecasting (accessed Aug. 22,2025).
12. Nomadseason.com, 2025. https://nomadseason.com/climate/indonesia/index.h tml(accessedAug.22,2025).
13. C. Cakiroglu, S. Demir, M. Hakan Ozdemir, B. Latif Aylak, G. Sariisik, and L. Abualigah, “Data-driven interpretable ensemble learning methods for the prediction of wind turbine power incorporating SHAP analysis,” Expert Systems with Applications, vol. 237, p. 121464, Mar. 2024, doi: https://doi.org/10.1016/j.eswa.2023.121464.
14. J. Jamii, M.Mansouri, M. Trabelsi, M. F.Mimouni,and W. Shatanawi, “Effective artificial neural networkbased wind power generation and load demand forecasting for optimum energy management,” Frontiers in Energy Research, vol. 10, Oct. 2022, doi: https://doi.org/10.3389/fenrg.2022.898413.
15. Y. Wang, X. Duan, D. Song, R.Zou,F.Zhang, and Y.Li, “Wind Power Curve Modeling With Large-Scale Generalized Kernel-Based Regression Model,” IEEE Transactions on Sustainable Energy, vol. 14, no. 4, pp. 2121–2132, May 2023, doi: https://doi.org/10.1109/tste.2023.3276906.
16. “Indonesia Latitude and Longitude Map,” Mapsofworld.com, 2020. https://www.mapsofworld.com/lat_long/indonesialat-long.html#google_vignette (accessed Aug. 22, 2025).
International Research Journal of Engineering and Technology (IRJET) e-ISSN:2395-0056
17. “Admin 0 - Countries,” Admin 0 - Countries https://www.naturalearthdata.com/downloads/10mcultural-vectors/10m-admin-0-countries/
18. ECMWF, “ERA5 hourly data on single levels from 1940 to present,” Copernicus.eu, Jun. 14, 2018. https://cds.climate.copernicus.eu/datasets/reanalysis -era5-single-levels?tab=overview (accessed Aug. 22, 2025).
19. G. T. Kara and Tolga Elbir, “Seasonal and spatial variabilityintheaccuracyofhourlyERA5andMERRA2 reanalysis datasets: A 14-year comparison with observedmeteorologicaldatainTürkiye,” Atmospheric Research, pp. 108233–108233, Aug. 2025, doi: https://doi.org/10.1016/j.atmosres.2025.108233.
20. “CDSAPI setup,” Copernicus.eu, 2024. https://cds.climate.copernicus.eu/how-to-api (accessedAug.22,2025).
21. A. DeCaria , “ESCI 340 - Cloud Physics and PrecipitationProcessesLesson2-Thermodynamicsof Moist Air,” Accessed: Aug. 22, 2025. [Online]. Available: https://blogs.millersville.edu/adecaria/files/2021/11 /esci340-Lesson02-Thermodynamics.pdf
22. J. Karim, F. H. Sumbung, and D. Hardiantono, “THE WIND ENERGY POTENTIAL IN COASTAL AREAS OF MERAUKE CITY,” Engineering and Technology Journal, vol. 8, no. 08, Aug. 2023, doi: https://doi.org/10.47191/etj/v8i8.14.
23. E. Koons, “Wind Energy In Indonesia: Slow Growth, PromisingFuture,” Energy Tracker Asia,Feb.22,2024. https://energytracker.asia/wind-energy-indonesia/ (accessedAug.22,2025).
Volume: 12 Issue: 09 | Sep 2025 www.irjet.net p-ISSN:2395-0072 © 2025, IRJET | Impact Factor value: 8.315 | ISO 9001:2008