International Research Journal of Engineering and Technology (IRJET) e-ISSN: 2395-0056
Volume: 12 Issue: 01 | Jan 2025 www.irjet.net p-ISSN: 2395-0072


International Research Journal of Engineering and Technology (IRJET) e-ISSN: 2395-0056
Volume: 12 Issue: 01 | Jan 2025 www.irjet.net p-ISSN: 2395-0072
N G Ajjanna1, Anandini K2, Mahalakshmi G3, Vedashree G4, Vishaka U5
1Asst Professor, Dept. of E&E, JNNCE, Shimoga, Karnataka. 2,3,4,5 E&E Department final year Students of JNNCE, Shimoga, Karnataka.
Abstract:
Demand for electricity and energy bills is continuouslyincreasingeveryyearduetotheriseinconnected loads at the campus and the increase in energy cost per unit from the supply company. This paper presents a comprehensive performance analysis of a 400 kW Rooftop Solar Photovoltaic (RTSPV) system installed at JNNCE Shimoga, Karnataka. The study evaluates energy generation, system efficiency, and economic viability over a defined operationalperiod.TomeettheelectricityneedsoftheJNNCE campus, reduce carbon emissions, and provide a practical learning facility for students in solar photovoltaic system a 400kW capacity roof-top solar PV system (RTPSV) has been installed. The study yields the result that the installation of a 400 kW Roof Top Solar Photo Voltaic system produces 4,68,370 units of electrical energy per annum. JNNCE consumed 5,59,795 units per annum. The solar power plant produces 83.66% of the electrical energy required by JNNCE. To meet 100% electricity from solar power plant 64 kW solar plant is to be added, which produces revenue of Rs 7,77,100 per year, Rs 31,74,000 investment required to install additional plant. The payback period for the additional plant willbe4 years 1 months. additionalplant generates a savings of Rs 1,63,19,325 in its life time. Performance of the solar PV systembeforeandaftercleaningthepanelisalsodetermined, 0.4% of efficiency of the solar plant increases due to the cleaning of solar panel twice in a month.
Key words: Solar PV System, CO2 Emission, Payback Period, Performance Ratio.
Introduction:
The increasing demand for renewable energy sources, coupled with the growing concerns over environmental sustainability, has led to significant advancements in solar energy technologies. Among these, rooftop solar photovoltaic (RTSPV) systems have gained substantial popularityduetotheirabilitytoharnesssolar power directly from buildings, offering a decentralized, clean,andcost-effectiveenergysolution[1].InIndia,where solarenergypotentialisabundant,theinstallationoflargescaleRTSPVsystemshasbecomea keystrategytoreduce dependencyonconventionalfossilfuels,lowergreenhouse gas emissions, and address the country’s rising electricity
demand[2].Thisstudyfocusesontheperformanceanalysis ofa400kWRTSPVsysteminstalledattheJawaharlalNehru NationalCollegeofEngineering(JNNCE),locatedinShimoga, Karnataka. The system, operational since its installation, provides clean energy to the college campus, reducing its carbonfootprintandcontributingtosustainableenergyuse. Theperformanceofthesystemisevaluatedbyanalyzingkey parameterssuchasenergygeneration,efficiency,capacity utilization,andtheoveralleconomicbenefitsaccruedfrom theintegrationofthesolarsystemintothecollege’spower grid[5].Theprimaryobjectiveofthisanalysisistoassess theoperationalefficiencyandreliabilityoftheRTSPVsystem over time, with particular emphasis on understanding its energy production patterns, system losses, and impact on electricity consumption. Additionally, the study aims to identify any challenges faced during operation, such as performancedegradationormaintenanceissues,andoffer recommendationsforoptimizingthesystem’sperformance infutureinstallations.Thefindingsofthisanalysiscanserve asvaluableinsightsforacademicinstitutions,government bodies,andindustrieslookingtoadoptsimilarsolarenergy solutions to meet their power needs while promoting environmentalsustainability[11].
Thecasestudyof400kWrooftopsolarphotovoltaicsystem involvesdataCollection,dataanalysis,performanceanalysis andperformanceevaluationbyexperimentalmethod.The hardware components installed are examined onsite and followingdataiscollected:
1. Before cleaning solar panel on 09-11-2024: Radiation in W/m2 using solar power meter, InverterPowerinwattsfrominverteratEE-1.
2. Aftercleaningsolarpanelon27-11-2024:Radiation inW/m2usingsolarpowermeter,InverterPower inwattsfrominverteratEE-1.
FromtheobtaineddatatheperformanceanalysisofsolarPV system installed at EE-1 block, JNNCE, Shimoga before cleaning and after cleaning the dust on solar panels is examinedandcompared.Thepowerestimatedfromsolar radiationatEE-1,ConversionEfficiency,andEnergyinkWh isevaluated andcompared bymeans offollowinggraphs-

International Research Journal of Engineering and
Volume: 12 Issue: 01 | Jan 2025 www.irjet.net
RadiationinW/m2v/sTimeinhrs.,Inverterpowerinwatts atEE1v/sTimeinhrs.,ConversionEfficiencyv/sTime in hrs.,EnergyinkWhv/sTimeinhrs.
The electrical energy generation, consumption, export, importandshortageorexcessofelectricalenergyfromplant to grid is calculated and compared using 2022-2023 and
Block diagram of solar PV system:
Solarpanels,madeupofphotovoltaic(PV)cells,are theprimarycomponentthatcapturessunlightandconverts it into direct current (DC) electricity through the photovoltaiceffect.Thisdirectcurrentisfedtotheinverters areessentialforconvertingtheDCelectricitygeneratedby the solar panels into alternating current (AC) electricity, which is suitable for use by the electrical grid or for local consumption. The termination box consolidates the AC output from each inverter and ensures they are properly routed to a common system bus or further electrical infrastructure, ensuring an organized and efficient distributionofpower.The AC Distribution Board: (ACDB) is a key component in an AC system for distributing the outputofthe inverters tovariousloads,protectivedevices, or the grid. The ACDB is connected to the output of the inverters andtypicallyincludescircuitbreakers,isolators, andotherprotectiondevices.Itorganizesandcontrolsthe flow of electrical power in the system. The ACDB consolidates the AC output from the solar inverters and distributesittovariouspartsoftheelectricalsystem,suchas thelocalloads(e.g.,lighting,appliances,HVACsystems,etc.) within the building or facility. If the system is gridconnected, the ACDB also facilitates the export of excess energy to the grid via the incomer. In a 400kW rooftop solar photovoltaic (PV) system, the Incomer typically refers to the point where the generated AC power either
2023-2024solarpowergenerationinunitsfromJanuaryto April data. Using the total energy consumption and generationdatathegraphofsolargenerationv/smonths, total energy consumption in college v/s Months and generationandconsumption.Theefficiencyofinverterand overallefficiencyoftheplantiscalculated.
connects to the low-voltage (LT) side of a three-phase transformer or interfaces with the grid or a load system. The HT (High Tension) side of the three-phase transformer isresponsibleformanagingthevoltagelevels oftheelectricalpowergeneratedbythesystem,specifically when the system is grid-connected The HT side of the transformerisdesignedtohandle higher voltage levels and istypicallyconnectedtotheutilitygrid.Thetransformeris used to either step up the voltage generated by the solar system(fromthelow-voltageside,whichistheoutputofthe solar inverters) to a level suitable for the grid, or in some systems, it could also be part of the reverse process (if steppingdownforalocalizedneed).
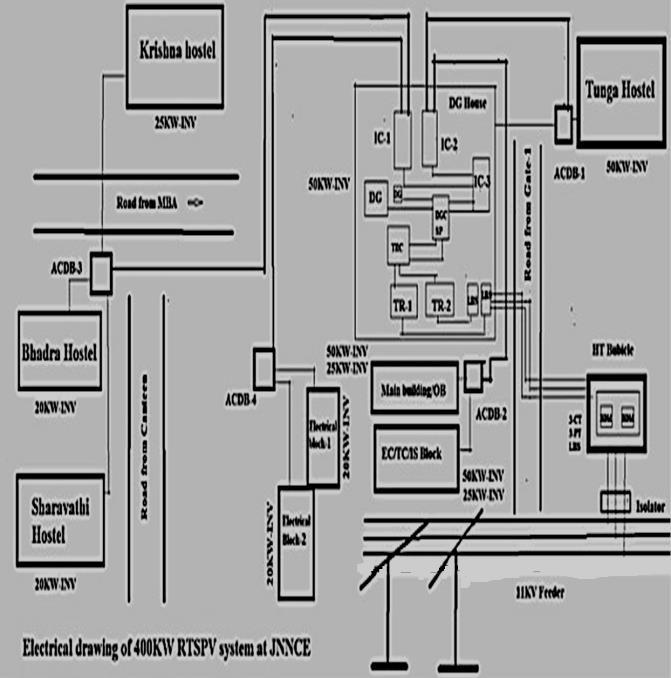
Single line diagram of 400kW RTSPV system installed at JNNCE,

Volume: 12 Issue: 01 | Jan 2025 www.irjet.net
Shimoga:

Figure 2 displays the single-line diagram of the 400kW RTSPV system consisting of 11 inverters of capacity 20/25/50kW,1230solarpanelsofcapacity325Wp,4unitsof ACDB to combine AC power produced at different buildings,9numbersofinverterterminationboard(ITB)and 3number
of incomers installed at JNNCE, Shimoga. 400kW of solar powerplantterminatedasinglepointatincomer3.Single line diagram shows the components installed to produce electrical energy from solar plant. 90% of the Electrical energy required by JNNCE is met by the 400kW RTSPV system installed at JNNCE, excess or shortage of power is exportedorimportedbytheelectricalpowergrid.Duringa
Performance analysis:
gridfailure,thesolarpower plantwill gooff mode.Diesel powerplantswillgenerateenergy.Twonumberof3phase transformers of 250KVA are installed in the campus to handle475KVAcapacityofJNNCEconnectedload.Thesolar power plant is connected to the LT side of a 250KVA, 50hz,11/0.432KV3phasetransformer,MESCOMsupplyis connected to the HT side of the transformer. The diesel power plant is also connected to the LT side of the transformer.Solarpowergenerationisdirectlysuppliedto theloadthroughtheLTsideofthetransformer.Atotal of 400kWofRTSPVsystemisconnectedintheJNNCECampus produces5,20,000unitsofenergyperannum,generatinga revenueof50,0000
Table 1: PerformanceanalysisofsolarPVsysteminstalledatEEblockJNNCE,Shimoga(BeforecleaningthepanelDate: 9/11/2024):

International Research Journal of Engineering and Technology (IRJET) e-ISSN: 2395-0056
Volume: 12 Issue: 01 | Jan 2025 www.irjet.net p-ISSN: 2395-0072
Usingsolaripowermeter,theamountofsolarradiationthat reachesasurfaceismeasuredwithrespectinw/m2v/stime inhours.Radiationismaximumduring8AMTO2PM.Table1 shows inverter power in watts at EE-1 v/s Time in hrs.
enthoughtheradiationismaximumbetween9amto2pm, inverterpowerreadingisreducedduring1pmto2pmdueto grid failure, hence conversion efficiency alsogets reduced during 1pm to 2pm due to grid failure. Once the grid fails RTSPVgoestooffmode.
Table 2: PerformanceanalysisofsolarPVsysteminstalledatEE-1blockJNNCE,Shimoga(AftercleaningthepanelDate: 27/11/2024):
Conversionefficiencyismaximumduring10amto12am,but due to grid failure the conversion efficiency is reduced in somehourseventhoughtheradiationismaximum.Herethe table2isplottedbetweenEnergyinkWhv/sTimeinhrs.
Thisgraphshowsthatthegenerationisincreasingforeach hourfrom6amto6pmByconsideringConversionefficiency ofsolarpanel beforeandaftercleaning,aftercleaning the solarpanelconversionefficiencyismaximumcomparedto before cleaning the panel. This tells that accumulation of dust on the panel reduces the conversion efficiency.

International Research Journal of Engineering and Technology (IRJET) e-ISSN: 2395-0056
Volume: 12 Issue: 01 | Jan 2025 www.irjet.net p-ISSN: 2395-0072
4.2. Economic analysis:
Table 4: GenerationandConsumptionofelectricalenergyatJNNCE:
4.14 Solar generation v/s months
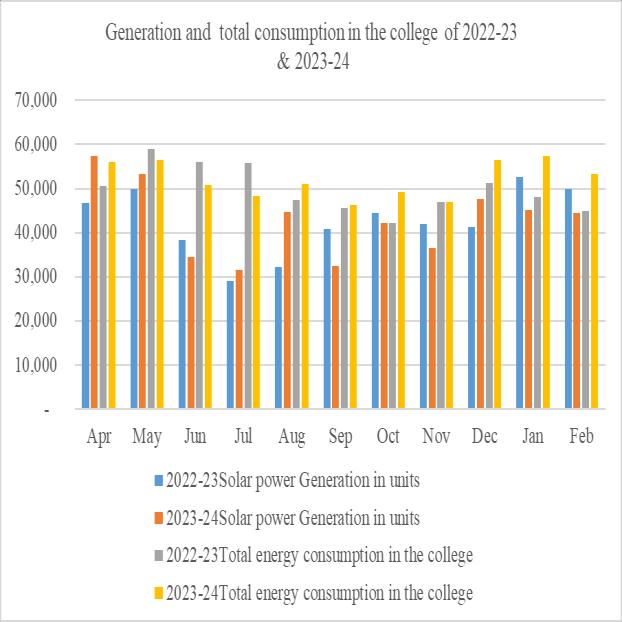
Herethechart1isplottedbetween2022-23&2023-24solar generationv/smonthsthisshowsthecomparisonofsolar generation in each month of different year. Total energy consumptionincollegev/smonthsVariationinconsumption ofenergyincollegeforeachmonthdetailscanbeobtained fromtheabovegraph

Chart 1: solargenerationandconsumptionofenergyin collegeforeachmonthof2022-23&2023-24.
Chart 1 shows the comparison of solar generation and consumptionofenergyincollegeforeachmonthof2022-23 &2023-24
Economic analysis:
To calculate the energy shortage in the plant: Energy shortage=Energyconsumed-Energygenerated
=5,59,795kWh-4,68,370kWh
=91,425unitsperannum
So,theshortageofenergyintheplantis91,425kWh perannum.
Tomeet100%oftheenergyrequirement(i.e.,to generatethesameamountofenergyasis consumed)
EnergyshortageatJNNCEcampusperannumis 91,425units
Permonth=91,425/12=7618.75units/monthPer day=7618.75/30=253.95units/day
Therefore,1kW=4units
For253.95units/day=253.95/4=63.48kW
Thus,theplantwouldneedan additional63.48 kW capacityto meet100% of itsenergy consumption.
Costof1kW=50,000Rs

International Research Journal of Engineering and Technology (IRJET) e-ISSN: 2395-0056
Volume: 12 Issue: 01 | Jan 2025 www.irjet.net p-ISSN: 2395-0072
HenceInvestmentfor63.48kWwillbe
63.48*50,000=Rs31,74,000
Additional plant produces 91,425 units per year producesarevenueof 91,425*8.5=Rs7,77,112per year.
Hencepaybackperiod=Investment/Savings =31,74,000/7,77,112 =4.1Years
Thesavingsforcollegefromtheinstallationof64 kWsolarPVinone-yearamounttoRs7,77,112. Thelifetimesavingsbytheinstallationofadditional solarPVsystematJNNCEcampusforremaining21 years’is=7,77,112Rs*21Years =1,63,19,325Rs
From additional plant institution reduces its Co2 emissionby2750tons/annum.
Results and discussion:
Beforecleaningthepanel,theconversionefficiencyis30%. Aftercleaningthepanels,assuminganincreaseingeneration due to improved panel performance, the efficiency will improvethatis30.37%.Hencethereisdifferenceof0.37%
Conclusion:
Performance analysis was conducted by taking solar radiation readingswitha solarimeter and inverterfor the EE-1buildingbeforeandaftercleaningthesolarpanel.Postcleaning,energygenerationincreasedduetotheremovalof dust, which had previously reduced efficiency. Economic analysis considered the college's energy generation and consumptiondatafromthepasttwoyears.Acomparisonof electricity billsrevealed thatthe costs were higher before theinstallationoftheRTPSV(RooftopsolarPV)systemand decreasedafterinstallation.Thestudyyieldstheresultthat theinstallationofa400kWRTSPVsystemproduces4,68,370 units of electrical energy per annum. JNNCE consumed 5,59,795unitsperannum.Thesolarpowerplantproduces 83.66% of the electrical energy required by JNNCE. The installationcostwasreceivedwithin4.6years.TheRTPSV system has reduced power consumption from the grid, lowered coal usage and CO2 emissions, decreased power losses,andimprovedairquality,makingitaneco-friendly option. In order to meet 100% power from solar plant additional64kWcapacityofRTSPVsystemistobeadded. Paybackperiodfortheadditionalplantis4.1year.Generates asavingsofRs1,63,19,325initslifetime.
Performanceanalysisisdoneforonlyonebuildingoutof11 buildings in the college the work can be extended by consideringperformanceofallthebuildingsinthecampus. Only accumulation of dust is considered for performance
analysisotherparameterssuchasshadow,declinationangle and facing of solar panel are also to be considered for performanceanalysis.
Reference:
[1] Solarenergytechnologyanditsrolesinsustainable development,Clean Energy,Volume6,Issue3,June 2022,Pages476-483
[2] Smith, J. (2020). Solar Power for Schools: Benefits, Challenges,andImplementation.Journalofenewable EnergyEducation,15(2),73-88
[3] Assouline et al., 2017 D. Assouline, N. Mohajeri, J.L. cartezzini Quantifying rooftop photovoltaic solar energy potential: a machine learning approach Sol. Energy,141(2017),pp.278-296.
[4] Abdul-Azeez and Ho, 2015 I.A. Abdul-Azeez, C.S. HoRealising low carbon emission in the university campustowardsenergysustainabilityOpenJ.Energy Effic.,04(2015),pp.15-27
[5] S.S. Abd Wahid, Z. Nawawi, M.I. Jambak, Y.Z. Arief, M.A.B. Sidik, M.W. Mustafa, Z.Adzis Evaluation of residential grid- Connected photovoltaic system as thepotentialenergysourceinMalaysiaTelkomnika (Telecommunication Computing Electronics and Control),14(2016),pp.1235-1241.
[6] Alfaraidy and Sulieman, 2019 F.A. Alfaraidy, H.A. Sulieman. The Economics of Using Solar Energy: SchoolBuildingsinSaudiArabiaasaCaseStudyThe ScientificJournalofKoyaUniversity,7(2019),pp6.
[7] AjithgopiandWaiKeng,2021Ajithgopi,K.Sudhakar, N.WaiKengDesignandsimulationofsolarrooftop projectsforanenergyself-reliantuniversitycampus IOP Conference Series: Materials Science and Engineering,1078(2021),Article012013.
[8] Anang et al., 2021 N. Anang, S.N.A. Syd Nur Azman, W.M.W.Muda,A.N.Dagang,M.Z.DaudPerformance analysisofagrid-connectedrooftopsolar PVsystem in Kuala Terengganu Malaysia. Energy Build, 248 (2021),Article111182.
[9] Bilir and Yildirim, 2017 L.Bilir, N.Yildirim Photovoltaicsystemassessmentforaschoolbuilding.
[10] Hanus et al., 2019 N.L. Hanus, G. Wong-Parodi, P.T. Vaishnav,N.R.Darghouth,I.L.AzevedoSolarPVasa mitigation strategy for the US education sector EnvironmentalResearchLetters,14(2019).

International Research Journal of Engineering and Technology (IRJET) e-ISSN: 2395-0056
Volume: 12 Issue: 01 | Jan 2025 www.irjet.net p-ISSN: 2395-0072
[11] Ajjanna, N. G., Suresh, H. B., Sreepathi, L. K. (2025). 'Analysis of Solar PV System and Solar Thermal EnergytoMeetaDairyIndustryEnergyNeeds:ACase Study', Iranica Journal of Energy & Environment, 16(1),pp.37-46.doi:10.5829/ijee.2025.16.01.05.
BIOGRAPHIES:

N G Ajjanna Received a bachelor's degree in Electrical and Electronics Engineering from Kuvepu University in 1995, and a master's degree in Energy System engineering from VisvesvarayaTechnologicalUniversityin2001. HeiscurrentlydoingResearchworkinthefield of Energy Management. Working as an Assistant Professor at the Department of Electrical and Electronics Engineering and coordinatorof400KWRTSPVsysteminstalled at JNNCE, Shimoga. His interesting areas includeEnergyAuditing,Energyconservation, DSM Techniques, and Renewable Energy Technologies.Hehasauthoredandpublisheda TextbookonEnergyAuditingandDemandSide Management.