STATE OF THE NORTH 2024
CHARTING THE COURSE FOR A DECADE OF RENEWAL
Marcus Johns, Jacob Marshall, Luke Myer, Paul Hebden, Ryan Swift, and Zoë Billingham
March 2024
ABOUT IPPR NORTH
IPPR North is the leading think tank based in the north of England.
We develop bold, progressive ideas to empower England’s regions so that everyone has the opportunity to live a good life and to thrive. We are deeply connected to the issues our communities face.
IPPR, the Institute for Public Policy Research, is an independent charity working towards a fairer, greener, and more prosperous society. We are researchers, communicators, and policy experts creating tangible progressive change, and turning bold ideas into common sense realities. Working across the UK, IPPR, IPPR North, and IPPR Scotland are deeply connected to the people of our nations and regions, and the issues our communities face.
We have helped shape national conversations and progressive policy change for more than 30 years. From making the early case for the minimum wage and tackling regional inequality, to proposing a windfall tax on energy companies, IPPR’s research and policy work has put forward practical solutions for the crises facing society.
IPPR North
Suite 4.07
Blackfriars House
Parsonage
Manchester
M3 2JA
E: north@ippr.org
www.ippr.org/north
Registered charity no: 800065 (England and Wales), SC046557 (Scotland)
This paper was first published in March 2024. © IPPR 2024
The contents and opinions expressed in this paper are those of the authors only.
IPPR North | State of the North 2024 Charting the course for a decade of renewal 3 CONTENTS 1. Introduction ................................................................................................................ 7 2. Restore voters’ trust by empowering and rebalancing England’s regions .... 9 3. Rebalance wealth across England....................................................................... 13 4. Empower local government through fair and sustainable financing......... 18 5. Drive opportunity across England ...................................................................... 23 6. Rebuild healthier places ....................................................................................... 27 7. Conclusion ................................................................................................................. 32 References..................................................................................................................... 33 Annex 1: Methodology ................................................................................................ 37 Annex 2: Trend summaries ....................................................................................... 40
ABOUT THE AUTHORS
Marcus Johns is a senior research fellow at IPPR North.
Jacob Marshall was a Q-Step intern at IPPR North, from the University of Manchester.
Luke Myer is a research fellow at IPPR North.
Paul Hebden is a strategic communications adviser to IPPR North.
Dr Ryan Swift is a research fellow at IPPR North.
Zoë Billingham is the director of IPPR North.
ACKNOWLEDGEMENTS
The lead author would like to thank all the authors, and everyone else who has contributed to this report throughout its life whether providing ideas and inspiration or challenging critique. The authors are particularly grateful for the support of IPPR colleagues: Rosie Lockwood, Henry Parkes, Dave Hawkey, Jamie O’Halloran, Chris Thomas, George Dibb, Carys Roberts, Ellie Kearns, Efua PokuAmanfo, and Harry Quilter-Pinner. For bringing our ideas to life in on the page, we thank Abi Hynes and Richard Maclean.
Each year, IPPR North hosts a Q-Step placement as part of a programme that helps undergraduate students develop data skills while paying them a living wage for their time. Our interns are always an inspiration to us, and we are grateful to the University of Manchester for funding their placement, enabling this research.
Download
This document is available to download as a free PDF and in other formats at: http://www.ippr.org/articles/state-of-the-north-2024
Citation If you are using this document in your own writing, our preferred citation is: Johns M, Marshall J, Myer L, Hebden P, Swift R and Billingham Z (2024) State of the North 2024: Charting the course for a decade of renewal, IPPR North. http://www.ippr.org/articles/state-of-the-north-2024
Permission to share
This document is published under a creative commons licence: Attribution-NonCommercial-NoDerivs 2.0 UK http://creativecommons.org/licenses/by-nc-nd/2.0/uk/ For commercial use, please contact info@ippr.org
4 IPPR North | State of the North 2024 Charting the course for a decade of renewal
SUMMARY
The North’s communities are ambitious for a better future, but face systemic and pronounced inequalities. Gaps in power, wealth, opportunity, and health result in shorter, sicker, less fulfilling lives.
Regional inequality is a major concern for the public, and looming elections present an opportunity for course correction in the next parliament and the decade to come.
This State of the North report assesses our current course and proposes five priority areas for a decade of renewal. We envision a future where the North’s regions stand equally among others offering opportunities for all to thrive within a healthy, prosperous, and equal country. We call for transformative action, to look forward, and realise the full potential of our regions.
RECOMMENDATION 1 RESTORE VOTERS' TRUST
To restore voters’ trust, we recommend regions are empowered further and that regional rebalancing is prioritised in all areas of national policy. Clear promises and tangible change for people’s communities would reap political reward. Those seeking to form the next government should note the increasing regional political volatility and discontent with regional inequality, especially in the North. Responding to this, local and regional leadership should be strengthened through broader and deeper devolution to improve outcomes, and rebuild trust.
RECOMMENDATION 2
REBALANCE WEALTH IN ENGLAND
To regionally rebalance wealth, we recommend equalising tax on incomes from wealth with tax on working people’s incomes. Unequal wealth undermines social mobility and holds back better living standards across England. Fairer tax would be redistributive given severe inequalities in wealth and should be used to fund regional economic development and stabilise local government finances. Rebalancing and rebuilding wealth would help rebalance regions and support widespread power, wealth, opportunity, and health.
IPPR North | State of the North 2024 Charting the course for a decade of renewal 5
RECOMMENDATION
3
EMPOWER PLACES
To spread power and prosperity, we recommend fixing local authority funding with a fair, needs-based, whole-place model to enhance broader, deeper devolution. Empowering communities means providing both the power and the means to support places. Cuts to local authority budgets will continue to deeply undermine advancements in devolution to the regional, or mayoral combined authority, tier of government. Fairer, multi-year settlements would begin to reverse austerity’s damage and be the first step on the road to stronger local financial powers.
RECOMMENDATION
4
CREATE OPPORTUNITY ACROSS ENGLAND
To create opportunity across England, we recommend a strategic, long-term green industrial strategy that emphasises the importance of places and is rooted in local delivery. Rebalancing economic opportunity means creating not only jobs, but good quality, fulfilling jobs across the country. Action at all levels, learning from best practice at home and abroad, would unlock places’ potential. Investment would be funded by joining up climate investment plans and economic development funding within this overarching green growth strategy, alongside crowding-in private investment with long-term and stable regional commitments.
RECOMMENDATION 5
REBUILD HEALTHY PLACES
To rebuild healthy places, we recommend Health and Prosperity Improvement (HAPI) zones. Closing regional divides means improving outcomes in the places where healthy life expectancy is lowest. Responding to the double injustice of poor health and poor economic outcomes clustering together, we need action across the foundations of good health. Local levers and new investment reflecting local level plans, all within a national mission to improve health, would target better outcomes for: safer homes, healthier minds and bodies, cleaner air, better jobs, stronger community relationships, reduced addiction, and better starts to life. These would be paid for with national and optional local levies on health-harming activity.
6 IPPR North | State of the North 2024 Charting the course for a decade of renewal
1. INTRODUCTION
1.1. THE PAST DECADE HIGHLIGHTS THE PROFOUND CHALLENGE AND CONSEQUENCE OF REGIONAL INEQUALITY
Ten years on from our first State of the North report, this edition looks ahead to the next 10 years of regional inequality. We compare what will happen if we continue on the current trajectory with what could be done to alter course and drive a decade of regional renewal.
Looking back, notable changes in the past decade on the regional agenda include:
• widespread acknowledgement of regional inequality in the political mainstream and sustained interest in what regional policy could do to correct course
• devolution increasingly accepted as the new normal, with an ongoing process enhancing regional control. This is marked by the growing influence of metro mayors and with new devolution models emerging
• Metro mayors and new institutions, including the Convention of the North, have matured, further entrenching regional power across the North and beyond
• the North emerging as a net zero powerhouse, an opportunity yet to be fully embraced
• the Brexit referendum which underlined the extent of dissatisfaction with the UK’s centralised government and extent of our place-base inequality.
The past 10 years of State of the North have shaped the regional agenda. Since our first year, we have:
• created an evidence baseline for further devolution to the North (Cox and Raikes 2014)
• defined success criteria of the Northern Powerhouse (Cox and Raikes 2015)
• assessed northern resilience, facing uncertainty post-Brexit (Cox, Raikes and Carella 2016)
• highlighted the growing political and economic power of millennials and Generation Z (Raikes 2017)
• advocated for the prioritisation of economic justice and social infrastructure investment as part of the Northern Powerhouse (Raikes, Millward and Longlands 2018)
• revealed the deep link between centralised governance and the UK’s regional divides (Raikes, Giovannini and Getzel 2019)
• explored inequalities in the context of Covid-19 and proposed a framework for levelling up to build good lives for all in the North and across England’s regions (Johns et al 2020)
• outlined missions for a prosperous North, demonstrating the gap between Westminster’s levelling up rhetoric and levelling up reality (Webb et al 2022)
• compared the UK internationally, demonstrating that the UK is the most regionally unbalanced large, advanced economy across social, economic, and environmental outcomes and learning how investment and empowering places drives regional rebalancing elsewhere (Johns and Hutt 2023).
IPPR North | State of the North 2024 Charting the course for a decade of renewal 7
A decade of State of the North tells a story: the North’s ambition has rightly risen. Despite this, obstacles remain. Decentralisation is a work in progress, levelling up has so far failed to systematically improve regional inequality, and state investment remains insufficient and regionally unfair.
Inequalities between our regions are not inevitable. They are a product of policy choices in the design of our economy and democracy, and so we are unapologetically ambitious in policy for a better future.
Our annual analysis consistently identifies regional inequality as a consequence of our centralised political and economic model. Imbalances hold all regions back whether driving poverty in the capital by driving up housing costs (Raikes, Giovannini and Getzel 2019) or fuelling poverty in the North East with constrained opportunity, low wages, and underinvestment (Myer and Bailey 2023).
Our findings reveal interrelated problems stemming from regional and place-based inequalities.
• Fairness – where you live dictates what opportunities are open to you, the quality of your life and even how long you might live.
• Prosperity – inequality hampers economic growth, resulting in a smaller and less productive UK economy. Unequal economies overlook contributions from many places while placing pressure on living costs, especially housing, in the few growing places.
• Resilience – unequal economies are less resilient to shocks, taking longer to recover.
• Place-based interdependency – the economic success of each place is reinforced by its region’s economy and vice versa, clustering underperforming economies.
• Political discontent – recent political events, including the 2016 Brexit referendum’s atmosphere show how inequalities drive political discontent, threaten social cohesion, and can destabilise our democratic foundations –driving support for extreme, divisive politics.
1.2. THE UNSUSTAINABLE STATUS QUO DEMANDS CHANGING COURSE ON PLACE-BASED INEQUALITY FOR A DECADE OF RENEWAL FOR THE NORTH AND ALL ENGLAND’S REGIONS
This year’s State of the North looks forward at the decade ahead. Under the status quo, our regional divides against key measures of success – power, wealth, opportunity, and health – will grow. Only bold and concerted action will change the course of England’s regional divides.
With local and mayoral elections, and a general election, this year the public holds significant sway over the decade to come. Our new analysis sets out key trends based on the current course and there is no doubt it is time to course correct. It matters to the public too, who continue to prioritise regional inequalities, though their confidence in change is low (Billingham et al 2023). Support for democratic change is strongest in former industrial heartlands, including much of the North (Patel et al 2023) and around three in five people in England think regional inequality hurts the UK economy (CPRI 2023).
This year’s State of the North focusses on the outcomes of successful regional rebalancing: closing the regional divides in wealth, opportunity, health and power. Across these themes, we select key indicators of progress. We analyse the trajectory in the key indicators over the last decade and project them forward to the end of this decade, to assess what could happen under the status quo. We then set out the core recommendations that will help us correct course.
It’s time to shift from rhetoric to change.
8 IPPR North | State of the North 2024 Charting the course for a decade of renewal
2. RESTORE VOTERS’ TRUST BY EMPOWERING AND REBALANCING ENGLAND’S REGIONS
2.1. THE NORTH’S VOTES CANNOT BE TAKEN FOR GRANTED
The North is becoming more politically volatile. It has become increasingly electorally marginal. The proportion of seats that are marginal in the North has been increasing since 1997, bar the 2017 election.1 In this current year – with local, mayoral and general elections – voters in the North cannot be taken for granted.
At the next general election, the North will elect 154 members of parliament, shy of a quarter of seats in the House of Commons. At the upcoming May elections, seven of the 10 mayoral elections2 taking place will be in the North, including new positions for the North East and York and North Yorkshire, alongside local councillors. The local elections will determine who governs local councils and England’s maturing devolved institutions, shaping local places’ futures and inevitably shaping the tone of political debate during this general election year.
The North is home to the three most marginal English regions by average majority: at the 2019 general election, the average majority in the North stood at 21 per cent, comprising the North East (14 per cent average), Yorkshire and the Humber (20 per cent), and the North West (24 per cent). Accounting for boundary changes (Rallings, Thrasher and Denver 2024), the three northern regions remain most marginal by this measure – even though the average northern majority rises slightly to 21 per cent compared to 28 per cent in England overall and 25 per cent across Great Britain overall.
1
2 Combined authority mayors and the mayor of London, not including local authority mayors.
IPPR North | State of the North 2024 Charting the course for a decade of renewal 9
Here and throughout, we define marginality as seats with majorities below 10 per cent. See annex 1 for more detail on how we define and calculate this, and our methodology.
Each region’s share of the total number of marginal seats in Great Britain 1918-2019, including 2019’s notional result using 2024 boundaries
Note: *Notional 2019 result using 2024 boundaries. See annex 1 for methodology and definitions.
Source: House of Commons Library 2020; Rallings, Thrasher and Denver 2024
The North had the most marginal seats after the 2019 general election, and several clusters with smaller majorities than average.
The long-term trend shows the North overtaking all other English regions to become the most marginal. It is worth noting that the 2017 election slightly bucks this trend; there are several factors behind this, particularly the increased vote share for the two main UK parties squeezing smaller parties – including the SNP in Scotland. Nevertheless, Labour’s increases were predominantly in university towns and cities, where they held strong majorities already, and the Conservatives increased their share of working-class voters (Holder, Barr, and Kommenda 2017).
North East
North West
Yorkshire and the Humber
East Midlands
West Midlands
East
South East
South West
London
Scotland
Wales
10 IPPR North | State of the North 2024 Charting the course for a decade of renewal
FIGURE 2.1: THE NORTH HAD THE HIGHEST NUMBER OF MARGINAL SEATS AT THE 2019 GENERAL ELECTION, ACCOUNTING FOR BOUNDARY CHANGES
0% 10% 20% 30% 40% 50% 60% 70% 80% 90% 100% 1 9 1 8 1 9 2 2 1 9 2 3 1 9 2 4 1 9 2 9 1 9 3 1 1 9 3 5 1 9 4 5 1 9 5 0 1 9 5 1 1 9 5 5 1 9 5 9 1 9 6 4 1 9 6 6 1 9 7 0 1 9 7 4 F 1 9 7 4 O 1 9 7 9 1 9 8 3 1 9 8 7 1 9 9 2 1 9 9 7 2 0 0 1 2 0 0 5 2 0 1 0 2 0 1 5 2 0 1 7 2 0 1 9 2 0 1 9*
Average majority as percentage of total votes 2010-2019 in Great Britain and seats that have changed party control 2015-2024 (including by-elections)
Largest majority
Scotland
Smallest majority
Seat changed party control 2015–2024, including by-elections
North Midlands
South
Wales
London
Note: See annex 1 for methodology.
Source: House of Commons Library 2020, Flanagan 2016
Recent polling indicates that up to one third of the North’s constituencies could change hands at the coming general election (YouGov 2024). Anticipating a substantial electoral shift at the next election holds merit, but across incumbent and aspiring representatives, escalating volatility of the electorate should be heeded. While focus undoubtedly lies on securing support in this year’s election
IPPR North | State of the North 2024 Charting the course for a decade of renewal 11
FIGURE 2.2: SEATS WITH SMALLER MAJORITIES CLUSTER IN THE NORTH, AND A SIGNIFICANT NUMBER HAVE CHANGED CONTROL SINCE 2010
for political actors, maintaining such trust into the decade ahead is a harder task, hinging upon visible action and palpable outcomes for the North and England’s regions.
2.2. CREDIBLE LONG-TERM POLICIES ON REGIONAL REBALANCING COULD REAP POLITICAL REWARD
Trust in MPs diminishes the further one travels from Westminster in England (Quilter-Pinner et al 2021). The British electorate is increasingly more volatile with weakening partisan attachments (Fieldhouse et al 2020) and falling trust in central government (Uberoi and Johnston 2022).
Political dissatisfaction outside London and the South is accompanied by broad desire to level up England’s regions (More in Common 2023). Despite frustration and scepticism over pace, there continues to be potential electoral reward for those successfully delivering a levelling up agenda that ensures communities feel their areas are no longer neglected (Billingham et al 2023, More in Common 2023).
Empowering places to act locally commands public support: most people in the North believe more decisions should be made locally (Patel and Quilter-Pinner 2022), while local political institutions and politicians are more trusted by citizens (Travers 2023). Decisions made locally tend to result in fairer investment, more equal life outcomes, and stronger trust (Stansbury et al 2023, Raikes 2020). Such empowerment could unlock social and economic potential across the country to better contribute to national success (Johns et al 2023) alongside political reward.
RECOMMENDATION
RESTORE VOTERS’ TRUST THROUGH EMPOWERED LOCAL AND REGIONAL GOVERNMENT AND COMMITMENT TO CREDIBLE, LONG-TERM REGIONAL REBALANCING
Renewed focus on regional rebalancing must be a priority of the next government. As the rest of this report sets out, focusing on wealth, opportunity, health, and the power held by communities is key to better outcomes and rebuilding trust.
To help commit future governments to regional rebalancing and rebuilding trust, we recommend:
• place is considered in all matters of national policy
• long-term commitments to rebalancing are reaffirmed or strengthened
• an irreversible strengthening of local government to empower communities and improve local services (see Billingham et al 2023) with fair and sustainable local funding and continued broader, deeper devolution of powers.
To enable this, the next government should commit to the principle of subsidiarity. This means decisions sit closest to the people affected and at the level where impact on outcomes can be best secured, with only those decisions which either cannot be taken locally or more effectively secure impact at higher levels remaining at the centre (Giovannini and Johns 2021). To do so, they should strengthen local leadership through new primary legislation such as a new local government act or similar (Johns and Hutt 2023). Decisions by central government should always consider regional inequalities.
12 IPPR North | State of the North 2024 Charting the course for a decade of renewal
3. REBALANCE WEALTH ACROSS ENGLAND
3.1. MANY PEOPLE AND COMMUNITIES ARE EXCLUDED FROM WEALTH AS WEALTH INEQUALITY RISES
Wealth inequalities are growing rapidly across England. Wealth encompasses property, financial, material, and pension assets. It is a crucial metric of communities’ and peoples’ economic standing. In England, regional divisions in wealth are profound and growing.
While England’s average wealth per person grew from around £226,300 in 2010 to £290,800 by 2020, regional inequalities in wealth have widened. For instance, the gap per head between the average wealth per person in England overall and the North stood at £71,000 in 2020, almost double the gap in 2010, at around £37,300 (ONS 2022a in 2023 prices).
The gap between levels of wealth in the North and Midlands, and the rest of England is growing. The North East is the region with the lowest overall and average wealth levels, and median wealth remains lower there now than in 2006 in real terms (ibid).
The highest wealth per person is found in the South East, where wealth per head is £415,200, approximately £195,400 higher than the North’s £219,750. Our analysis below finds that this difference between the South East and the North could reach around £228,800 by the end of the decade, as the increasing inequality observed since 2010 continues to concentrate wealth in one corner of the country.
Overall in England, the wealthiest 10 per cent hold almost half of all wealth. Nearly half of wealth is found in the South where 40 per cent of the population reside against a fifth of wealth being found in the North where around 30 per cent of the population live, with the remainder in London and the Midlands.
IPPR North | State of the North 2024 Charting the course for a decade of renewal 13
3.1:
CONTINUE
Wealth per head (£, 2023 prices), two-year periods ending 2010–2030
Note: IPPR North projected trends identified with dotted lines. A methodological change to the underlying data is marked in 2016. See annex 1 for methodology.
Source: ONS 2022a, 2023a, 2023b, 2023c, OBR 2023
Looking at the trajectory of total wealth per head, Figure 3.1, regional inequality grows. In 2010, total wealth per head in the North stood at 84 per cent the level of England, and 64 per cent of the South East – the wealthiest region. While the total wealth per head in the least wealthy region, the North East, stood at 60 per cent the level of the South East. By the end of the period, in 2030, wealth per head in the North could stand at 79 per cent the level of England, and just 55 per cent the level of the South East. Meanwhile, the North East’s level could fall to 54 per cent of the South East’s, meaning around half the level of wealth per head.. Wealth is unequal within regions too. Notably wealth inequality is lower in wealthier regions like the South East and higher in poorer regions like the North East. London is an exception and is particularly unequal with extremely high wealth accompanying high poverty and higher barriers of entry to the housing market (ONS 2022a, Raikes 2020).
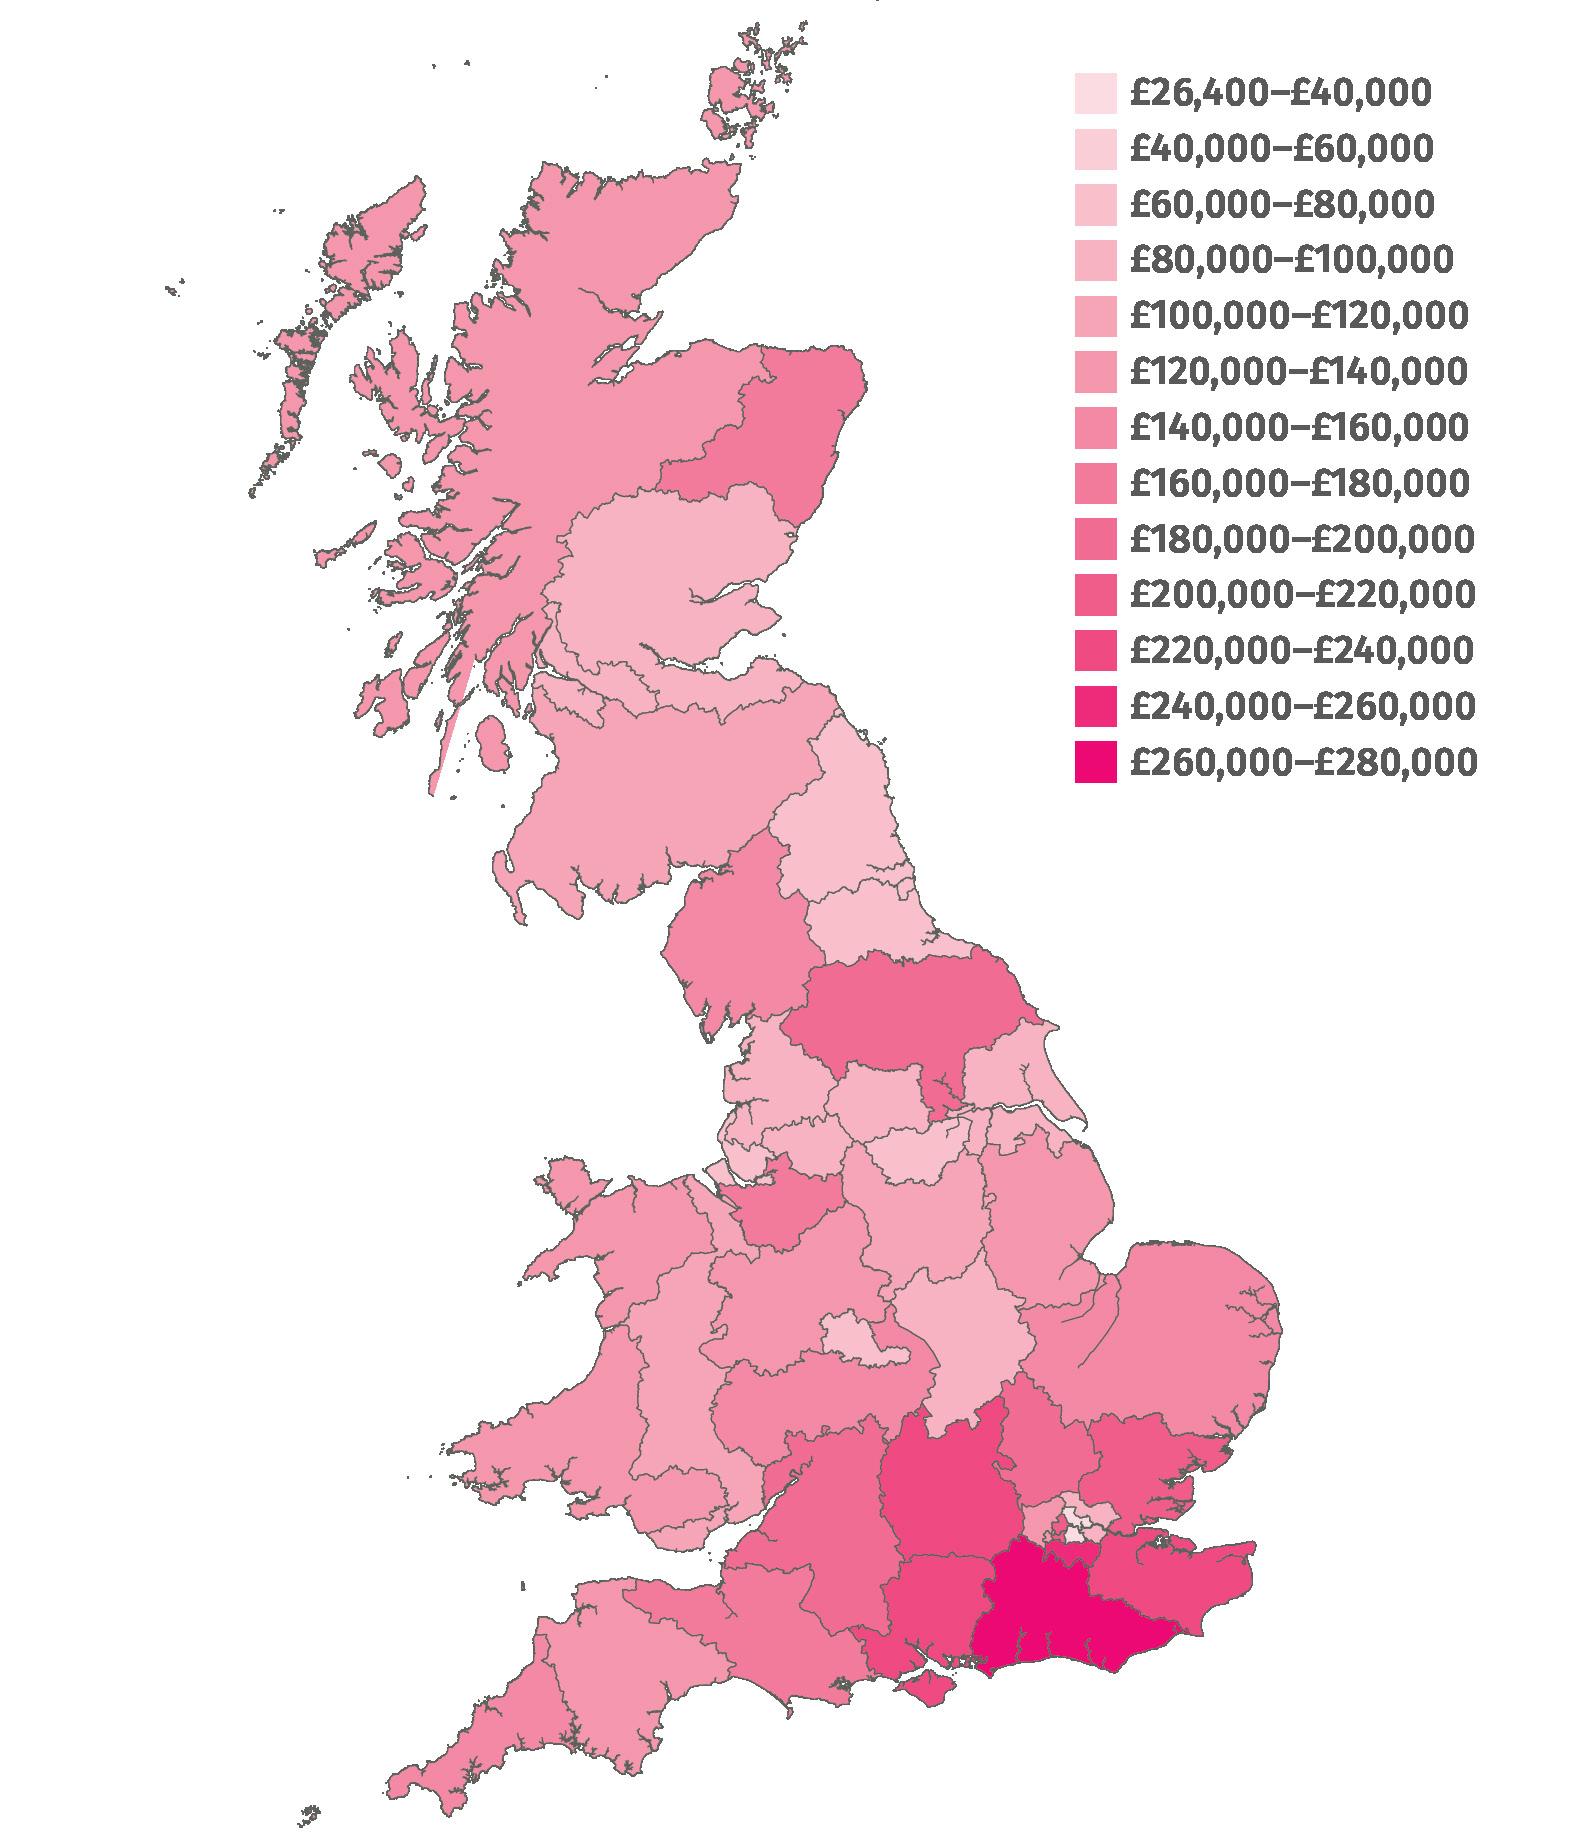
Median wealth in inner London, across the urban North and the West Midlands is significantly lower than the high levels found in the Home Counties, particularly in Surrey, East and West Sussex, South Outer London, Hampshire and the Isle of Wight. Median wealth is almost 10 times higher comparing the wealthiest and poorest areas mapped below, respectively Surrey, East and West Sussex (£263,200) and East Inner London (£26,400).
South East
East
South West
England
London
Yorkshire and the Humber
North West
West Midlands
East Midlands
North (all)
North East
14 IPPR North | State of the North 2024 Charting the course for a decade of renewal
FIGURE
WEALTH HAS BEEN CONCENTRATING IN LONDON AND THE SOUTH EAST AND THIS IS PROJECTED TO
0 100 200 300
2010 2012 2014 2016 2018 2020 2022 2024 2026 2028 2030 T h o u s a n d s
400 500
AND
IN LONDON
Median total individual wealth by ITL2 region (£) in Great Britain
Note: See annex 1 for methodology.
Source: ONS 2023a
3.2. THE GROWING GAP IN THE REGIONAL DISTRIBUTION OF WEALTH IMPACTS SOCIAL MOBILITY AND LIVING STANDARDS
Wealth inequality, particularly its spatial concentrations, is unjust. Wealth confers wellbeing, opportunity, and quality of life, with major implications for social mobility. In recent decades, the pathway for families without wealth to work to secure comfortable average living standards has collapsed. Work has faltered as a route out of poverty (Johns 2020) and social mobility has collapsed to its lowest level in 50 years – driven by the uneven nature of wealth inheritance (van der Erve et al 2023). This deceleration is notably concentrated in the North and Midlands (ibid).
IPPR North | State of the North 2024 Charting the course for a decade of renewal 15
FIGURE 3.2 MEDIAN WEALTH IS MUCH HIGHER IN THE SOUTH EAST THAN THE NORTH
MIDLANDS, BUT WITH WEALTH COLDSPOTS
Our economic, political (Billingham et al 2023, Raikes 2020), and taxation systems perpetuate these inequalities, failing to address inequalities in wealth or income from wealth. This is evident across the taxation system, including for instance inheritance tax where the current system greatly benefits London and the South and the wealthiest disproportionately (Advani and Sturrock 2023). For example, capital gains tax (a tax on profit applied to asset sales including stocks and property, but excluding primary homes) illustrates this: the top 3 per cent of beneficiaries from capital gains in London take home £9 billion annually, exceeding the combined total for everyone in the North at £8 billion (IPPR analysis of Tax Justice 2021). Capital gains tax is undertaxed relative to taxes paid by working people on their income from work (Nanda and Parkes 2019).
Recent research has highlighted how capital gains are disproportionately concentrated among the richest, in the richest neighbourhoods in the richest regions: One neighbourhood of 6,400 people in Kensington had as much in capital gains as Liverpool, Manchester, and Newcastle combined while Kensington's overall share of UK capital gains was greater than all of Wales. Capital gains per head are four times higher in London than less prosperous parts of the UK, with a stark divide between the South and the rest of the country. Growing inequality in capital gains has contributed directly to rising inequality in spending power (Advani, Lonsdale and Summers 2024).
Such wealth inequality impacts people’s perceptions of fairness. It plays out in public sentiment of communities being neglected. This drives the politics of discontent (Raikes, Giovannini, and Getzel 2019), given the deep link between wealth, opportunity and economic success, and sense of decline.
Three quarters of the UK public view wealth or income inequality as a moderate or big problem (Fairness Foundation 2024). Nonetheless, attitudes to wealth are complex. Creating widespread wealth is a desired outcome of a prosperous economy. Nonetheless, the public consistently back higher taxes on unearned wealth – wealth not earned from work – especially if paid by the wealthiest (Smith 2023). A clear majority (68 per cent) of the wealthiest people support this themselves (Patriotic Millionaires UK 2023).
RECOMMENDATION
REBALANCE WEALTH ACROSS ENGLAND AND USE PROCEEDS TO INVEST IN REGIONAL GROWTH
Taxing wealth more fairly would reduce regional wealth inequality and, potentially, could provide a revenue stream to fund additional long-term regional economic development. Incomes from wealth drives inequality and equalising capital gains taxation to the same rate as income tax would dampen this effect. It should be the first step to accelerate wealth rebalancing.
IPPR analysis has found that taxing capital gains at the same rate as the income schedule could raise £50 billion by 2027 (Dibb and Parkes 2022), around £12.5 billion per annum across the UK. Other estimates vary, such as the Office for Tax Simplification’s (2020) estimate of £14 billion a year.
This would provide sufficient funding for a 15-year programme of flexible and devolved funding for regional development in England at £7.6 billion annually, putting the UK’s rebalancing efforts closer to those in Germany where regional inequalities have fallen below UK levels, as recommended in last year’s State of the North report (Johns and Hutt 2023). Appropriate allocations for Scotland, Wales,
16 IPPR North | State of the North 2024 Charting the course for a decade of renewal
and Northern Ireland would accrue to the national devolved administrations, which they could deploy similarly.
Remaining funds available for England could be deployed to stabilise local government finances ahead of a longer-term fairer settlement for local places, in line with estimates of current funding gaps of around £2 billion annually over the next two years alone (LGA 2023).
Fairer wealth taxes would have a double benefit: both being redistributive in of themselves and then financing better local services and wealth creation across England’s regions would provide reinforcing benefits in closing regional divides.
IPPR North | State of the North 2024 Charting the course for a decade of renewal 17
4. EMPOWER LOCAL GOVERNMENT THROUGH FAIR AND SUSTAINABLE FINANCING
4.1. THE PAST DECADE OF DEVOLUTION HAS SEEN NEW POWERS AND INSTITUTIONS BUT A CENTRALISATION OF FINANCIAL POWER
There has been significant progress over devolution to combined authorities in the last decade – with nine in 10 people in the North now covered by a devolution deal, and nearly 60 per cent of England’s population3 (ONS 2023b). These places have received growing powers over areas like adult education, transport, and investment.
The extent to which power has genuinely been decentralised is a more complex picture, as financial resources and capacity have been centralised, rather than decentralised as the devolution rhetoric over the last parliament would suggest.
Locally controlled spending power, which includes spending power across local councils, combined authorities, and the Greater London authority,4 has drastically fallen in England since 2009/10 – especially in urban areas. Taking all locally controlled spending power together, the average local government district area has seen a fall of £1,307 per head of population in real terms (see figure 4.2 below).
Spending power is a government metric used to capture the amount of resource that local government can use to make decisions5. Even areas which have new devolved institutions have seen an overall reduction in locally controlled resources, due to heavy cuts to constituent councils’ budgets (figure 4.2).
In 2009/10, 30 per cent of total public spending in England was spent by local government. London benefitted then from longstanding devolution, with local control of 35 per cent of total public spending within London. Meanwhile in the North, at the time without significant devolution, only 29 per cent of all public spending in the region was locally controlled. By 2022/23, this had fallen nearly 10 percentage points to just a fifth of all public spending in England and the North being spent at local government level. This trend is largely driven by the extent to which local councils, especially deprived urban ones, have taken the brunt of austerity (see below, Johns 2020).
3 This includes all deals agreed with government but not yet implemented, such as Norfolk and Lancashire, and places where devolved government is in place like London and Greater Manchester.
4 There are local exclusions such as policing and national park bodies. See annex 1 for more information.
5 See annex 1 for more information.
18 IPPR North | State of the North 2024 Charting the course for a decade of renewal
FIGURE 4.1: SPENDING IN ENGLAND HAS CENTRALISED SIGNIFICANTLY AND IS PROJECTED
FALL TO BELOW 15 PER CENT OF PUBLIC SPENDING FOR REGIONS OUTSIDE LONDON BY 2030
Share of total public spending accruals spent by local government 2009/10–2032/33 in percentage terms
Note: IPPR North projected trends identified with dotted lines. Due to the extraordinary spending related to the Covid-19 pandemic, we have excluded the 2020/21 fiscal year from our trend analysis. See annex 1 for methodology.
Source: HMT 2023a
Should this trend continue, locally controlled public spending as a share of total public spending could fall as low as 13 per cent in England and the North, less than a sixth of spending, while some regions like the Midlands are on course to reach around 10 per cent by the next decade. This would represent a significant centralisation of public spending. This would likely be slowed by local government approaching an increasingly unviable position and a clear policy response (as recommended below) to prevent widespread council failure, including to deliver statutory functions. Nonetheless, it is indicative of the drastic reductions to date and the direction of travel in terms of the fiscal centralisation that these have driven to date.
4.2. CUTS TO LOCAL GOVERNMENT HOLD BACK DEVOLUTION AND EXACERBATE INEQUALITY
In practice, the centralisation of financial power has manifested as significant local spending cuts. These deeply undermine the aims of devolution, hamstringing the power of new regional institutions and the ability of local leaders to deliver in the interests of people in their places.
London
North West
North East
South West
England
North (all)
South East
Yorkshire and the Humber
East Midlands
West Midlands
East
IPPR North | State of the North 2024 Charting the course for a decade of renewal 19
0% 5% 10% 15% 20% 25% 30% 35% 2009/102010/112011/122012/132013/142014/152015/162016/172017/182018/192019/202020/212021/222022/232023/242024/252025/262026/272027/282028/292029/302030/312031/322032/33
FIGURE 4.2 LOCALLY CONTROLLED SPENDING POWER HAS DRASTICALLY FALLEN, ESPECIALLY IN URBAN AREAS, EVEN AREAS WHERE THERE ARE NEW DEVOLVED INSTITUTIONS
Change in total locally controlled spending power per head 2009/10 to 2022/23 across all tiers of local government in England, displayed at the district/unitary authority level (per person £ in 2023 prices)
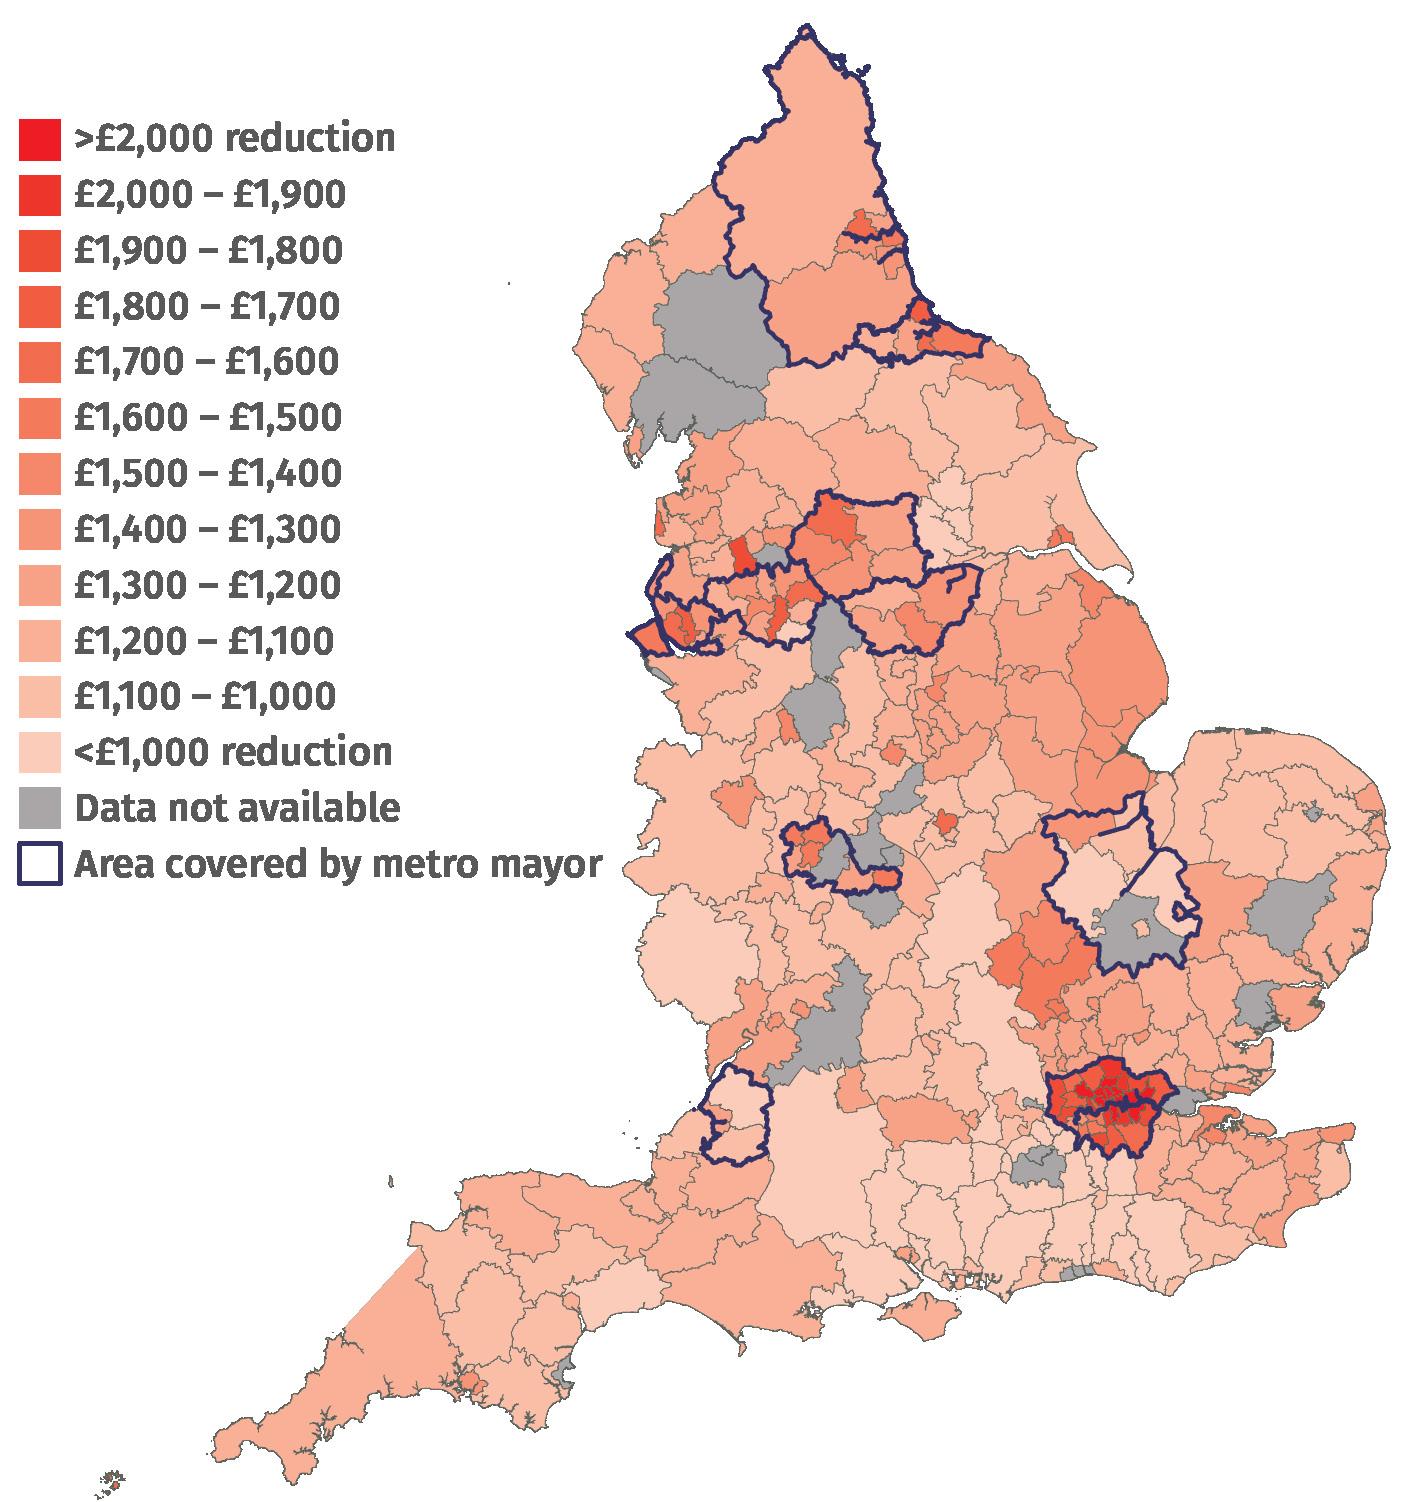
Note: See annex 1 for methodology.
Source: DLUHC (2023)
Council finances are unsustainable, and 75,000 council assets worth £15 billion have been sold since 2010 (Billingham et al 2023). Asset sales, like reserves, can only be used once to stave off crisis. A quarter of councils are now at risk in the next five years (Woolley 2024) with one in five council leaders in England considering it likely that they will issue a Section 114 notice in the next 15 months – indicating they cannot balance their budget (LGA 2023).
The consequence of this is fewer, poorer public services – from closed libraries, leisure centres, museums, parks, and youth centres to reduced care for looked after children, growing numbers of families in temporary accommodation, and a slow dismantling of civic infrastructure (see Johns 2020 or Billingham et al 2023 for more examples).
20 IPPR North | State of the North 2024 Charting the course for a decade of renewal
Substantially reduced local financial power holds back local efforts to improve wealth, opportunity, and health outcomes, creating deep discontent as areas feel neglected. Meanwhile, devolution to the combined authority level within a worsening financial climate for local government limits its impacts. Sustainable financial power would empower local leadership to tailor investment and services to local priorities, enhancing devolution significantly (Giovannini and Johns 2021), unlocking growth and wealth (Raikes 2020, Johns and Hutt 2023).
Addressing regional inequality thus demands redistributing not only political power but financial power too. Internationally, UK local government is notably underpowered at all levels. Correcting this imbalance would foster a more prosperous, equitable country with improved social outcomes (Johns and Hutt 2023).
Public sentiment is sensitive to spending imbalances between places, which are more keenly felt in the North (Ipsos 2023). The public want local leaders to have more control over both spending (ibid) and decisions over policy, including schools, transport, policing, social care, planning, training and skills, and culture (RSA 2020). Strong national public support for further powers to be devolved is higher in the North (Patel and Quilter-Pinner 2022).
RECOMMENDATION
FIX LOCAL FUNDING WITH A FAIR, NEEDS-BASED, LONG-TERM ,WHOLE-PLACE MODEL
Stabilising local government finances is a much-needed mechanism for reducing regional inequality. Devolution and local funding cannot be considered separately. A fair, needs-based, whole-place funding formula over multiple years for the local level is needed, and would underpin progress on devolution of powers.
A fair and needs-based approach would ensure that all places receive sufficient funding to provide local public services, defined according to a universal service offer across places, and offer clarity for authorities and the public on local competencies and duties (Johns and Hutt 2023, Billingham et al 2023). It would be tied to an assessment of places’ needs and challenges, including demographics, deprivation, and delivery considerations for public services. Local authorities would be involved as an equal partner to central government in this process (Johns and Hutt 2023).
A long-term approach would move from the cycle of one-year settlements towards multi-year settlements, providing stability and predictability for all tiers of local government.
A whole-place model acknowledges the interconnected nature of public services and the demand for them, encouraging a more strategic, collaborative, and multi-agency approach. Regard should be given to all public money spent within local areas across public services. New powers should allow collaboration and pooling of budgets around local priorities across services. Such an approach would permit joined-up and preventative, invest-to-save, and similar approaches to help manage growing demands across policy areas, and provide flexibility to tackle root causes of public service demand. Where possible, funding should be simplified into whole-place pots for local government. In areas with multiple tiers of local government, such as local and combined authorities, competencies and need would be considered in distribution. The current local growth programme is a prime first candidate for
IPPR North | State of the North 2024 Charting the course for a decade of renewal 21
combining, fairly distributing, and devolving funds for whole places (see IPPR North 2023 for example).
Fairer local funding – taking account of need – could, in isolation, be delivered initially as a simplification and reallocation exercise. Where additional powers are devolved, existing funding attached to those policy areas should be devolved too to the tier receiving new powers or duties.
We further recommend additional funding to stabilise local government finances, with priority given to areas with high need now, reflecting spending pressures in the order of £4 billion in the next two years (LGA 2023). The current precarity of local government finance and declining spending and investment must end. There is a need to increase local funding to offset and begin to reverse austerity’s damage to local outcomes and regional inequalities.
Building from this, a roadmap for further fiscal devolution is needed considering all tiers of local government, embedding the above considerations: fair, needsbased, empowering and flexible to secure outcomes. We recommend implementing modest initial measures quickly, such as local tourist taxes as is common in many other countries, local levies on health-harming-activities (see below), or local land capture to support infrastructure investment and economic renewal (Johns and Hutt 2023). Over the longer term, a deeper degree of fiscal devolution should empower local leaders combined with a clear redistributive mechanism to safeguard fair regional growth and renewal.
22 IPPR North | State of the North 2024 Charting the course for a decade of renewal
66%
64%
62%
60%
58%
56%
54%
5. DRIVE OPPORTUNITY ACROSS ENGLAND
5.1. TOO MANY ARE EXCLUDED FROM GOOD QUALITY JOBS AND ECONOMIC OPPORTUNITY
Access to opportunity is highly unequal. Work is the main way that people access economic opportunity and its benefits, even though its role in reducing poverty has slowed. Two-thirds of children and working-age adults living in poverty live in families where at least one adult works – much higher than just over half in 2009/10 (Health Foundation 2022).
Well-paid, secure work should be the best way to secure good living standards in the UK – and access to opportunity, to good quality jobs, is a consistent aim of regional rebalancing across UK political parties. However, outcomes are not evenly regionally distributed or accessible, and the public recognise this (Billingham et al 2023).
Employment rate (% of aged 16+), 2009–2030
68% 2 0 0 9 2 0 1 0 2 0 1 1 2 0 1 2 2 0 1 3 2 0 1 4 2 0 1 5 2 0 1 6 2 0 1 7 2 0 1 8 2 0 1 9 2 0 2 0 2 0 2 1 2 0 2 2 2 0 2 3 2 0 2 4 2 0 2 5 2 0 2 6 2 0 2 7 2 0 2 8 2 0 2 9 2 0 3 0
London UK 52%
South East
East
England
East Midlands
Yorkshire and the Humber
West Midlands
North West
North (all)
North East
Note: IPPR North projected trends identified with dotted lines, see annex 1 for methodology.
Source: ONS 2023d, OBR 2023
IPPR North | State of the North 2024 Charting the course for a decade of renewal 23
FIGURE 5.1 THE GAP BETWEEN EMPLOYMENT OUTCOMES IN THE NORTH AND OTHER ENGLISH REGIONS HAS WIDENED IN RECENT YEARS, AND IS PROJECTED TO GROW
South West 50%
While overall employment rates grew in all regions from 2009 to 2023, the gap in regional outcomes has not closed – a large factor being London’s breakaway performance over the period. Job creation has been concentrated in London and the South East.
The gap between the employment rate of England as a whole and the North remained around 2 percentage points over the period, and has marginally increased over the period. On current trends, this gap is going to get wider, reaching over 2.5 percentage points by the beginning of the next decade – and the gap between England’s regions and London is accelerating. This is despite the North’s employment rate rising from 57 per cent in 2009 to 58 per cent in 2023, and being projected to hit 59 per cent by 2030, for those aged over 16. This corroborates previous findings that the North is not closing the regional gap across different employment metrics nor has done so over the decade (Webb et al 2022).
score
Note: See annex 1 for methodology.
Source: ONS 2023e, 2023b, 2023d, 2023f, 2023a, 2022b
24 IPPR North | State of the North 2024 Charting the course for a decade of renewal
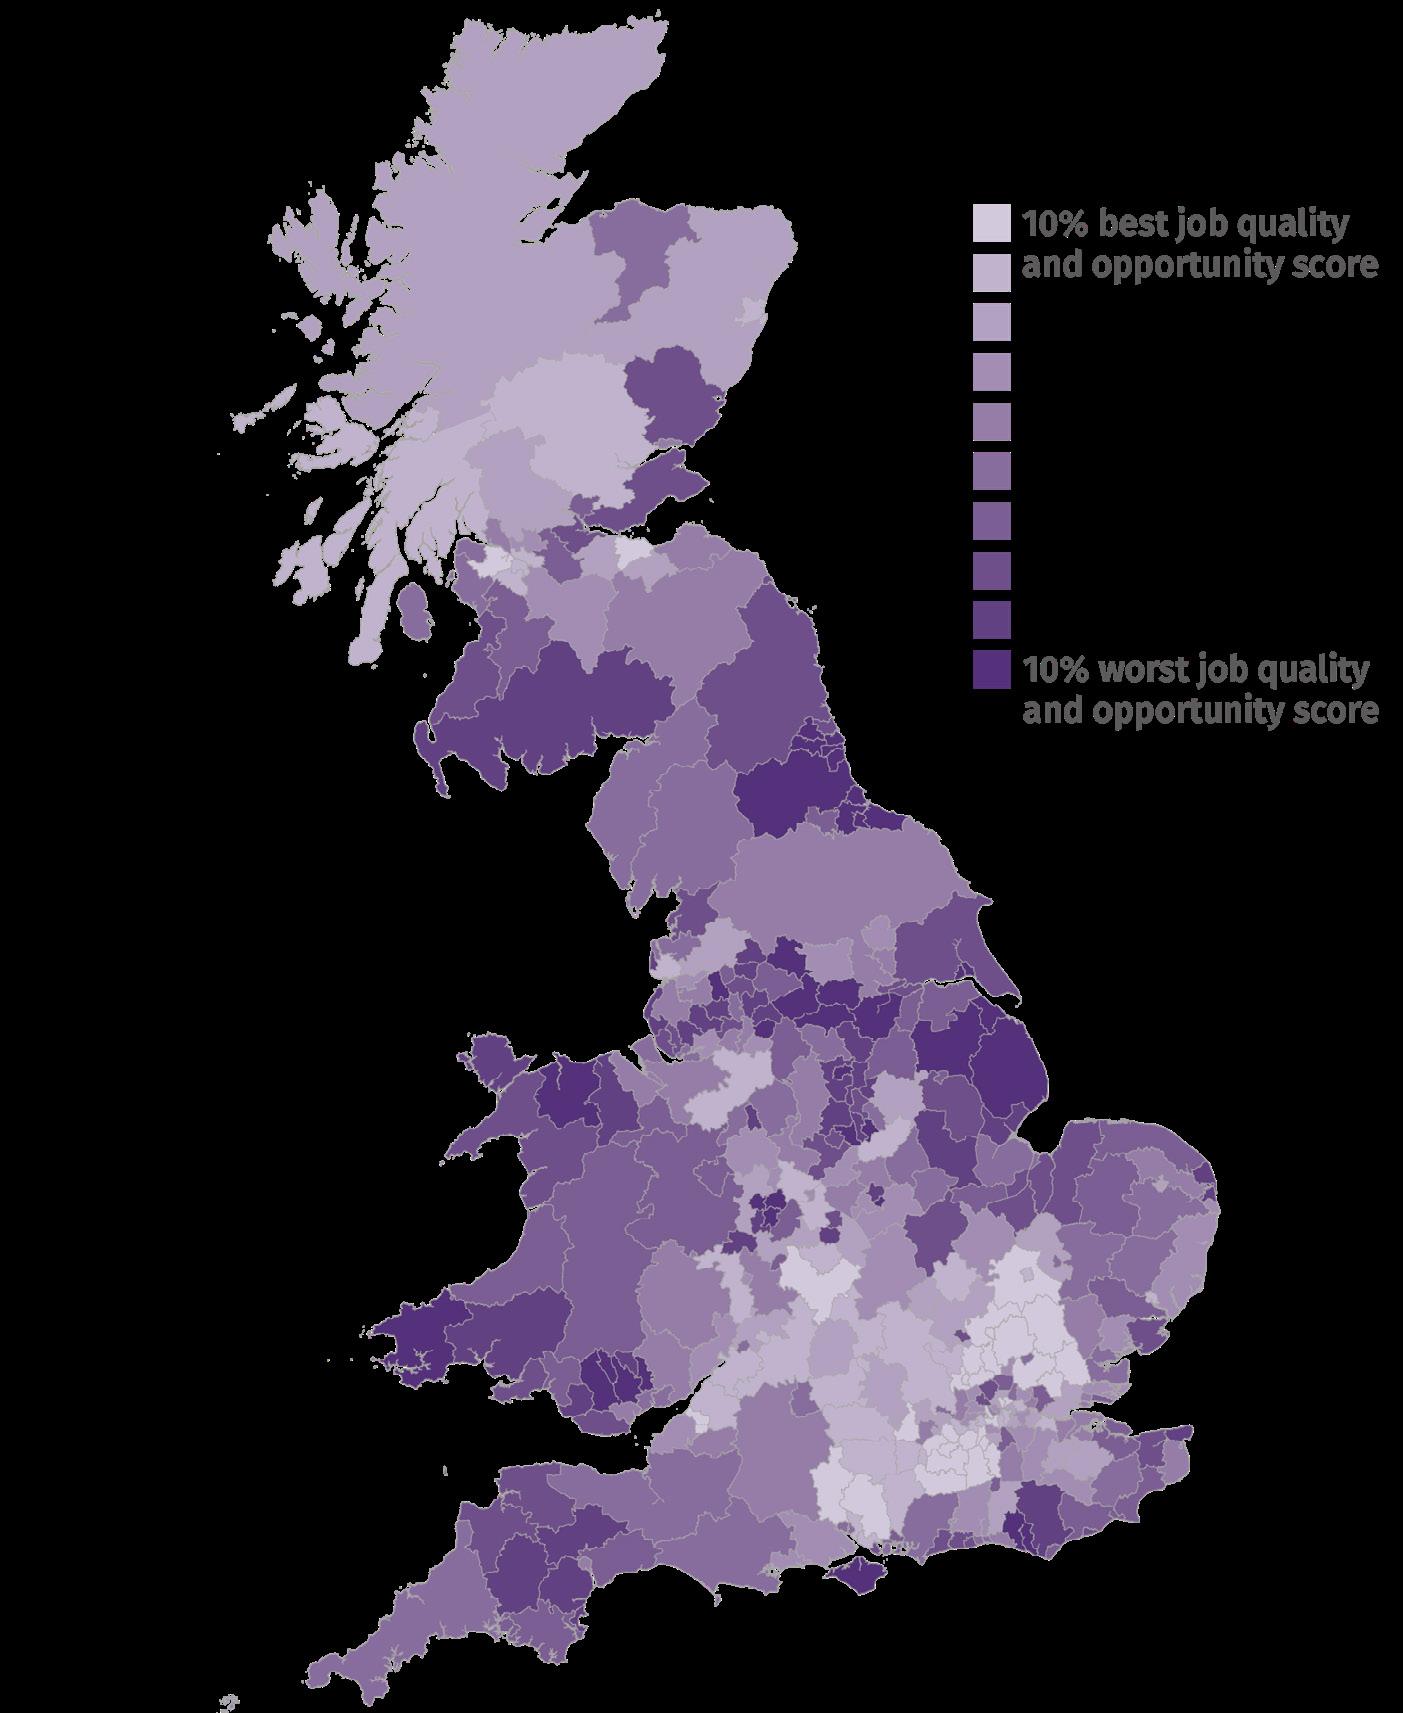
FIGURE 5.2 ACCESS TO HIGH QUALITY JOBS VARIES CONSIDERABLY AROUND THE COUNTRY WITH COLDSPOTS ALONG THE TRANSPENNINE/M62 BELT, NORTH EAST, AND COASTS Local authority districts by decile of job quality and opportunity index
These trends are driven both by uneven labour demand and uneven labour supply. On labour demand, the numbers of highly paid jobs and access to opportunity vary. While for labour supply, the poor health of our communities is driving divergence (Jung et al 2021, Poku-Amanfo et al 2024).
The quality of jobs, defined by good pay, secure work and hours, how accessible they are, and workforce qualifications, is also unequally distributed around the country. The North fares particularly poorly relative to the rest of Great Britain. Growth in poor quality work in the North has contributed to this (Webb et all 2022).
5.2. LEVELLING UP OPPORTUNITY IS A PRIORITY FOR PEOPLE IN THE NORTH
Reversing this trend needs both supply-side and demand-side interventions –including action on health (see chapter 6). The creation of good-quality jobs is necessary for rebalancing opportunity. It also has support from the public, who are particularly concerned with inequalities in access to opportunity (Beaver 2023), and who see it as central to how levelling up is defined (More in Common 2023). Economic improvements, namely higher wages, better job opportunities, and improved public transport – all central to economic opportunity – feature strongly in the public’s priorities for levelling up, with job opportunities particularly emphasised for people in the North East (Ipsos 2023).
Creating opportunity demands a strategic approach. Former industrial areas, many of which are in the North, see concentrations of low job quality. A solution at scale is needed to improve the long-term trajectory of regional inequality and create change for places particularly scarred by deindustrialisation. As yet, approaches to levelling up have been small scale, lacking in coordination and too short term to achieve this (Johns et al 2023), while the constant tumult of economic development funding and institutions has undermined the approach.
RECOMMENDATION
CREATE OPPORTUNITY ACROSS ENGLAND WITH A LONG-TERM, PLACE-BASED GREEN INDUSTRIAL STRATEGY
A strategic, long-term, and scaled effort is needed to create opportunity throughout England, which should be rooted in place and clear in its mission. This should be a new, green industrial strategy – guiding investment, policy, and plans with wider partners.
Ensuring responsive and place-based approaches calls for industrial strategies at different levels that are nested within each other. These interdependent plans at combined authority or county, pan-regional, and national level would help drive a coherent economic plan for economic growth, decarbonisation and regional rebalancing. Meanwhile, the central advisory body for the national strategy should include regional representation alongside social partners, mirroring regional and local advisory bodies.
This model of green industrial strategy rests on collaboration at all geographies between all tiers of the state, businesses, and trade unions working together, in a social partnership model.
A national strategy would require corollary strategic funding, and assessment and regulatory frameworks to support local delivery and institutions, with specific areas most impactful at regional level delivered at pan-regional level, such as strategic transport (see Raikes 2019). It is expected that subsequent economic policymaking
IPPR North | State of the North 2024 Charting the course for a decade of renewal 25
complement this overarching green growth plan including across regional, transport, competition, planning, and employment strategies.
Following the lead of the US Inflation Reduction Act, investment should be targeted at ‘energy communities’, defined as places with significant brownfield sites, coalfield communities, high fossil-fuel employment, and higher than average unemployment rates (Westwood et al 2023). Investment could be supported by tariff protection measures, creating domestic markets through targeted procurement and training specialised engineers, as we have seen in successful industrial policies elsewhere, including France, the Netherlands, and Japan (Alvis et al 2023).
Learning from local employment charters, public investment in a green industrial strategy and subsidies should be conditional on job quality, wages, and trade union recognition or signing local charters where applicable.
Long-term joint funding from climate investment plans and a joined-up approach with economic development funding streams would underpin the strategy, with the expectation of alignment across strategy, policy, and funding streams to drive complementary impact. Funding would be multiplied by crowding in private sector investment in places, with learning from how this has been delivered through strong local partnerships internationally (Johns and Hutt 2023).
26 IPPR North | State of the North 2024 Charting the course for a decade of renewal
6. REBUILD HEALTHIER PLACES
6.1. DISPARITIES IN HEALTH OUTCOMES BETWEEN PLACES ARE GETTING WORSE
The UK is getting poorer and sicker, with the poorest and sickest areas worsening fastest (Poku-Amanfo et al 2024). Better health is the best measure of wellfunctioning places (Billingham et al 2023, Marmot 2020).
Our regional imbalances drive health inequalities, reflected in rising deprivationrelated health disparities and severe inequality in age-adjusted mortality – placing the UK among the worst of advanced economies (Marmot 2020, Raikes et al 2019). Over the last decade, life expectancy stopped improving as inequality widened (ibid), healthy life expectancy has stagnated, and regional gaps have endured.
Note: IPPR North projected trends identified with dotted lines, see annex 1 for methodology. Source: ONS 2023b, 2023g
While London, the North West and Yorkshire and the Humber have seen limited growth in overall healthy life expectancy from 2009 to 2020, places like the North East and the Midlands have seen clear decreases, and there are differences between male and female trends (see table 6.1).
South East
London
South West
England
North West
East
Yorkshire and the Humber
North (all)
West Midlands
East Midlands
North East
IPPR North | State of the North 2024 Charting the course for a decade of renewal 27
YORKSHIRE,
FALLS
Healthy life expectancy (weighted by sex),
FIGURE 6.1: SIGNIFICANT GAPS IN HEALTHY LIFE EXPECTANCY ARE EXPECTED TO ENDURE AS HEALTHY LIFE EXPECTANCY RISES IN LONDON, GROWS SLOWLY IN THE NORTH WEST AND
BUT
ELSEWHERE
2009–2030
58 59 60 61 62 63 64 65 66 67 2009-112010-122011-132012-142013-152014-162015-172016-182017-192018-202019-212020-222021-232022-242023-252024-262025-272026-282027-292028-30
Looking ahead, current trends suggest a steady improvement in healthy life expectancy in the North and a strong, sustained improvement in London. The South and the Midlands are on a declining trajectory. Though the direction for the North overall is positive, by 2030 the number of years you can expect to live in good health in the North and Midlands would be two and a half years shorter than the South and three and a half years shorter than in London. The worst performing region, the North East, is also on course for a decline across both male and female groups.
Extending these overall trajectories, the gap in healthy life expectancy between the North and the all England average would not close until 2056/57 while the gap between the North and South East would endure until 2079/80, and the gap between the North and London would grow.
Healthy life expectancy by sex and region over time (2009-11 to 2028-30) in years
Note: See annex 1 for methodology.
Source: ONS 2023b, 2023g
28 IPPR North | State of the North 2024 Charting the course for a decade of renewal
GROW
MALE AND FEMALE
OVERALL HEALTHSTAGNATION HIDES RISING MALE AND FALLING FEMALE OUTCOMES
TABLE 6.1: LONDON, AND THE NORTH WEST ARE THE ONLY REGIONS WHERE LIFE EXPECTANCY IS ON COURSE TO
FOR
POPULATIONS, WHILE ENGLAND’S
Region Sex 2009-11 2017-19 Baseline (200911 to 2017-19) change in years 20282030 Projected (201719 to 2028-30) change in years North Male 60.6 61.1 0.5 61.8 0.7 North Female 61.6 61.5 -0.1 61.9 0.4 North Combined 61.1 61.3 0.2 61.9 0.6 North East Male 59.7 59.4 -0.3 59 -0.4 North East Female 60.3 59 -1.3 58.5 -0.5 North East Combined 60 59.2 -0.8 58.7 -0.5 North West Male 60.8 61.7 0.9 62.4 0.7 North West Female 61.7 62.2 0.5 63.2 1 North West Combined 61.2 61.9 0.7 62.8 0.9 Yorkshire and The Humber Male 60.8 61.2 0.4 62.4 1.2 Yorkshire and The Humber Female 62 61.9 -0.1 61.8 -0.1 Yorkshire and The Humber Combined 61.4 61.6 0.2 62.1 0.5 East Midlands Male 62.6 62.2 -0.4 62.1 -0.1 East Midlands Female 63.2 61.9 -1.3 59.6 -2.3 East Midlands Combined 62.9 62 -0.9 60.8 -1.2 West Midlands Male 62.3 61.5 -0.8 61.2 -0.3 West Midlands Female 62.8 62.6 -0.2 62.2 -0.4 West Midlands Combined 62.5 62.1 -0.4 61.7 -0.4 East Male 64.7 64.3 -0.4 63.4 -0.9 East Female 66.2 64.2 -2 61.4 -2.8 East Combined 65.5 64.3 -1.2 62.4 -1.9 London Male 62.7 63.5 0.8 65.4 1.9 London Female 63.8 64 0.2 65.4 1.4 London Combined 63.3 63.8 0.5 65.4 1.6 South East Male 65.4 65.3 -0.1 66.1 0.8 South East Female 67 65.8 -1.2 65.1 -0.7 South East Combined 66.2 65.6 -0.6 65.6 0 South West Male 65.1 65.2 0.1 64.5 -0.7 South West Female 65.9 65 -0.9 64 -1 South West Combined 65.5 65.1 -0.4 64.2 -0.9 England Male 61.4 61.2 -0.2 63.6 2.4 England Female 64.1 63.5 -0.6 63.1 -0.4 England Combined 63.6 63.4 -0.2 63.4 0
6.2. PROSPERITY AND HEALTH ARE DEEPLY LINKED, TRAPPING PLACES IN A DOUBLE INJUSTICE OF POOR HEALTH AND POOR PROSPERITY
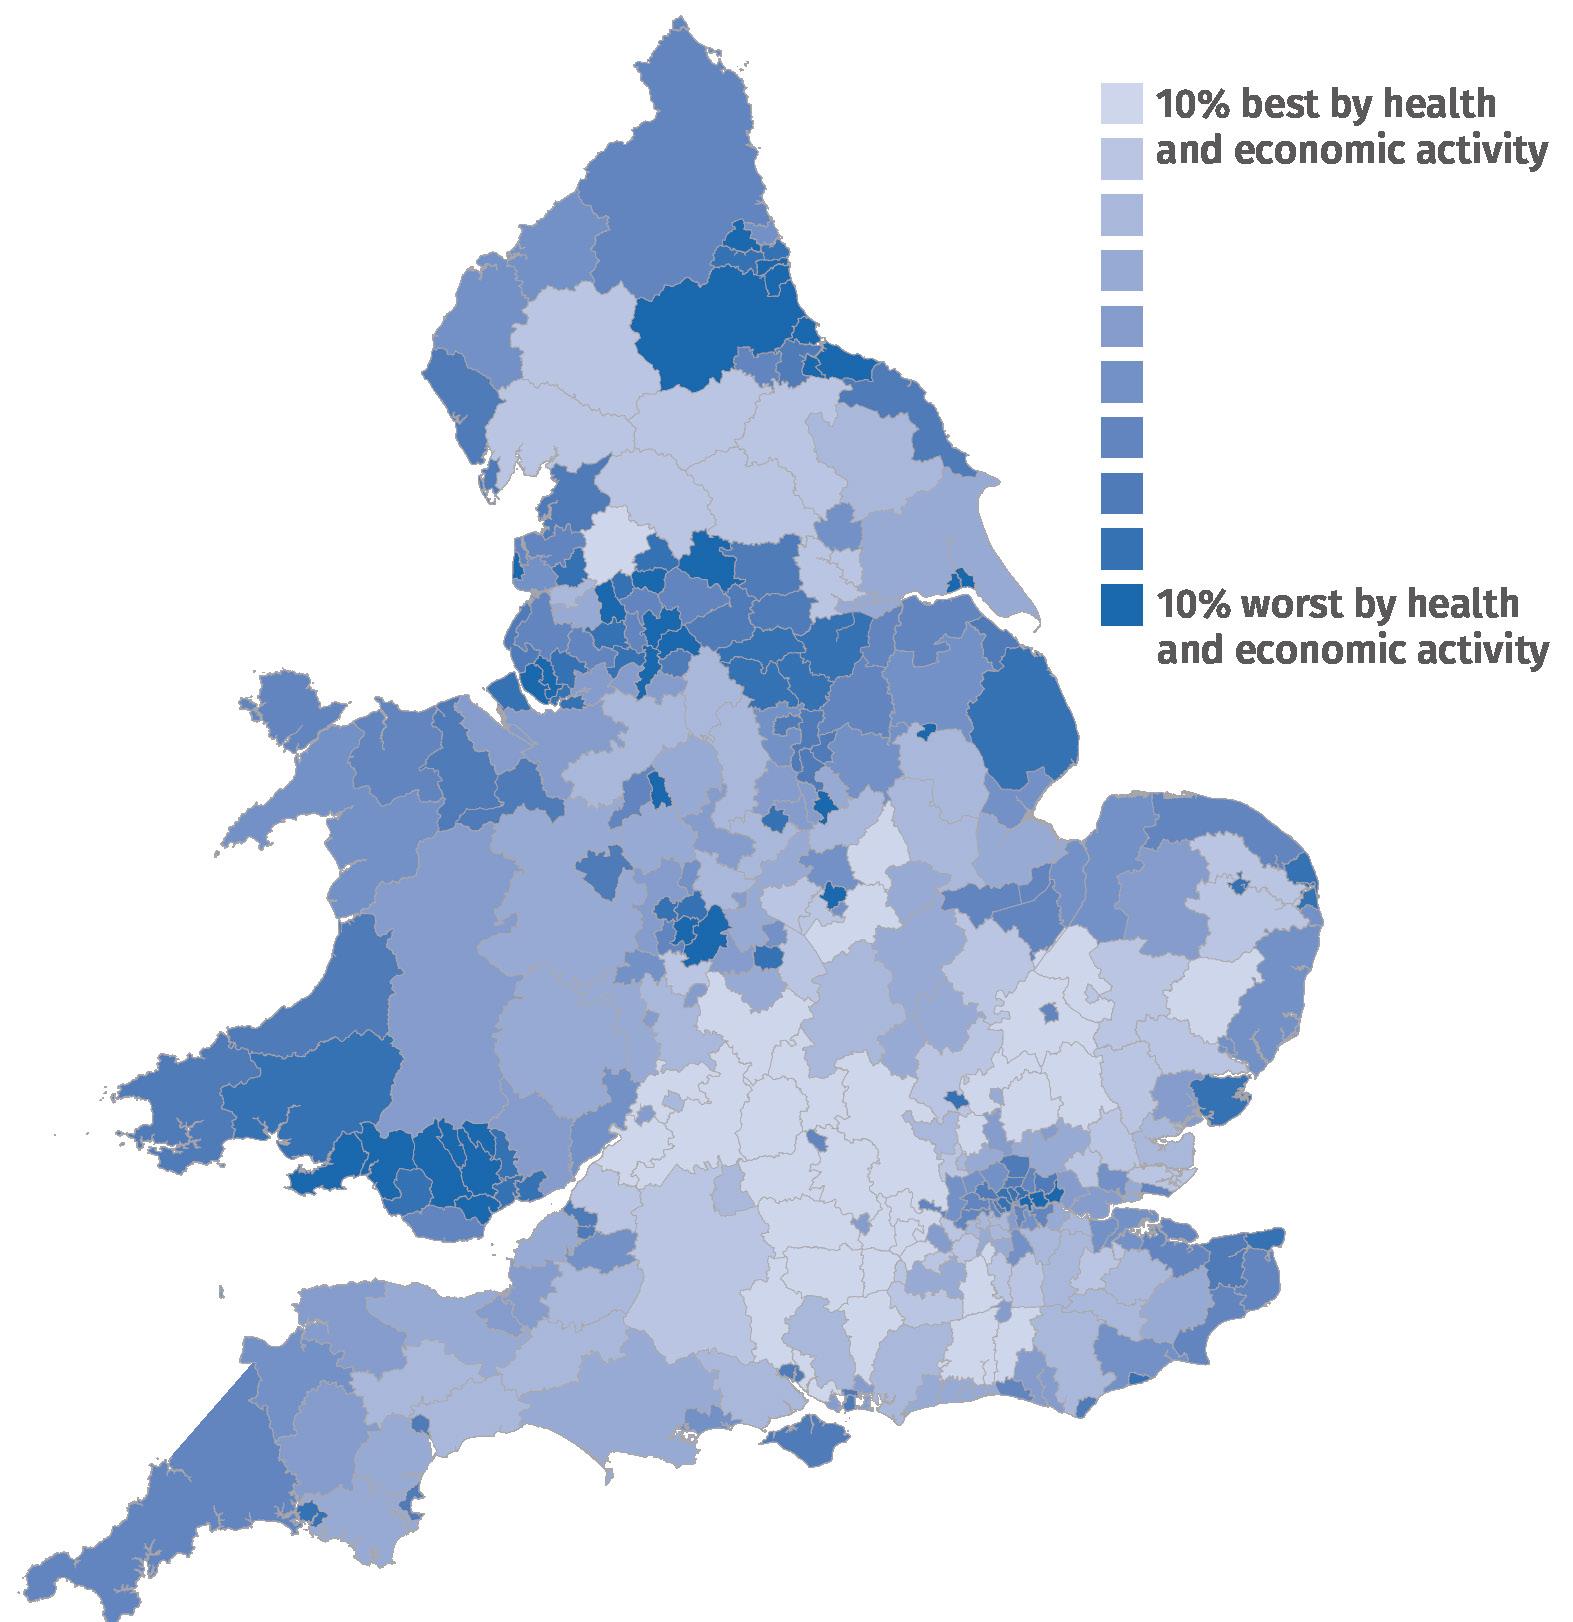
Persistent regional gaps are not improving fast enough, and are accompanied by severe local inequalities. Mortality rates in northern places like Blackpool, Manchester or Hull resemble those in Turkey (Raikes et al 2019). Similarly to wealth outcomes, regions with lower health outcomes are more unequal. The North East, North West and Yorkshire and the Humber having the highest neighbourhood-level inequalities in England (Poku-Amanfo et al 2024). Meanwhile, those in the bottom quartile of local authorities can expect to live 10 fewer years in good health than those in the top quartile, alongside a seven-year gap in disability-free life expectancy between most and least deprived places in England (ibid).
AND COASTAL AREAS
Decile of rank of healthy, prosperous places index – proportions of bad health and economic inactivity
Note: See annex 1 for methodology.
Source: ONS 2022b, 2023h
IPPR North | State of the North 2024 Charting the course for a decade of renewal 29
FIGURE 6.2: POOR HEALTH AND ECONOMIC OUTCOMES CLUSTER TOGETHER IN URBAN AREAS, THE NORTH,
The striking double injustice of poor health and economic outcomes clustering together means those in the most deprived areas are over twice as likely to report poor health and 40 per cent more likely to be economically inactive (ibid).
This injustice concentrates in the North, larger urban areas, and parts of coastal England (figure 6.2). Examining health and economic activity together, lowestperforming Liverpool and Manchester, where 9 per cent of local people report bad health and over a third of working-aged people are economically inactive, notably lag best performing Hart where just 2.8 per cent of people are in bad health and below a fifth of working-aged people are economically inactive.
Tackling this double injustice means confronting the symbiotic relationship between health and prosperity. Health is essential to prosperous economies and vice versa (Marmot 2020). Closing the health gap between the North and the rest of England could add circa £20 billion (in annual GVA) to the UK economy (Thomas et al 2020).
6.3. THE PUBLIC WANT MORE CONTROL AND MORE INVESTMENT IN THEIR HEALTH
70 per cent of the public say that inequality in health and life expectancy is a moderate or big problem, with concern across age groups, past voting behaviour, and region (Fairness Foundation 2024).
People care about their and their community’s health (Billingham et al 2023, Poku-Amanfo et al 2024). IPPR and IPPR North research finds that people prioritise security, opportunity, stability, and safety as foundations for healthy lives (PokuAmanfo et al 2024).
There is strong public understanding of links between health and economic prosperity. Communities want empowerment individually and for their communities collectively in determining health, and view it as a collective responsibility across agencies and tiers of government (ibid).
Health inequalities – whether by region or neighbourhood – stem from avoidable social and economic disparities. Local government has a clear role. This would require sufficient funding for localities and empowering leaders to act on improving social determinants of health (Thomas et al 2020).
RECOMMENDATION
REBUILD HEALTHY PLACES WITH HEALTH AND PROSPERITY IMPROVEMENT ZONES
The next government should pursue faster reductions in health inequalities. To do so, we recommend implementing the IPPR Health and Prosperity Commission’s Health and Prosperity Improvement (HAPI) zones (Poku-Amanfo et al 2024).
HAPI zones are locally led, mission-based partnerships targeting root causes of health inequality. They involve intensive intervention across agencies, creating long-term plans to improve the foundations of good health. Those foundations are: safe homes, healthy minds and bodies, clean air, good jobs, strong relationships and community, freedom from addiction, and great starts to life.
Zone partnerships would co-create and deliver Health and Prosperity Improvement Mission Delivery Plans with local people. Learning from policy successes like the
30 IPPR North | State of the North 2024 Charting the course for a decade of renewal
Wigan Deal, these would be finalised as social contracts between partners, including local and national government. Local authorities would designate the zones with whole-society partnerships to deliver their plans encompassing business, public services, civil society, and local communities. Drawing on partners’ levers and flexible, strategic funding, the model learns from successful partnerships in the UK and internationally (ibid, Johns and Hutt 2023).
New primary legislation would enable HAPI zones (see Poku-Amanfo et al 2024) alongside a reformed levelling up mission for health, which can be quickly implemented through the Levelling Up and Regeneration Act, setting a 30-year mission to be the healthiest country with every region reaching healthy life expectancy of 67. New devolved powers, a route for local authorities to request further powers through HAPI zones, and central support for knowledge sharing and oversight (see Poku-Amanfo et al 2024) would accompany it.
HAPI zones would use flexible, strategic funding which could invest across policy areas that improve the foundations of good health, including public transport, business incentives, healthy food subsidies, innovative social care at home models, and more, all determined through consultation and co-creation through the plan setting process. This would be funded by:
• a £3 billion Health Creation Fund allocated on a needs basis, funded by national levies on health-harming-industries
• devolved public health revenue powers, allowing local authorities to implement local levies on health harming activities like gambling premises or vape shops, additional controls over business rates related to health impact, and increased fungibility of local funding pots including the ability to use funds raised through clean air or congestion charging to invest in HAPI zones or use economic development funding within zones and plans where missions overlap between policy areas.
IPPR North | State of the North 2024 Charting the course for a decade of renewal 31
7. CONCLUSION
England faces systemic, pronounced and ongoing regional inequalities – resulting in shorter, less fulfilling, and poorer lives.
The status quo cannot continue. As our new analysis demonstrates, continuing our current course will result in growing gaps in opportunity, wealth, power and health over the next decade. The interconnectedness of these outcomes is also clear. No outcome sits in isolation. Places with more power to build opportunity, develop prosperity, and share wealth in turn lead healthier lives. While healthier communities are more productive and can build more wealth, generate opportunity, and exercise local power.
Against the backdrop of upcoming local, regional and a general elections, polling data and focus group findings show consistent public concern about regional inequalities: 60 per cent of the UK public say inequality between regions is a moderate or big problem (Fairness Foundation 2024) while two in five Britons say levelling up should be one of the government’s top priorities (More in Common 2023).
The next government must grasp the opportunity of the decade ahead to correct course for our places and regions. We recommend five areas of focus and suggest pioneering policies within them to kickstart this decade of regional renewal.
1. Restore voters’ trust through empowered local and regional government and a regional lens on national policymaking.
2. Rebalance wealth in England by taxing unearned income on wealth more fairly, at the same rate as taxes on working people, to fund investment in regional economic development and local public services.
3. Empower places by fixing local funding with a fair, needs-based, whole-place funding model.
4. Create opportunity across England with a long-term, place-informed green industrial strategies.
5. Rebuild healthy places by establishing and funding Health and Prosperity Improvement zones through national and optional local levies on activities that harm health.
With these five core outcomes and ideas, it is our hope that at the end of this decade, the North will be of equal standing in offering the chance for all to live a good life and to thrive, within a country that is healthier, more prosperous, more fulfilling - and ultimately more equal.
32 IPPR North | State of the North 2024 Charting the course for a decade of renewal
REFERENCES
Advani A, Lonsdale A, and Summers S (2024) Who would be affected by Capital Gains Tax Reform?, Cage Policy Briefing no 40. https://warwick.ac.uk/fac/soc/economics/research/ centres/cage/manage/publications/bn40.2024.pdf
Advani A and Sturrock D (2023) Reforming inheritance tax, Institute for Fiscal Studies. https://ifs.org.uk/publications/reforming-inheritance-tax
Alvis S, Dibb G, Gasperin S and Murphy L (2023) Market making in practice, IPPR. http://www.ippr.org/research/publications/making-markets-in-practice
Arnold S and Stirling A (2019) Councils in crisis: Local government austerity 2009/10 –2024/25, New Economics Foundation
Beaver K (2023) Britons worry about inequality but put equal opportunities before equal outcomes: 2023 Ipsos Equalities Index, Ipsos. https://www.ipsos.com/en-uk/britonsworry-about-inequality-but-put-equal-opportunities-before-equal-outcomes
Commission on Poverty and Regional Inequality [CPRI] (2023) A good life in all regions: Uniting our country to end poverty, Fabian Society. https://fabians.org.uk/wp-content/ uploads/2023/07/FABJ10444-Commission-Report-230704-WEB.pdf
Cox E and Raikes L (2014) The state of the North: Setting a baseline for the devolution decade, IPPR North.
https://www.ippr.org/articles/the-state-of-the-north-setting-a-baseline-forthe-devolution-decade
Cox E and Raikes L (2015) The state of the North 2015: Four tests for the northern powerhouse, IPPR North.
https://www.ippr.org/articles/the-state-of-the-north-2015
Cox E, Raikes L, and Carella L (2016) The state of the North 2016: Building northern resilience in an era of global uncertainty, IPPR North. https://www.ippr.org/articles/the-state-ofthe-north-2016
Department for Levelling Up, Housing and Communities [DLUHC] (2023) ‘Local authority revenue expenditure and financing’, dataset. https://www.gov.uk/government/ collections/local-authority-revenue-expenditure-and-financing
Uberoi E and Johnston N (2022), Political disengagement in the UK: Who is disengaged?, House of Commons Library. https://researchbriefings.files.parliament.uk/documents/ CBP-7501/CBP-7501.pdf
Fairness Foundation (2024) Unequal Kingdom 2024: Public attitudes to inequalities and their impacts, https://fairnessfoundation.com/unequal-kingdom
Fieldhouse E, Green J, Evans G, Mellon J, Prosser C, Schmitt H, van der Eijk C (2020) Electoral shocks, Oxford University Press. DOI: 10.1093/oso/9780198800583.001.0001
Flanagan B (2016) GB Parliamentary Constituency Hexagon Cartogram (Esri Shapefile), Esri, https://www.arcgis.com/home/item.html?id=15baaa6fecd54aa4b7250780b6534682
Giovannini A and Johns M (2021) ‘Why is a devolution framework needed to ‘level up’, and what should it look like?’, IPPR North. https://www.ippr.org/articles/why-is-adevolution-framework-needed-to-level-up-and-what-should-it-look-like Health Foundation (2023) In-work poverty trends, the Health Foundation.
https://www.health.org.uk/evidence-hub/money-and-resources/poverty/in-workpoverty-trends
HM Treasury [HMT] (2023a) ‘Country and regional analysis’, dataset. https://www.gov.uk/ government/collections/country-and-regional-analysis
HM Treasury [HMT] (2023b) ‘GDP deflators at market prices, and money GDP’, dataset.
https://www.gov.uk/government/collections/gdp-deflators-at-market-prices-andmoney-gdp
Holder J, Barr C and Kommenda N (2017) ‘Young voters, class and turnout: How Britain voted in 2017’, Guardian, datablog. https://www.theguardian.com/politics/datablog/nginteractive/2017/jun/20/young-voters-class-and-turnout-how-britain-voted-in-2017
IPPR North | State of the North 2024 Charting the course for a decade of renewal 33
House of Commons Library (2020) General election results 1918 to 2019, dataset. https://commonslibrary.parliament.uk/research-briefings/cbp-8647/
IPPR North (2023) ‘German-style levelling up would see £854 million annual pot for Yorkshire’s leaders’, press release. https://www.ippr.org/media-office/german-stylelevelling-up-would-see-854-million-annual-pot-for-yorkshire-s-leaders
Ipsos (2023) Ipsos levelling up index: Fieldwork Feb 2023, Ipsos. https://www.ipsos.com/sites/ default/files/ct/news/documents/2023-03/Levelling%20up%20Index%20Wave%203%20 Report.pdf
Johns M (2020) 10 years of austerity: Eroding resilience in the North, IPPR North. https://www.ippr.org/articles/10-years-of-austerity
Johns M and Hutt H (2023) State of the North 2023 – Looking out to level up: How the North and the UK measure up, IPPR North. https://www.ippr.org/articles/looking-out-to-level-up
Johns M, Lockwood R, Longlands S, Qureshi A and Round A (2020) State of the North 2020/21: Power up, level up, rise up, IPPR North. https://www.ippr.org/research/publications/ state-of-the-north-2020-21
Johns M, Lockwood R, Longlands S, Qureshi A and Round A (2020) State of the North 2020/21: Power up, level up, rise up, IPPR North. https://www.ippr.org/articles/state-of-thenorth-2020-21
Jung C and Collings F (2021) Full employment and good jobs for all: Why the UK is seeing a lopsided jobs recovery and what to do about it, IPPR. https://www.ippr.org/articles/fullemployment-and-good-jobs-for-all
Local Government Association [LGA] (2023) ‘Section 114 fears for almost 1 in 5 council leaders and chief executives after cashless autumn statement’, press release. https://www.local.gov.uk/about/news/section-114-fear-almost-1-5-council-leadersand-chief-executives-after-cashless-autumn
Marmot M (2020) ‘Health equity in England: The Marmot review 10 years on’, BMJ
https://doi.org/10.1136/bmj.m693
More in Common (2023) Shifting gears on levelling up: Putting the public and communities in the driving seat, More in Common and Power to Change.
https://www.moreincommon.org.uk/media/mdbh0v3a/shifting-gears-onlevelling-up-more-in-common-and-power-to-change.pdf
Myer L and Bailey A (2023) ‘What should a North East child poverty strategy look like?’, IPPR North, blog.
https://www.ippr.org/articles/what-should-a-north-east-childpoverty-strategy-look-like
Nanda S and Parkes H (2019) Just tax: Reforming the taxation of income from wealth and work, IPPR.
https://www.ippr.org/articles/just-tax
Office for Budget Responsibility [OBR] (2023) Economic and fiscal outlook – November 2023. https://obr.uk/efo/economic-and-fiscal-outlook-november-2023/
Office of Tax Simplification (2020) Capital Gains Tax review – first report Simplifying by design, presented to UK parliament. https://www.gov.uk/government/publications/ ots-capital-gains-tax-review-simplifying-by-design
Office for National Statistics [ONS] (2022a) ‘Household total wealth in Great Britain: April 2018 to March 2020’, dataset. https://www.ons.gov.uk/peoplepopulationandcommunity/ personalandhouseholdfinances/incomeandwealth/bulletins/totalwealthingreatbritain/ april2018tomarch2020
Office for National Statistics [ONS] (2022b) ‘Economic activity status, England and Wales: Census 2021’, dataset. https://www.ons.gov.uk/employmentandlabourmarket/ peopleinwork/employmentandemployeetypes/ bulletins/economicactivitystatusenglandandwales/census2021
Office for National Statistics [ONS] (2023a) ‘Inflation and price indices’, dataset. https://www.ons.gov.uk/economy/inflationandpriceindices
Office for National Statistics [ONS] (2023b) ‘Population estimates, NOMIS’, dataset. https://www.nomisweb.co.uk/sources/pest
Office for National Statistics [ONS] (2023c) ‘Population projections, NOMIS’, dataset. https://www.nomisweb.co.uk/sources/pest
Office for National Statistics [ONS] (2023d) ‘Annual population survey, NOMIS’, dataset. https://www.nomisweb.co.uk/sources/aps
34 IPPR North | State of the North 2024 Charting the course for a decade of renewal
Office for National Statistics [ONS] (2023e) ‘Business Register and Employment Survey, NOMIS’, dataset. https://www.nomisweb.co.uk/sources/bres
Office for National Statistics [ONS] (2023f) ‘Annual Survey of Hours and Earnings, NOMIS’, dataset. https://www.nomisweb.co.uk/sources/ashe
Office for National Statistics [ONS] (2023g) ‘Healthy state life expectancy, all ages, UK’, dataset. https://www.ons.gov.uk/peoplepopulationandcommunity/healthandsocialcare/ healthandlifeexpectancies/datasets/healthstatelifeexpectancyallagesuk
Office for National Statistics [ONS] (2023h) ‘General health, age-standardised proportions, Census 2021’, dataset. https://www.ons.gov.uk/datasets/TS037ASP/editions/2021/versions/1
Patel P and Quilter-Pinner H (2022) Road to renewal: Elections, parties and the case for renewing democracy, IPPR, http://www.ippr.org/publications/road-to-renewal.
Patriotic Millionaires UK (2023) ‘New Poll: Wealthiest 6 percent of Brits support a wealth tax’, Patriotic Millionaires UK and Survation, news article. https://patrioticmillionaires.uk/ latest-news/new-poll-wealthiest-6-percent-of-brits-support-a-wealth-tax
Quilter-Pinner H, Statham R, Jennings W and Valgarðsson V (2021) Trust issues: Dealing with distrust in politics, IPPR. http://www.ippr.org/research/publications/trust-issues
Raikes L (2017) The state of the North 2017: The millennial powerhouse, IPPR North.
https://www.ippr.org/articles/state-of-the-north-2017
Raikes L (2019) Power and Prosperity: A strategy for the North to take control of its economy, IPPR North. https://www.ippr.org/articles/power-and-prosperity
Raikes L (2020) The devolution parliament: Devolving power to England’s regions, towns and cities, IPPR North. http://www.ippr.org/research/publications/the-devolutionparliament
Raikes L, Giovannini A, and Getzel B (2019) Divided and connected: Regional inequalities in the North, the UK and the developed world – State of the North 2019, IPPR North.
https://www.ippr.org/articles/state-of-the-north-2019
Raikes L, Giovannini A, and Getzel B (2019) Divided and connected: Regional inequalities in the North, the UK and the developed world – State of the North 2019, IPPR North.
https://www.ippr.org/articles/state-of-the-north-2019
Raikes L, Millward L, and Longlands S (2018) State of the North 2018: Reprioritising the Northern Powerhouse, IPPR North. https://www.ippr.org/articles/state-of-the-north-2018
Rallings C, Thrasher M, and Denver D (2024) ‘Estimates of the 2019 general election result in new constituencies’, on behalf of BBC News, ITV News, Sky News and the Press Association, news article. https://interactive.news.sky.com/2024/doc/estimates-2019general-election-result-new-constituencies-explainer.pdf
Royal Society of Arts [RSA] (2020) ‘English towns need levelling-up with cities on devolution’, press release. https://www.thersa.org/press/releases/2019/rsa-english-towns-needlevelling-up-with-cities-on-devolution
Smith F (2023) ‘Three quarters of Britons support wealth taxes on millionaires’, YouGov, news article. https://yougov.co.uk/politics/articles/45044-three-quarters-britons-supportwealth-taxes-millio
Stansbury A, Turner D and Balls E (2023) Tackling the UK’s regional economic inequality: Binding constraints and avenues for policy intervention, M-RCBG Associate Working Paper, Series 2023.198, Harvard University. https://nrs.harvard.edu/URN-3:HUL. INSTREPOS:37374470
Tax Justice UK (2021) ‘Ultra wealthy Londoners’ unfair tax windfall revealed’, blog. https://www.taxjustice.uk/blog/ultra-wealthy-londoners-unfair-tax-windfall-revealed Thomas C, Round A, and Longlands S (2020) Levelling up for health and prosperity, IPPR North. https://www.ippr.org/articles/levelling-up-health-for-prosperity
Travers T (2023) ‘Local government’, in UK in a Changing Europe (2023) The state of public opinion: 2023, pp 12-14. https://ukandeu.ac.uk/wp-content/uploads/2023/11/UKICEThe-State-of-Public-Opinion-2023.pdf
Van der Erve L, Krutikova S, Macmillan L, and Sturrock D (2023) Intergenerational mobility in the UK, Institute for Fiscal Studies. https://ifs.org.uk/inequality/intergenerationalmobility-in-the-uk/
IPPR North | State of the North 2024 Charting the course for a decade of renewal 35
Webb J, Johns M, Roscoe E, Giovannini A, Qureshi A, and Baldini R (2022) State of the North 2021/22: Powering northern excellence, IPPR North. https://www.ippr.org/articles/stateof-the-north-2021-22-powering-northern-excellence
Westwood A, Anderson J, and Austin J (2023) ‘IRA, ARP, IIJA & Chips - Letters from America. What Labour can learn from the US about industrial strategy’, IPPR Progressive review https://onlinelibrary.wiley.com/doi/epdf/10.1111/newe.12363
Woolley P (2024) ‘Four in ten councils at risk of financial failure over next five years’, Grant Thornton, press release.
https://www.grantthornton.co.uk/news-centre/four-in-tencouncils-at-risk-of-financial-failure-over-next-five-years
YouGov (2024) ‘YouGov MRP shows Labour would win 1997-style landslide if election were held today’, dataset. https://yougov.co.uk/politics/articles/48371-yougov-mrp-showslabour-would-win-1997-style-landslide-if-election-were-held-today
36 IPPR North | State of the North 2024 Charting the course for a decade of renewal
ANNEX 1: METHODOLOGY
1. TREND ANALYSES
This report draws on historic trends and future forecasts, reviewing regional inequalities this decade. We present methods for doing so here.
1.1. Wealth per head 2010-2030
In projecting wealth, the component categories of wealth (property, financial, physical, and pension wealth) each receive their own trend analysis before being aggregated into a total estimate per head.
• Property wealth is assumed to grow in line with the OBR’s (2023) house price forecast.
• Financial and physical wealth are assumed to grow in line with OBR’s (2023) Real GDP forecast.
• Private pension wealth is assumed to grow in line with the average annual growth rate of private pension wealth during the current methodological period of ONS (2022a) wealth and assets data.
All figures are real, in 2023 prices, converted using ONS CPI indices (2023a) for 20082023 and OBR’s (2023) projections for 2023 onwards. Note that the ONS uses CPIH for wealth data, but CPIH is not currently projected, so we have used CPI in lieu.
1.2. Share of total public spending accruals spent by local government 2009/10-2032/33
For the share of total spending accruals spent by local government, we only project forward the 10-year trend to 2022/23 as recorded by HMT (2023b). We exclude 2020/21 from calculating the trend due to significant and short-term changes to the public sector spending profile during the pandemic’s height. This trend reflects the trajectory of historic trends.
1.3. Employment rate 2009–2030
To project forward employment, we assume the long-term persistence of regional inequality in employment outcomes found in Johns et al (2020) continues and changes to the relationship between each region’s and the UK’s overall employment rate are demographic and structural. We project forward the 10-year trend to 2023 of each region’s relative position to the UK average employment rate and constrain the OBR’s (2023) employment (16+) rate forecast for the UK to these.
While our preference for employment rate is to use the working aged population (16-64), aligning with the OBR’s forecast requires using the same measure, thus we use the figures for 16+.
The final year of the forecast projects forward the average annual growth rate of the period during the OBR forecast where the UK employment rate grows (20262029) to allow for common timeframes across our analysis.
1.4.
Healthy life expectancy 2009–2030
To outline healthy life expectancy’s regional trajectories, we project forward the 2009-11 to 2017-19 trend for healthy life expectancy for both males and females recorded by ONS (2023g). These are combined by weighting the population appropriately. We exclude the 2018-20 period from trend analysis to discount the impact of the Covid-19 pandemic.
IPPR North | State of the North 2024 Charting the course for a decade of renewal 37
2. MARGINAL SEATS 1918-2019
In counting the number of marginal seats by region, we define marginal seats according to the size of the margin between the winner and second-placed candidate in each seat as a percentage of valid votes cast (their majority) as:
• semi-marginal if the majority accounts for between 5 and 10 per cent
• marginal if the majority accounts for 5 to 1 per cent
• ultra-marginal if the majority accounts for below 1 per cent.
3. LOCALLY CONTROLLED SPENDING POWER PER HEAD 2009/10 – 2022/23
We estimate changing local spending power by analysing DLUHC (2023) expenditure and financing 2009/10 and 2023/23 data. We estimate local government’s total sources of revenue over which they have levers of control. Principally, that means central government grants, council tax incomes, and business rate incomes where retention schemes are in place. We exclude school and police grants that pass through local authorities, but over which they have little control. We do not consider reserves or borrowing; local authorities cannot borrow for revenue spending.
To allow for comparison over time, we impute values for public health grants in 2009, deflating 2013/14 figures and accounting for population change (similarly to Arnold & Stirling 2019). Public health duties transferred to local authorities from 2013/14 from the then local NHS Primary Care Trusts.
We account for local government reorganisation and estimate 2009 values for changed local authorities to 2023, assigning revenues of former authorities according to population. Several authorities did not provide data to DLUHC, and we exclude them from our calculations.
We estimate spending per head for district, county, unitary, metropolitan borough, and combined authorities, excluding bodies like police & crime commissioners, fire authorities, and national park authorities. In assigning total locally controlled spending power to district level for visualisation, we assign per person revenues of all higher tier authorities (such as counties and combined authorities) to component district/unitary areas.
Our analysis is in real terms 2023 prices using GDP deflator figures (HMT 2023), before we calculate per head spending changes.
4. JOB QUALITY AND OPPORTUNITY INDEX
Locally authority areas have been scored according to four domains, containing 13 indicators. Within each domain, local authority areas were ranked. These ranks were combined to create an overall rank of ranks for each local authority areas, before dividing local authority areas into deciles which are mapped in the report.
Due to data availability we have excluded Na h-Eileanan Siar, the Shetland Islands, Orkney Islands, and the Isles of Scilly local authority areas. The City of London has also been excluded due to its exclusion from datasets upon which the index relies due to statistical unreliability.
Where data was absent for other local authorities for discrete indicators (but not consistently absent), we have imputed the value using the average for the next available larger geography. A smaller number of local authority areas have been reorganised impacting time series data, and we have taken a similar approach for those.
38 IPPR North | State of the North 2024 Charting the course for a decade of renewal
TABLE A.1: JOB QUALITY INDICATORS
Domain Indicator Direction indicating good Source
Median weekly pay Higher ONS 2023d
Real terms wage growth (2013 – 2023) Higher ONS 2023d, 2023e
Good pay
Security of work and hours
Weekly pay at 10th percentile Higher ONS 2023d
Proportion of workers in low pay Lower ONS 2022
Proportion of workers with satisfactory hours Higher ONS 2022
Proportion of workers with desired contract Higher ONS 2022
Proportion of workers opportunities for career progression Higher ONS 2022
Proportion of workers with good employee involvement Higher ONS 2022
Proportion of workers with zero hours contracts Lower ONS 2022
Jobs density
Access to jobs
Strong workforce qualifications
Higher ONS 2023b, 2023c
Employment rate (16 – 64 year olds) Higher ONS 2023c
Proportion of labour force (16 – 64) with no qualifications Lower ONS 2023c
Proportion of labour force (16 – 64) with degree-level education or better (RFQ4+) Higher ONS 2023c
Source: Authors’ analysis
5. HEALTHY, PROSPEROUS PLACES INDEX
To indicate healthy and prosperous places, we used Census (2021) data on the proportion of people (age standardised) reporting bad or very bad health and the proportion of people economically inactive, as a proxy for participation in the economy. Local authority areas are scored for their relative performance in these two attributes which are then combined into an overall index.
IPPR North | State of the North 2024 Charting the course for a decade of renewal 39
ANNEX 2: TREND SUMMARIES
Note: ^excludes 2020/21, *excludes 2018/20,**projection curtailed to 2030 (seven years) to align with underlying OBR projections
Source: Authors’ analysis
40 IPPR North | State of the North 2024 Charting the course for a decade of renewal
TABLE A.2: SUMMARIES OF EACH INDICATOR’S
Baseline Projection Indicator Region Start year Result Current year (last available data) Result Baseline change End year Result Projected change Total change over period Wealth per head (£, 2023 prices) North 2010 £189100 2020 £219800 16.2% 2030 £284000 29.2% 50.2% Wealth per head (£, 2023 prices) England 2010 £226300 2020 £290800 28.5% 2030 £360300 23.9% 59.2% Share of total public spending spent by local government North 2013/14 26.8% 2022/23^ 20.6% -6.24 percentage points 2032/33 12.7% -7.86 percentage points -0.14 percentage points Share of total public spending spent by local government England 2013/14 28.7% 2022/23^ 20.6% -8.04 percentage points 2032/33 12.9% -7.71 percentage points -0.16 percentage points Employment rate (% of aged 16+) North 2013 55.9% 2023 58.3% 2.48 percentage points 2030** 58.5% 0.12 percentage points 0.03 percentage points Employment rate (% of aged 16+) England 2013 58.4% 2023 61.0% 2.63 percentage points 2030** 61.2% 0.14 percentage points 0.03 percentage points Healthy life expectancy (weighted by sex) North 2009/11 61.1 years 2017/19* 61.33 years 84.8 days 2028/30 61.87 years 196.5 days 281.3 days Healthy life expectancy (weighted by sex) England 2009/11 63.56 years 2017/19* 63.35 years -75.5 days 2028/30 63.38 years 8.1 days -67.4 days
TREND
GET IN TOUCH
For more information about IPPR North, please go to www.ippr.org/north
You can also e-mail info@ippr.org or find us on X at @ipprnorth
Institute for Public Policy Research
Registered Charity no. 800065 (England & Wales), SC046557 (Scotland), Company no, 2292601 (England & Wales)
