FAIRER TAXES, SMARTER SPENDING
Pranesh Narayanan
September 2023
Institute
for Public Policy Research
A RECIPE FOR SUSTAINABLE GROWTH
ABOUT IPPR
IPPR, the Institute for Public Policy Research, is an independent charity working towards a fairer, greener, and more prosperous society. We are researchers, communicators, and policy experts creating tangible progressive change, and turning bold ideas into common sense realities. Working across the UK, IPPR, IPPR North, and IPPR Scotland are deeply connected to the people of our nations and regions, and the issues our communities face. We have helped shape national conversations and progressive policy change for more than 30 years. From making the early case for the minimum wage and tackling regional inequality, to proposing a windfall tax on energy companies, IPPR’s research and policy work has put forward practical solutions for the crises facing society.
IPPR
8 Storey's Gate London
SW1P 3AY
E: info@ippr.org
www.ippr.org
Registered charity no: 800065 (England and Wales), SC046557 (Scotland)
This paper was first published in September 2023. © IPPR 2023
The contents and opinions expressed in this paper are those of the authors only.
ABOUT THE AUTHOR
Pranesh Narayanan is a research fellow at IPPR.
ACKNOWLEDGEMENTS
The author would like to thank George Dibb, Henry Parkes, Harry Quilter-Pinner, and Carys Roberts for their feedback on this paper, and Abi Hynes for copyediting.
This work is part of an IPPR programme advocating for fairer taxation, generously supported by Friends Provident Foundation.

Download
This document is available to download as a free PDF and in other formats at: http://www.ippr.org/publications/fairer-taxes-smarter-spending
Citation
If you are using this document in your own writing, our preferred citation is: Narayanan P (2023) Fairer taxes, smarter spending: A recipe for sustainable growth, IPPR. http://www.ippr.org/publications/fairer-taxes-smarter-spending
Permission to share
This document is published under a creative commons licence: Attribution-NonCommercial-NoDerivs 2.0 UK http://creativecommons.org/licenses/by-nc-nd/2.0/uk/ For commercial use, please contact info@ippr.org
SUMMARY
The UK economy has much bigger problems than high levels of tax. Rising long-term sickness is impacting labour supply, whilst the education and health systems are struggling with recruitment and staff capacity. Public infrastructure is quite literally crumbling. The UK is particularly vulnerable to high energy prices due to a highly energy inefficient building stock and an outsized reliance on natural gas for heating. The government needs more tax revenues to tackle societal challenges such as climate change and the aging population while simultaneously delivering growth.
‘Record’ levels of tax are unremarkable internationally. The OBR has projected that UK tax levels will reach a ‘post-war high’ in 2027/28. Anti-tax campaigners have been using this as evidence to call for tax cuts. Yet this ‘record’ would put the UK in the middle of the pack relative to other OECD economies. Historically, the UK has been well below the OECD average. Advanced economies have increased their tax levels steadily since the 1960s; the UK is an outlier – in the sense that our tax levels have not increased gradually over time.
Rising tax levels can enable better living standards. Many advanced economies such as Germany, Denmark and France have higher average disposable incomes than the UK while also having higher tax levels. Claims that tax will hold back growth miss the point that not all economic growth improves living standards for the average household. The UK has experienced economic growth since the financial crisis without experiencing wage growth, leaving many working households no better off. During the same period, many European countries had higher real wage growth and higher tax levels.
Smart public spending is needed to achieve sustainable growth. Even if economic growth is the primary objective, the barriers to growth are more likely to be addressed by higher spending in priority areas rather than through lower taxes. The IMF, generally a fiscally cautious organisation, has echoed recommendations from IPPR and other progressive organisations to increase spending in health, education, and net zero to boost growth and long-term prosperity
Taxes can be raised in a fairer way to enable smart spending. Higher corporation tax combined with generous investment allowances are a sensible policy, generating more revenue whilst encouraging investment. However, frozen income tax and national insurance thresholds mean lower- and middle-income workers pay a higher share of their earnings in additional taxes compared to those on the highest incomes. At the same time, wealth and assets remain undertaxed despite several viable and popular policy options to address this. Wealth and property taxes could raise revenues without worsening the cost of living for those most impacted by inflation in the short-term.
Voters support higher taxes if they are linked to spending on services. Despite the pressures of the cost-of-living crisis, 55 per cent of British people support an increase in taxes to fund higher spending in health, education, and social benefits. 63 per cent of voters believe that the wealthy are under-taxed in the UK, and 55 per cent support higher capital gains tax.
3 IPPR | Fairer taxes, smarter spending: A recipe for sustainable growth
1. INTRODUCTION
The UK economy – indeed, the global economy – has been battered by crises over recent years. The government has embarked on some of the largest crisis support programmes in post-war history with interventions such as the furlough scheme and the Energy Price Guarantee during the pandemic and the energy crisis sparked by Russia’s invasion of Ukraine. These interventions have also sparked another post-war record. The tax level –the ratio of government tax receipts to Gross Domestic Product (GDP) – is also set to increase above post-war levels for the first time, according to the Office for Budget Responsibility’s (OBR) last forecast.
The narrative around this fact has been disproportionately negative, not just from the Conservative party but also from the Labour party. It is often referred to as the ‘tax burden’, a label that immediately puts a weighty, negative frame on what is a relatively superficial statistic.
A small number of anti-tax campaigners are vocal about this issue, but their arguments are highly flawed (Seargeant 2023; Taxpayers' Alliance 2022). It is commonly argued that:
• record levels of tax as a proportion of GDP show that taxes are ‘too high’
• government gets in the way of economic growth
• higher levels of tax erode disposable incomes
• taxes on working people are inevitable
• voters view taxes as a ‘burden’.
However, in this briefing we argue that these concerns are misconceived and confront these arguments one-by-one.
Any claim that tax levels are ‘too high’ due to reaching some arbitrary threshold (in this case, the level of taxation immediately following World War 2) are highly reductive. There is no optimal tax level – instead the judgement around whether taxes are ‘too high’ or ‘too low’ is ultimately a political choice.
Ailing public services, the climate crisis, and a strong desire from the electorate for a more secure economic future – these are the issues that political leaders must tackle head on with bold action and political imagination. This means an honest and clear understanding of the public finances, and how this interacts with economic growth. This paper discusses the impacts of changing tax levels, how these compare internationally and why higher levels are needed to meet the challenges of our time.
4 IPPR | Fairer taxes, smarter spending: A recipe for sustainable growth
2. CONTEXT
INFLATION BITES THE GOVERNMENT AS WELL
The ratio of tax revenues to GDP is projected to increase to 37.7 per cent by 2027/28, a 'post-war high'. In simple terms, tax receipts are expected to grow faster than the economy for the next few years, meaning the government’s revenue will be higher relative to the size of the UK economy. At the same time, public spending as a proportion of GDP is projected to settle at 43 per cent in 2027/28, a 3.9 percentage point increase relative to 2019/20 (OBR 2023a). This is driven by the Treasury's response to a very challenging economic and fiscal landscape.
The UK government spent between £310 billion and £410 billion responding to the pandemic, an estimated £40bn supporting households and businesses’ energy bills through the winter between 2022 and 2023, and further billions on other cost-of-living support schemes (Brien and Keep 2023; DESNZ 2023). This increase in government debt was followed by a large increase in borrowing costs due to inflation. Inflation also means that the cost of providing public services and welfare support have increased substantially. Meanwhile, GDP growth is expected to be low to due to supply-side constraints such as rising labour market inactivity and permanently higher energy costs.
Over half of the projected increase in spending by 2027/28 (2 percentage points) is driven by higher borrowing costs, while inflation-linked spending items also contribute a substantial amount. In the 2022 autumn statement, the Treasury committed extra funding for the NHS and schools until the end of the current spending review period (2024/25) but this extra budget will mostly be swallowed by inflation. Other parts of the health and education systems are likely to see real terms spending cuts (Boccarini 2023; IFS 2022). These increases were offset by cuts to international aid spending and a commitment to grow government spending more slowly in later years of the forecast (OBR 2022).
The ONS’ recent upwards revisions to UK GDP and growth during the pandemic are unlikely to have a major impact on these projected ratios – the headline 2 per cent increase in the size of the UK economy in 2021 would only reduce the 2027-28 tax and spending level by around 0.2 percentage points if the OBR’s March 2023 tax receipts and government spending forecasts were accurate (ONS 2023a). 1 However, recent data suggests tax receipts are likely to be slightly higher than expected, suggesting that the projected tax level would not be impacted significantly by the revisions.
1 Author’s analysis – this result was obtained by adjusting the March 2023 GDP forecast for the historic revisions to nominal GDP in 2021/22, while leaving the total managed expenditure and national accounts tax receipts forecasts unchanged.
5 IPPR | Fairer taxes, smarter spending: A recipe for sustainable growth
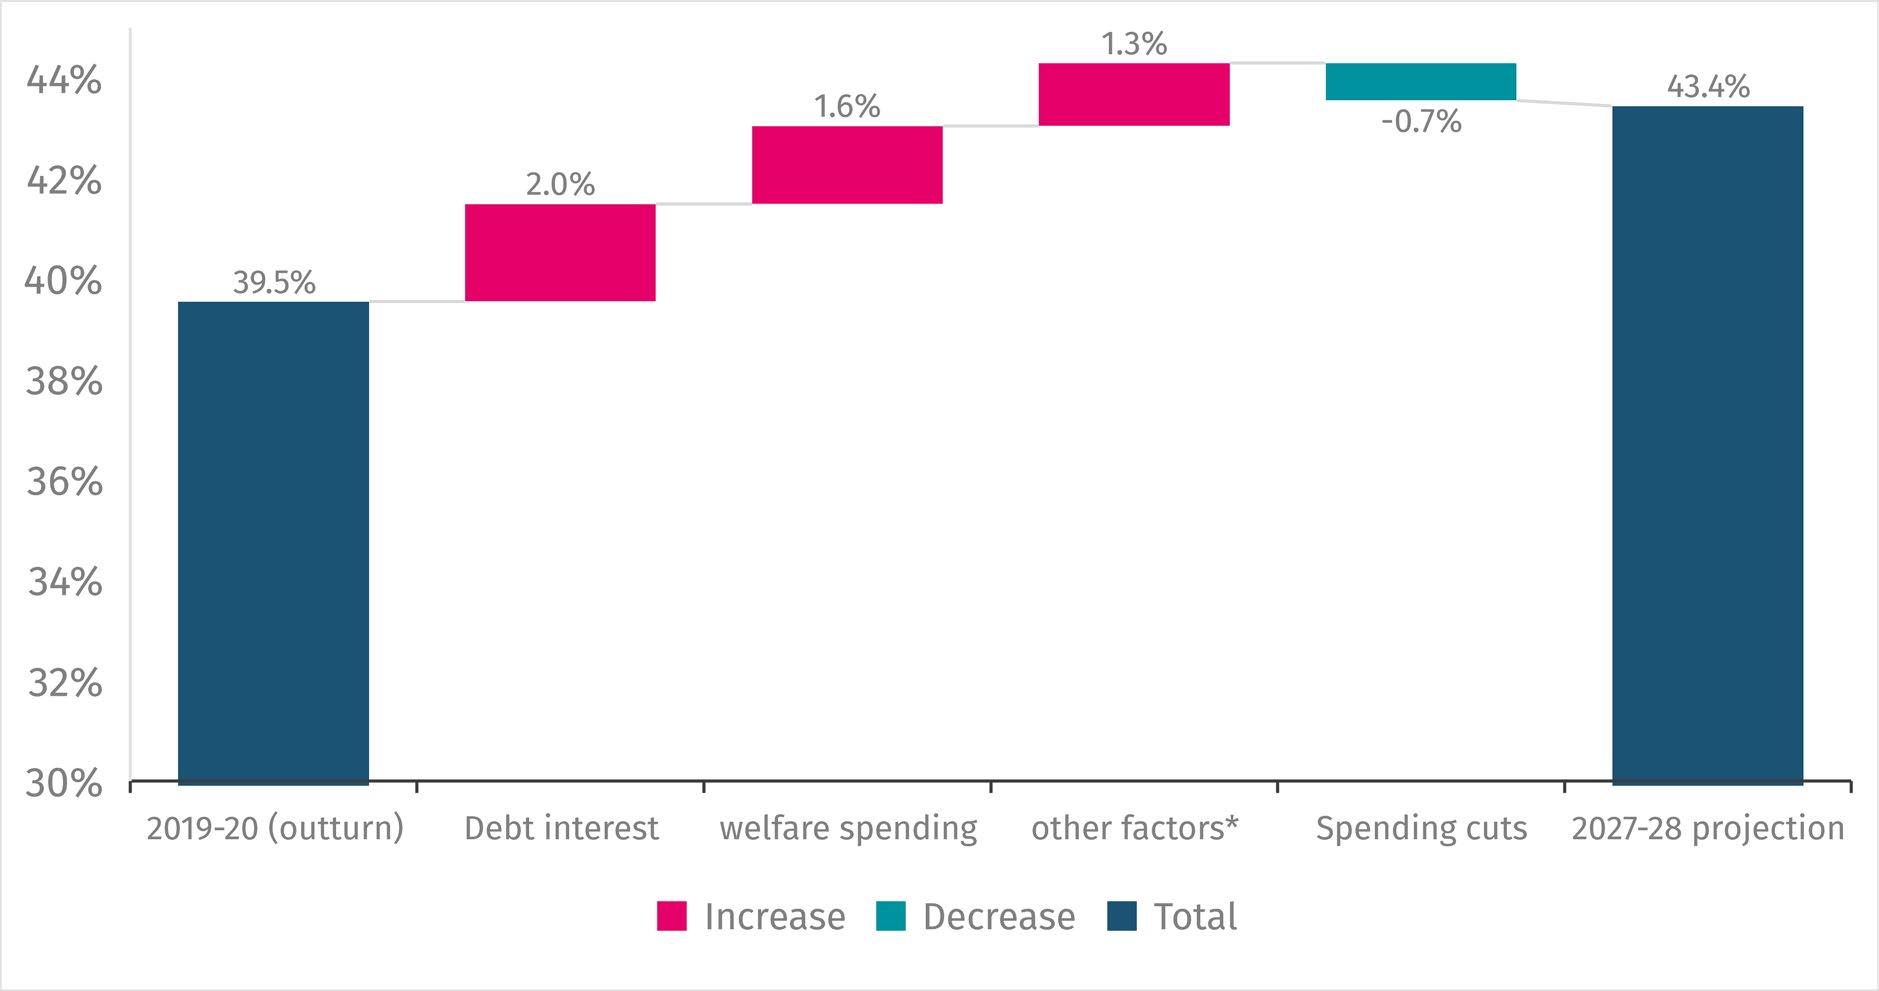
FIGURE
2.1: INFLATION AND BORROWING COSTS ARE DRIVING UP GOVERNMENT SPENDING
Factorscontributingtotheriseinpublicspending-to-GDPratiobetween2019/20andthe 2027/28projection
Source: IPPR analysis of OBR 2023a; *‘other factors’ refers to inflation-linked spending items not related to welfare and other cash items that are not sensitive to movements in GDP (meaning that the lower GDP forecast relative to 2019 increases these items’ share of GDP in the current forecast).
THE TREASURY HAS RESPONDED BY RAISING REVENUES
Successive chancellors and the Treasury have responded to these pressures by raising additional revenue through the two major tax policies.
First, income tax thresholds have been frozen until 2027/28. This causes ‘fiscal drag’ to take place, where wage growth leads to higher income tax bills and national insurance contributions (NICs) relative to a world in which thresholds are not frozen. Taken together, this contributes over half of the projected increase (2.5 out of the 4.7 percentage point increase).
Second, the main rate of corporation tax was increased to 25 per cent – this contributes 1.7 percentage points to the 4.7, even after accounting for the very generous 100 per cent full-expensing capital allowance introduced in March 2023.
6 IPPR | Fairer taxes, smarter spending: A recipe for sustainable growth
FIGURE 2.2: INCOME TAX AND CORPORATION TAX ARE THE MAIN DRIVERS OF RISING TAX LEVELS
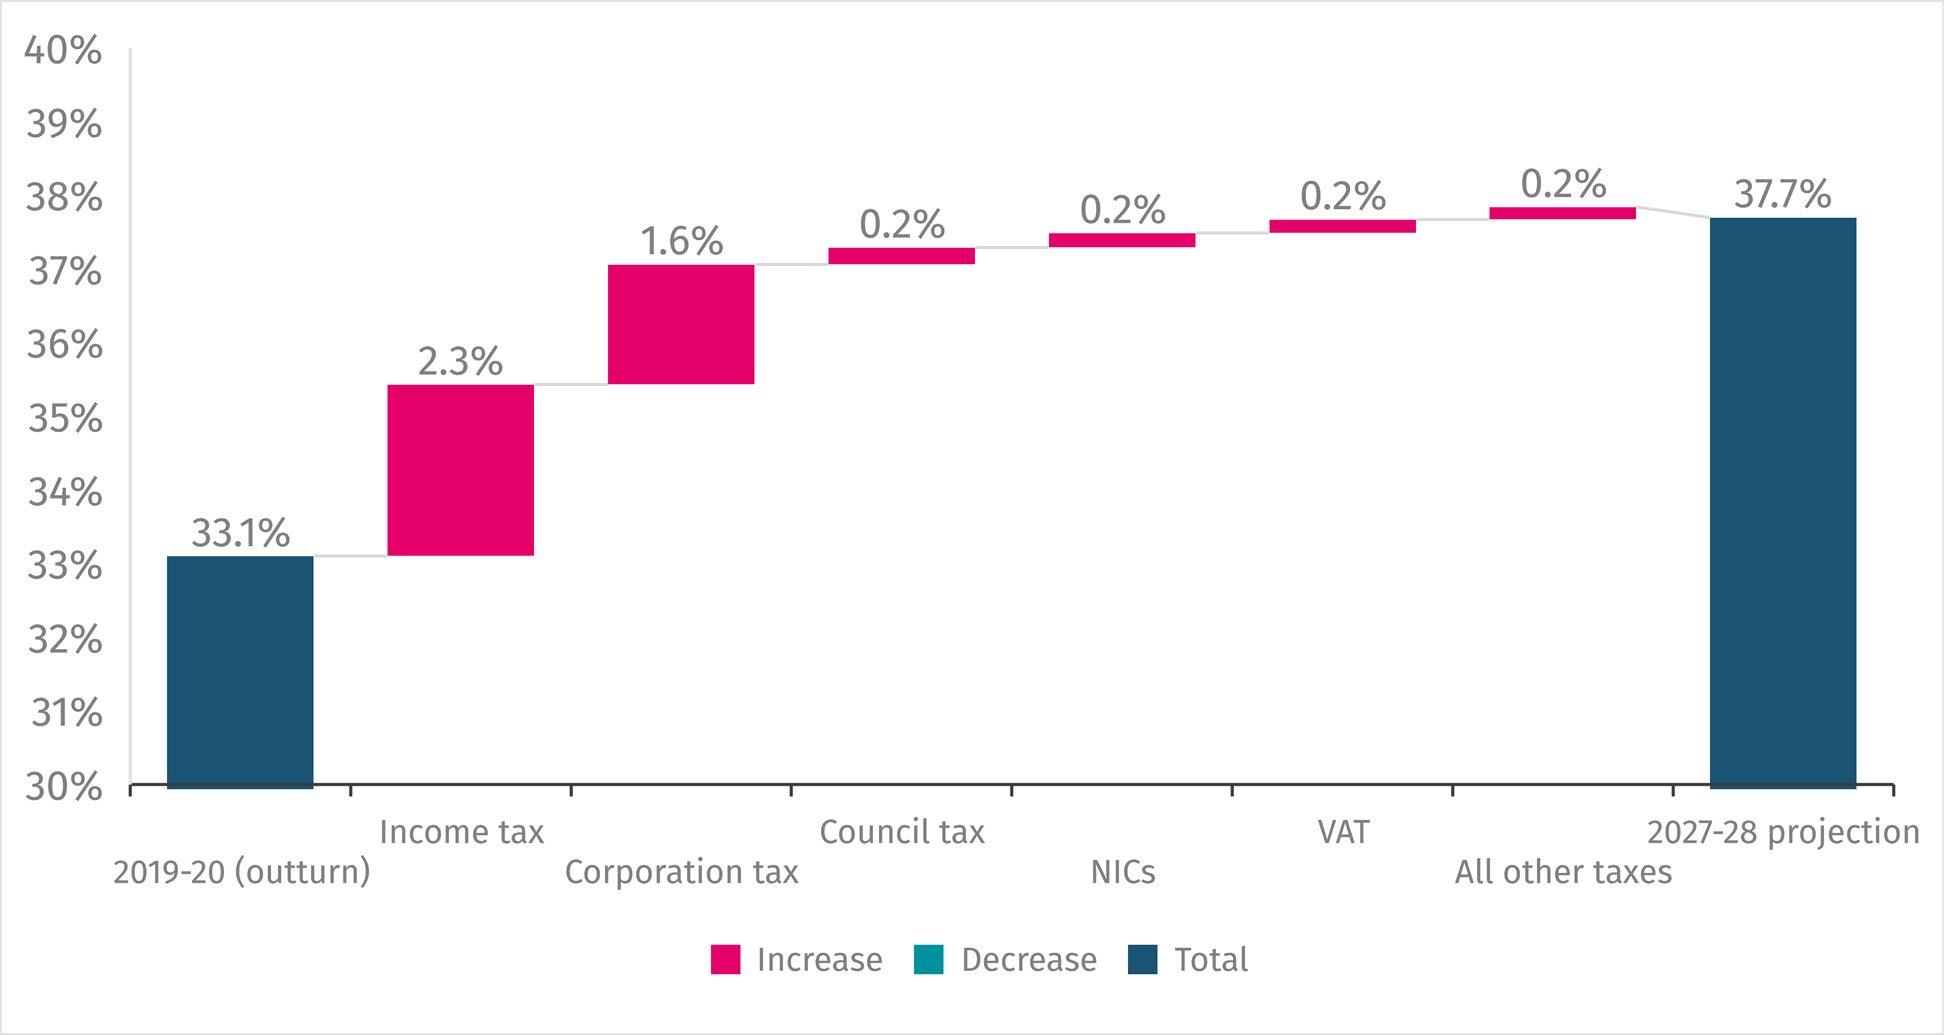
Factorscontributingtotheriseintax-to-GDPratiobetween2019-20andthe2027-28 projection
Anti-tax campaigners are concerned that these policies will harm economic growth by dampening incentives to work and invest. They argue that cutting taxes is the only way to ensure that households’ disposable income can grow (Taxpayers’ alliance, 2022). However, comparing the UK to other advanced economies reveals that these concerns are largely misplaced. Many advanced economies have achieved much better growth in living standards with higher levels of tax than the UK.
Some of the key barriers to growth in the UK today are not driven by tax but rather by structural issues such as rising long-term sickness among the workforce (Thomas et al 2023), skills shortages (CBI Economics 2022), an energy sector that is over-reliant on natural gas imports and a highly energy-inefficient building stock (Hodgkin and Sasse 2022). These problems cannot be tackled by the private sector alone, and in some cases (such as the NHS) can only be tackled by the government.
The government should be smart about how its raises additional revenues so that those most able to weather the cost-of-living crisis are asked to contribute the most. Wealthier sections of society, particularly those whose incomes come primarily from assets, are largely protected from the cost-of-living crisis and have preferential rates of tax. A smart tax policy would raise revenue from this section of society without increasing tax on work, which currently brings in half of all tax revenues.
7 IPPR | Fairer taxes, smarter spending: A recipe for sustainable growth
Source: IPPR analysis of OBR 2023a
3. ‘RECORD’ UK TAX LEVELS ARE UNREMARKABLE INTERNATIONALLY
As the last March 2023 OBR report pointed out, the UK has low tax levels compared to most OECD countries. The UK’s OECD-consistent 2 2021 tax level of around 33.5 per cent of GDP puts it below the likes of Portugal, Poland, and Hungary. At the OBR’s OECDconsistent projection for 2027/28 (36.8 per cent), the UK would come slightly higher on the list but well below similar countries such as Belgium and the Netherlands.
FIGURE 3.1: THE PROJECTED POST-WAR HIGH TAX LEVEL LEAVES THE UK MID-TABLE AMONGST COMPARABLE COUNTRIES
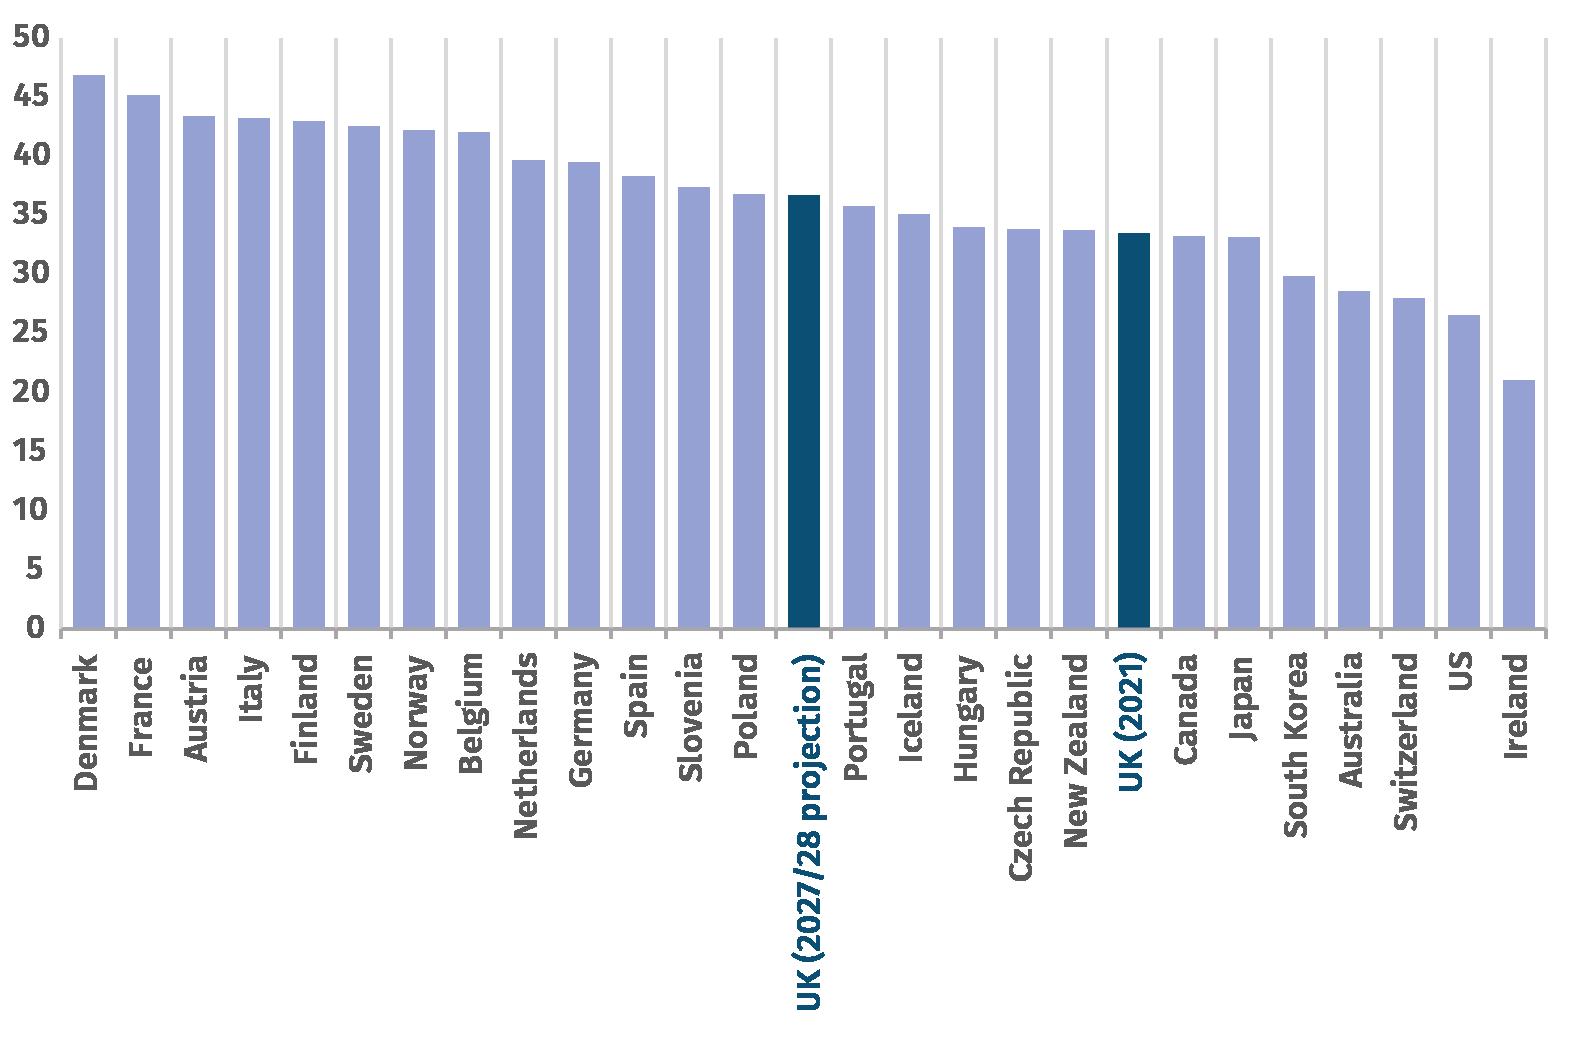
Comparisonoftax-to-GDPratiosforselectedOECDcountries
Source: OBR (2023a)
2 Official ONS estimates of the tax-to-GDP ratio are consistently 1 to 2 percentage points above OECD statistics. The OBR used OECD-consistent figures for their comparison.
8 IPPR | Fairer taxes, smarter spending: A recipe for sustainable growth
In general, other European and G7 countries have taken decisions that have gradually increased tax levels over time to support public services and investment. However, the UK does have a relatively more progressive tax system with most other European countries raising the additional revenues through consumption taxes (equivalent to VAT) and social security contributions (like national insurance) (Conte et al., 2019). The UK could lead the way in progressive ta by considering an increase to taxes on wealth and assets instead.
FIGURE 3.2: UNLIKE THE UK, OTHER COUNTRIES HAVE STEADILY INCREASED THEIR TAX LEVELS OVER TIME
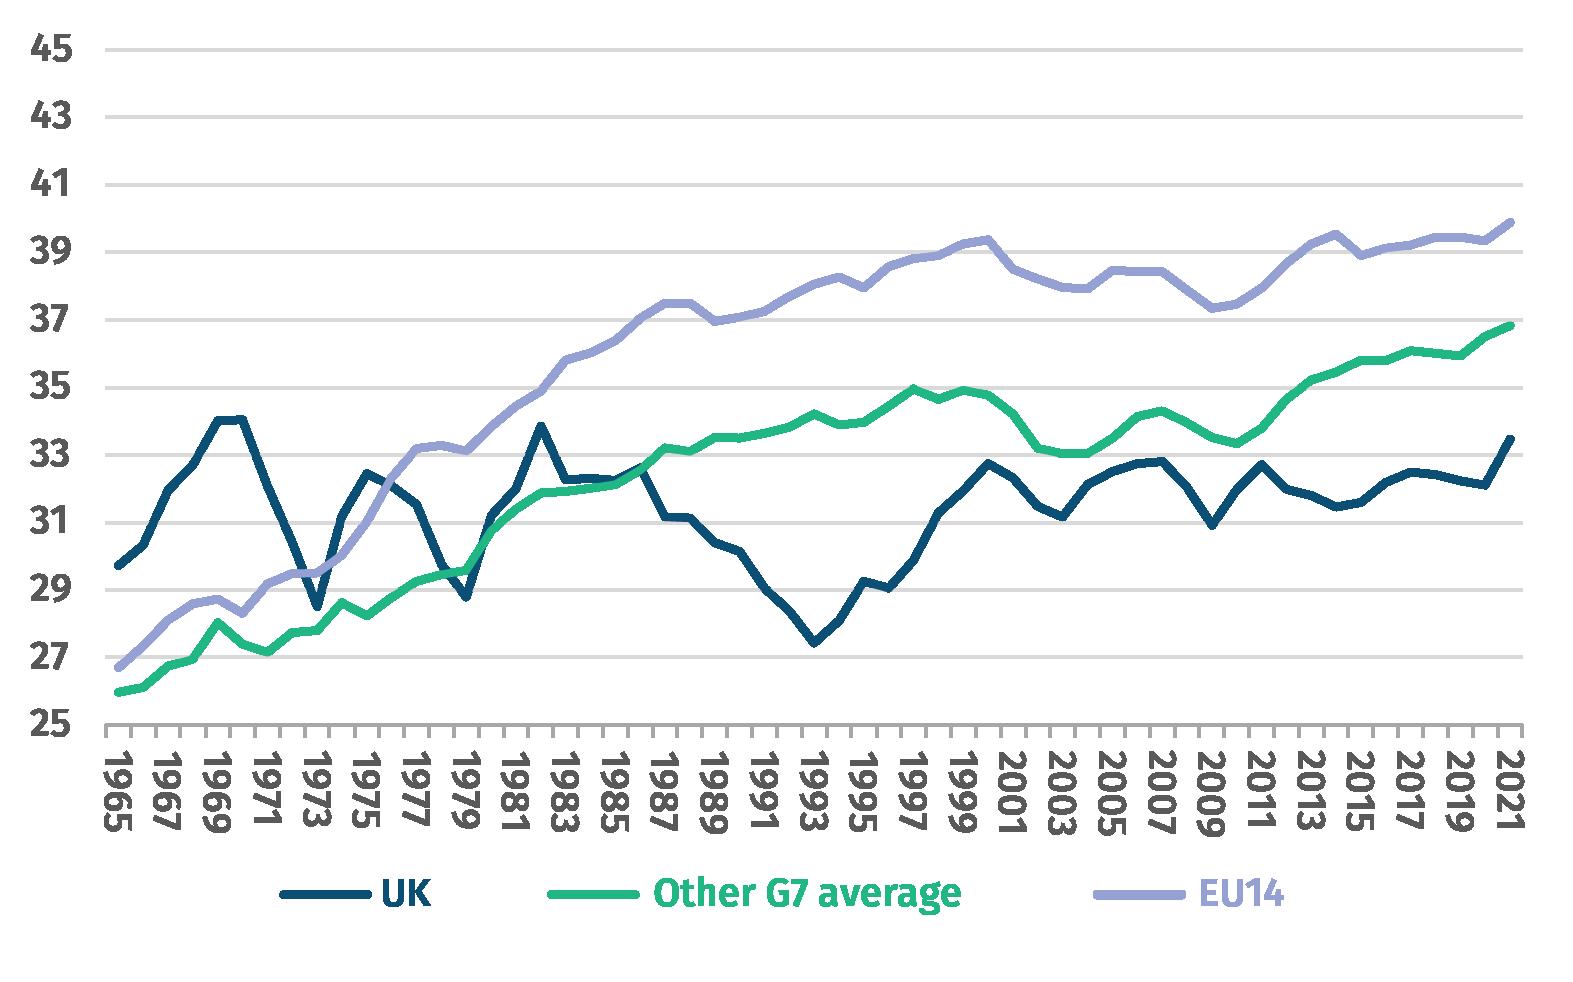
Internationalcomparisonsoftax-to-GDPratiosovertime
Source: OBR 2023a
9 IPPR | Fairer taxes, smarter spending: A recipe for sustainable growth
4. HIGHER TAX CAN BE COMBINED WITH BETTER LIVING STANDARDS
GDP GROWTH IS A NARROW MEASURE FOR PROSPERITY, THE FOCUS SHOULD BE LIVING STANDARDS
Anti-tax campaigners are mainly concerned with the impact of taxes on economic output and growth, measured in terms of GDP and GDP growth. The focus on GDP growth is justified on the basis that growing output has historically resulted in higher living standards. However, GDP does not tell the full story on living standards in our modern economy (Colebrook, 2018). GDP growth driven by productivity gains is traditionally the route to higher living standards, through higher wages and purchasing power for households. However, UK GDP has grown despite stagnant productivity for the last decade. Some recent research even finds that the link between productivity growth and wages is growing weaker (van Reenen and Teichgraber 2021).
Many alternative indicators could be used to measure economic prosperity, but one that is closely felt by most households are wages – especially during the cost-of-living crisis. For most people, wages are the largest source of income When real wages increase, lower- and middle-income households see their purchasing power increase – a direct improvement to their living standards.
OVERALL TAX LEVELS HAVE LITTLE CONNECTION TO GROWING LIVING STANDARDS IN ADVANCED ECONOMIES
Average disposable incomes per person, once adjusted for inflation and benefits provided to citizens by government (such as public services or welfare payments), are larger in many countries with higher tax levels. Denmark, Germany and France, amongst others, have higher disposable incomes than the UK despite already having tax levels above the UK’s projected ‘post-war record’ of 37.7 per cent (OECD 2023b).
In recent years, tax levels have not had a significant relationship with real wage growth. Many countries with a higher average tax level between 2010 and 2019 also saw higher growth in real wages over that period. Some countries with lower tax levels also saw lower wage growth. This goes against the long-standing myth that high or rising tax levels harm or hold back the economy. Free marketeers often argue that taxes discourage economic activity and growth, as individuals earn less money or businesses make less profits. However, this completely ignores the positive impact of public spending.
10 IPPR | Fairer taxes, smarter spending: A recipe for sustainable growth
If additional tax revenues enable government to spend more on public services or infrastructure investments, the public will have greater access to things such as healthcare and education, and businesses will have a more productive workforce and easier access to markets. These are all essentials for a growing economy.
FIGURE 4.1: MANY COUNTRIES WITH HIGHER OVERALL TAX LEVELS ALSO SAW MUCH HIGHER GROWTH IN REAL WAGES BETWEEN 2010 AND 2019
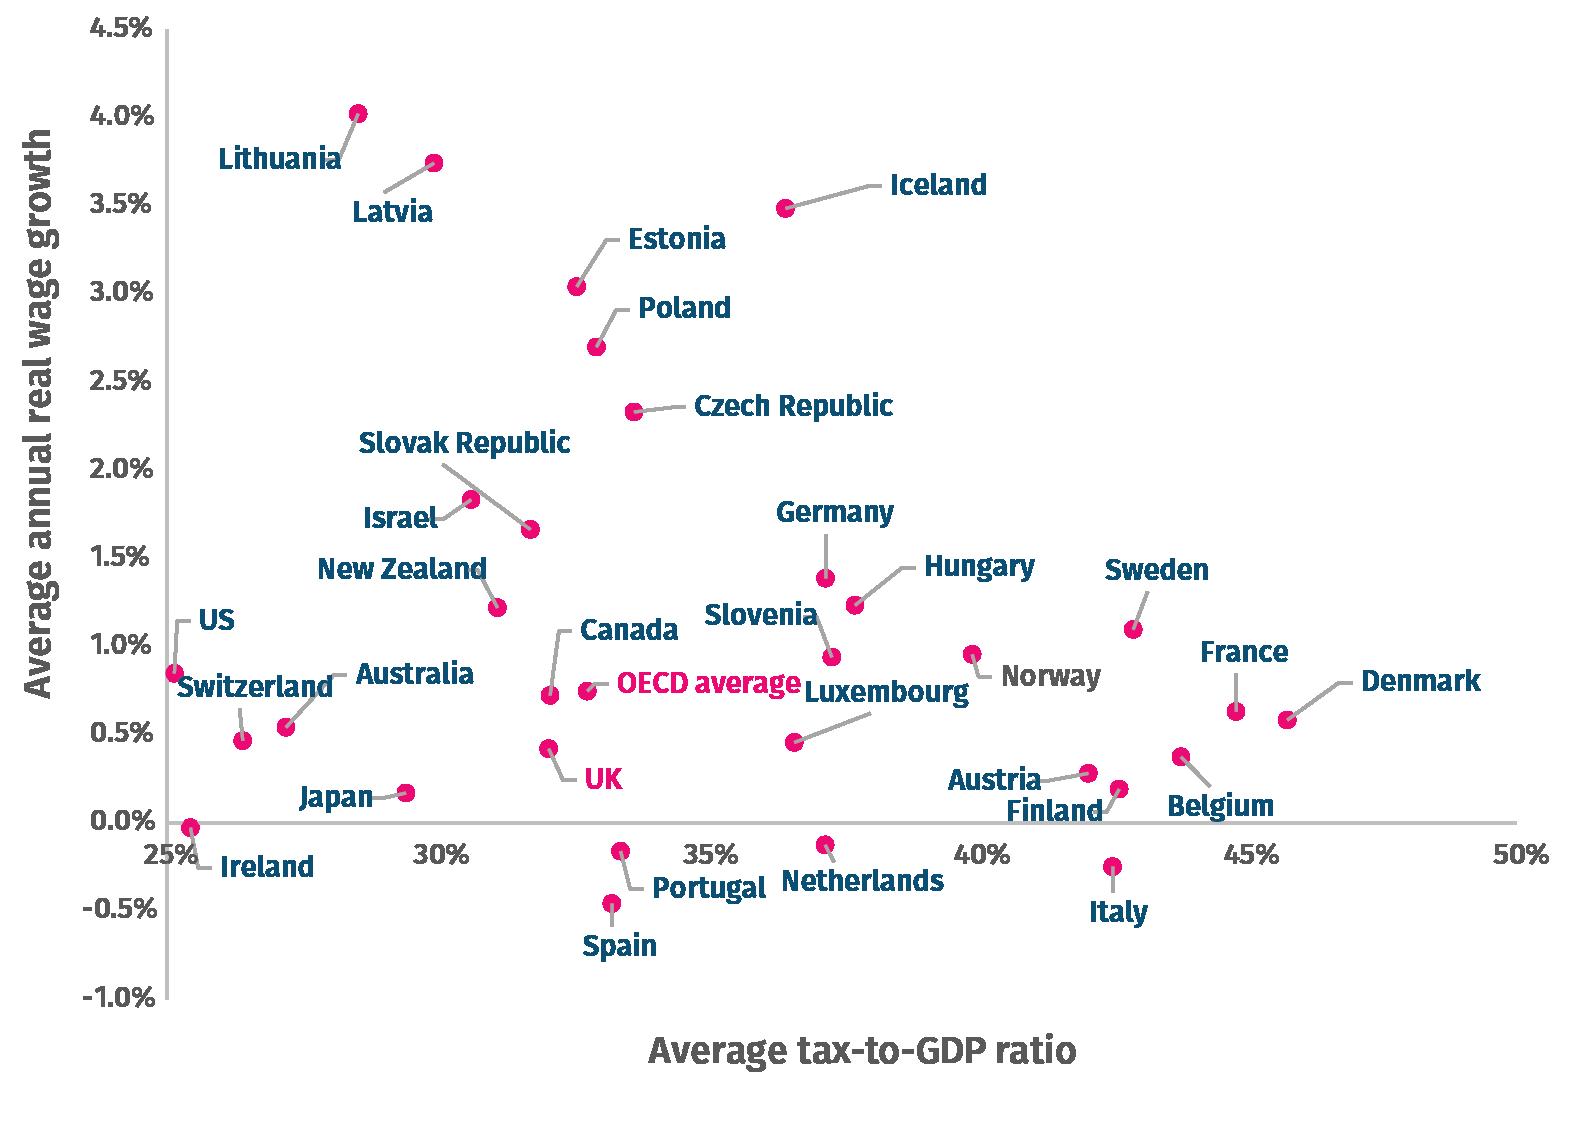
Comparisonofrealwagegrowthtotaxlevels,allvaluesaretheaveragefrom2010to2019
Source: Author’s analysis of OECD 2023a and OECD 2023b
11 IPPR | Fairer taxes, smarter spending: A recipe for sustainable growth
5. SMART PUBLIC SPENDING LEADS TO SUSTAINABLE GROWTH
Economic growth has become a political priority across the spectrum, with both the Conservatives and Labour making commitments to improve UK growth in the coming years. Whilst this is an imperfect measure of economic success, smarter public spending could deliver the kind of economic growth that does improve living standards for working people.
Liz Truss’ ill-fated ‘mini-budget’ sought to boost growth by delivering large tax cuts to the wealthiest in society, in the hope that wealth would ‘trickle down’ to the rest of society. The spectacular failure of this event, and the Truss administration, is at least partly down to a mismatch between the barriers to growth and the solutions they attempted to provide.
Low investment, stagnant productivity and anaemic wage growth have been the longstanding barriers to prosperity in the UK since the 2008 financial crisis (Resolution Foundation 2022). The aftermath of the Covid-19 pandemic and last year’s energy crisis have resulted in the emergence of two clear and specific barriers to growth: permanently higher energy prices and record levels of sickness-related labour market inactivity.
The Coalition and Conservative government’s austerity programme cut public spending as a proportion of GDP from 46 per cent to around 39 per cent between 2010 and 2019. This was broadly delivered through public sector pay freezes, cuts to services, and cuts to investment spending (Pope et al 2022). These measures reduced state capacity going into the pandemic and merely deferred, rather than eliminated, many costs to the exchequer. This was especially the case as cuts in preventative services meant additional future demand for services such as the health system (Thomas 2020). Huge post-pandemic NHS backlogs are a glaring indicator of a system that does not have enough resources. In this context, it is unsurprising that long-term sickness has been driving higher levels of labour market inactivity. People in work are also affected – the sickness absence rate for those in employment with long-term health conditions is at its highest level since 2008 (ONS 2023b).
Austerity-driven spending cuts have quite literally resulted in crumbling schools. Disruptions to schools and university during the pandemic are also likely to impact future economic growth. Education determines human capital, which is another important factor for economic growth. The effects of lockdowns on educational attainment and learning
12 IPPR | Fairer taxes, smarter spending: A recipe for sustainable growth
are still being studied but early studies point to negative impacts on both maths and literacy (Renaissance Learning and EPI 2021). At the same time, the education system is also struggling with inflation. Teacher recruitment is well below target and has been since 2021, creating future supply problems in the schooling system (Worth 2023). All of this is likely to impact the ability of the education system to deliver, ultimately creating a drag on economic growth through slower human capital accumulation.
Public services cannot be cut any further without imposing significant costs on individuals. In fact, out-of-pocket spending on healthcare increased significantly in the UK since 2010, almost converging with the USA (Burn-Murdoch 2022). The UK would be much more resilient to higher energy prices if the government had not massively scaled back their ambition on building energy efficiency improvements during the 2010s (Ralston 2021).
IPPR and other research organisations such as Nesta’s Options 2040, the IFS, Resolution Foundation and the LSE’s Grantham Research Institute on Climate Change and the Environment highlight the vital role that well-funded, high-quality public services and investment play in delivering sustainable economic growth (Thomas et al 2023; Szreter and Burns 2023; Farquharson et al 2023; Zenghelis et al 2022)
In its 2023 report on the UK, the International Monetary Fund (IMF) stressed that “ambitious reforms” are needed build long-term prosperity in the UK. Often, the word ‘reform’ has been used as a euphemism for spending cuts and traditional IMF recommendations contain some flavour of austerity. However, even this fiscally cautious institution has outlined the need to increase spending in certain areas to drive growth. They note that “more significant health outlays will likely be needed to improve health outcomes” and that “higher investment in the education and training of young adults … is needed to strengthen human capital and boost productivity”. Part of their solution to solving energy supply issues is to “accelerate the green transition”, including by “expanding the programs for heat pump installations and home insulation”. Another “high-quality measure” recommended by IMF staff is to increase public sector pay to maintain high quality services and retain staff (IMF 2023).
Higher and better targeted spending on health will unlock growth by delivering a larger and healthier workforce. Additional spending on the education system, especially on vocational education and lifelong learning, will deliver a more skilled and adaptable workforce. Spending on building energy efficiency, transport decarbonisation and the green transition in general can unlock growth by reducing energy costs, giving businesses and households more to spend on other things. More public investment can deliver growth by building critical, productivity boosting infrastructure and can ‘crowd in’ private sector investment, boosting growth even further. The alternative is a return to stagnation and lower resilience to unforeseen shocks.
13 IPPR | Fairer taxes, smarter spending: A recipe for sustainable growth
6. SMART SPENDING REQUIRES SMARTER TAXATION
Half the growth in public spending over the OBR’s forecast is driven by higher interest on government debt. In the long-term, an ageing population and the effects of climate change are going to steadily increase the demand for public services, meaning that the government will need to sustain higher tax revenues or risk ever higher debt-interest payments (OBR 2023b).
If the Treasury were to borrow today for day-to-day spending such as funding for NHS staff, debt-repayment costs would pile up and eat even more into future budgets, taking resources away from public services and infrastructure. Public investment spending would increase public net worth and produce an economic return, meaning that additional borrowing costs would be covered. The state can spend smart by raising taxes to finance additional day-to-day spending needs, whilst borrowing for growth-generating investments. However, it would need to be much smarter about the way it taxes.
THE GOVERNMENT’S CURRENT TAX POLICY COULD BE MUCH MORE PROGRESSIVE
Most additional tax revenues over the OBR forecast period are projected to come from income tax and corporation tax. On corporation tax, the Treasury estimates that only 10 per cent of businesses are likely to pay the full 25 per cent rate (Seely 2023). This means small and medium-sized enterprises (SMEs) are protected from additional taxation – the small profits rate which was introduced alongside the 25 per cent increase will keep taxes at 19 per cent for most. The businesses paying additional taxes are likely to be the largest and/or the most profitable. The UK’s historic low rates of corporation tax did nothing to spur on business investment, so this is an encouraging shift toward a more investmentfriendly business tax regime (Dibb 2022).
However, the current policy on income tax and NICs thresholds is not encouraging – fiscal drag is regressive. The default position on the personal allowance and higher rate threshold is that they increase by inflation, whilst the top rate threshold is fixed. The Treasury’s decision to freeze these thresholds until 2027/28 means that pay will increase whilst income tax and national insurance thresholds stay the same. Therefore, a larger amount of income will be taxed relative to the default scenario where thresholds rise with inflation. Some people will be ‘dragged’ into higher tax brackets faster than they would have been if thresholds rose with inflation. This is illustrated below by modelling the impact of frozen thresholds on four individuals that see inflation-matching pay rises from 2021/22 to 2027/28
14 IPPR | Fairer taxes, smarter spending: A recipe for sustainable growth
1. Someone who starts on a salary of £30,000 a year, paying the basic rate
2. Someone who starts on a salary of £45,000 a year, initially paying the basic rate but later dragged into the higher rate tax bracket
3. Someone who starts on a salary of £55,000 a year, paying both the basic and higher rates.
4. Someone who starts on a salary of £165,000 a year, paying the additional rate, higher rate and basic rate. This person also does not have a tax-free personal allowance because their income is above £100,000.
TABLE
Analysisoffiscaldragonfourindividualincometaxpayers
Source: Author’s analysis using projections from OBR 2023a
Top earners are set to contribute the lowest share of their income towards additional taxes. The higher rate taxpayer contributes twice as much, proportionally, as the top rate taxpayer despite earning less than half as much. Even the lowest earning individual contributes a higher share of their income. This happens because higher rate taxpayers
3 Assumes that all salaries rise in line with OBR March 2023 nominal wage growth projections, and tax thresholds rise with OBR March 2023 inflation projections.
15 IPPR |
Fairer taxes, smarter spending: A recipe for sustainable growth
6.1: FISCAL DRAG MEANS TOP EARNERS CONTRIBUTE PROPORTIONALLY LESS THAN EVERYONE ELSE 3
Salary in 2021/22 (£) Salary in 2027/28 (£) Income tax and national insurance owed in 2027/28 if… Additional tax liabilities in 2027/28 due to fiscal drag … thresholds are frozen (£) … thresholds rise with inflation (£) £ % of 27/28 salary Basic rate taxpayer 30,000 35,710 7,400 6,680 720 2.0% Basic rate taxpayer moving into higher rate 45,000 53,560 13,450 12,390 1,060 2.0% Higher rate taxpayer 55,000 65,470 18,450 16,800 1,650 2.5% Top rate taxpayer 165,000 196,400 82,030 80,050 1,980 1.0%
are hit by the freeze in both the personal allowance and higher rate threshold, whilst top rate taxpayers are only impacted by the frozen higher rate threshold and the reduction to the top rate threshold. Higher rates of national insurance contributions for lower incomes also means basic rate taxpayers see a larger increase to their average rate of tax than the highest earners.
RISING WEALTH HAS BEEN LEFT UNTOUCHED
This way of raising taxes ignores the fact that the UK taxes work much more heavily than wealth. Taxes on work 4 are set to bring in almost half of all government tax receipts this year. Taxes related to wealth and assets, such as capital gains tax and stamp duty, are only set to bring in £1 out of £25. Tax rates on income from work are much higher than capital gains tax at every tax bracket, a fact that voters generally think is unfair (TJUK 2020). Such a system also creates perverse incentives that effectively penalises employment and income from wages The self-employed and company owner managers pay much lower taxes than employees even if they earn exactly the same income. This has driven a rise in self-employed contract work but most people do not have this option. These tax advantages to contractors and business owners are justified as a means to encourage investment but do not achieve this in practice (Delestre and Miller 2023).
Aside from creating a ‘squeezed middle’ of income taxpayers, current tax policy leaves huge gains in wealth during the pandemic relatively untouched. Between 2010 and 2015, household net wealth grew significantly from just below 600 per cent of GDP to around 700 per cent (Corlett 2019). This is likely to be even higher in 2023, driven by rapidly rising house prices in 2021 and 2022 (ONS 2023c). Wealth was already extremely concentrated within the richest households, and this latest boom in asset prices has likely exacerbated wealth inequality (Dibb et al 2021). Cost-of-living pressures disproportionately impact younger lower- and middle-income households – this group is also much less likely to
16 IPPR | Fairer taxes, smarter spending: A recipe for sustainable growth
Income tax bracket Income tax rate Capital gains tax rate on residential property Capital gains tax rate on all other assets Basic 20% 18% 10% Higher 40% 28% 20% Additional 45% 28% 20%
TABLE 6.2: INCOME TAX RATES ARE LOWER THAN CAPITAL GAINS TAX
Ratesofincomeandcapitalgainstaxforeachincometaxbracket
Source: HMRC
4 Income tax and national insurance contributions; based on projections from OBR (2023a).
own assets or have a large stock of wealth (Corlett 2023). In this context, higher taxes on wealth are the route to raising revenue whilst allowing working households to recover from the impacts of inflation.
Whilst there is no net wealth tax in the UK, taxable capital gains have sky-rocketed to £92 billion in 2021/22. Increasing taxes on wealth and income from wealth, through existing policies like capital gains tax, and new tax policies such as a proportional property tax, is a sorely needed step to ensure that the government has the revenue it needs to provide essential services and investment (Parkes and Nanda 2019; Nanda 2021).
FIGURE 6.1: CAPITAL GAINS HAVE SKYROCKETED, CAPITAL GAINS TAX HAS NOT CAUGHT UP
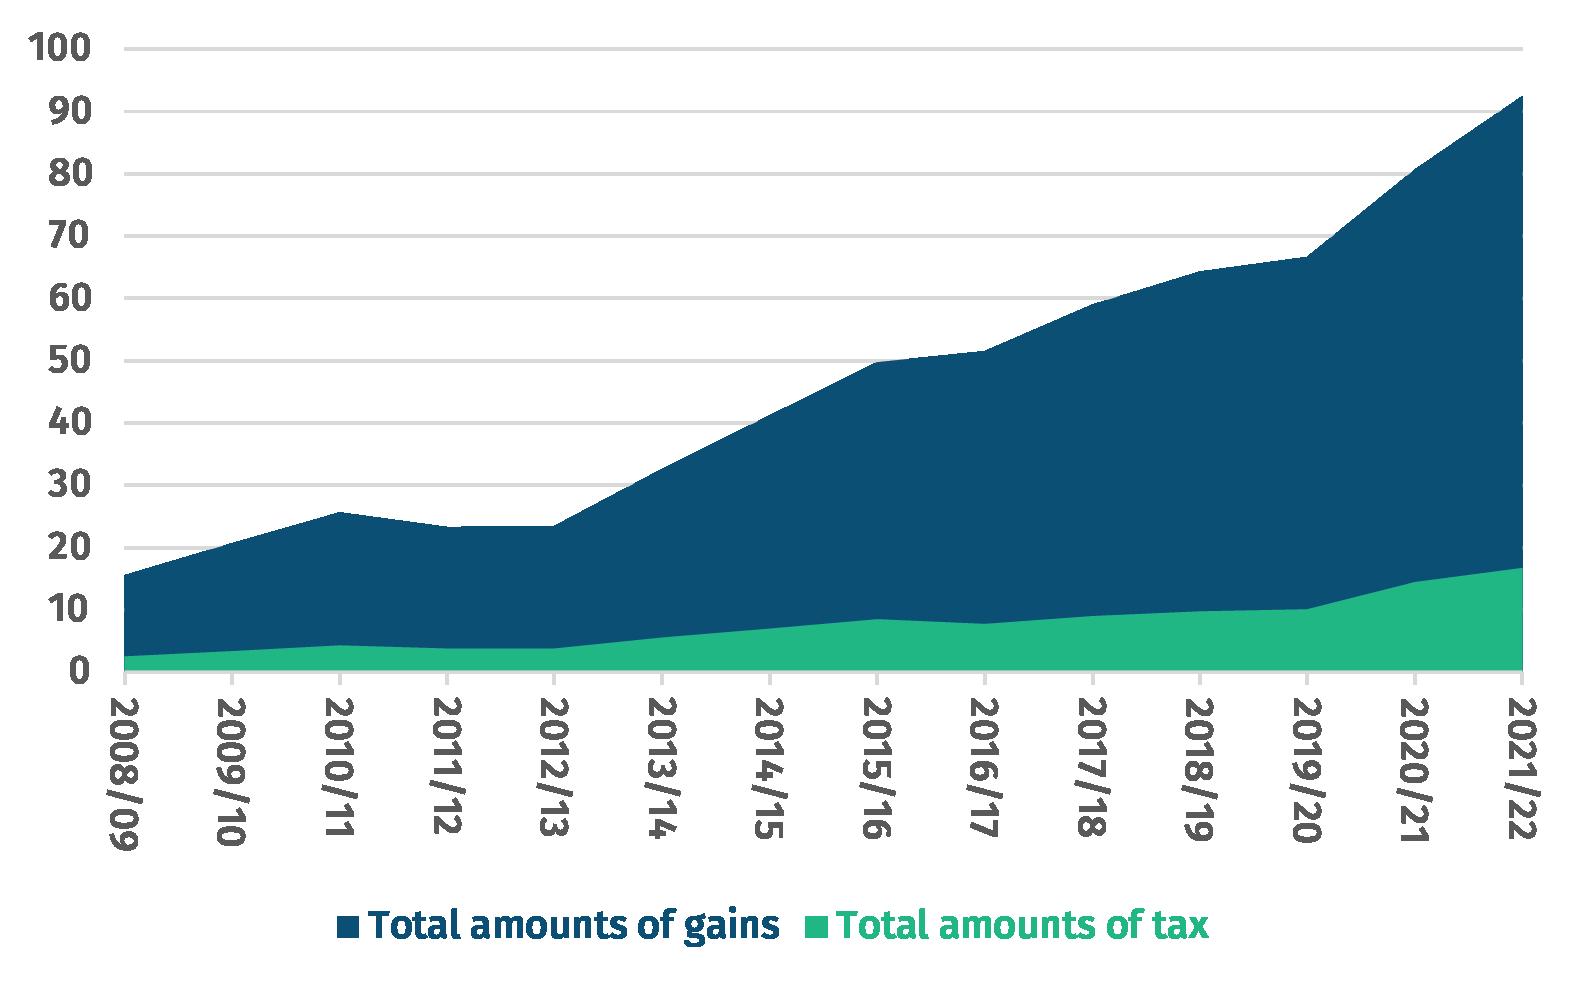
Annualtaxablecapitalgainsandcapitalgainstaxrevenues(£bn)
Source: HMRC 2023b
Note: Taxable capital gains figures are not adjusted for annual exemptions
Polling from YouGov finds this to be a popular policy with 55 per cent of voters supporting rates of CGT that are equal to or higher than tax on income. 63 per cent of voters believe that the wealthy are undertaxed (YouGov 2023a; 2023b).
17 IPPR | Fairer taxes, smarter spending: A recipe for sustainable growth
7. HIGHER TAXES CAN BE POPULAR IF USED TO IMPROVE SERVICES
VOTERS SUPPORT HIGHER SPENDING ON PUBLIC SERVICES
The British public has been feeling increasingly insecure about their economic and financial positions in recent years, with the cost-of-living crisis massively increasing the salience of economic security. Research from organisations across the political spectrum have identified this as the core issue for voters. As part of this trend, voters are increasingly worried about the quality of public services (Simons et al 2023; Cooke 2023; Tanner and O’Shaughnessy 2019).
Source: British Social Attitudes Survey, wave 40
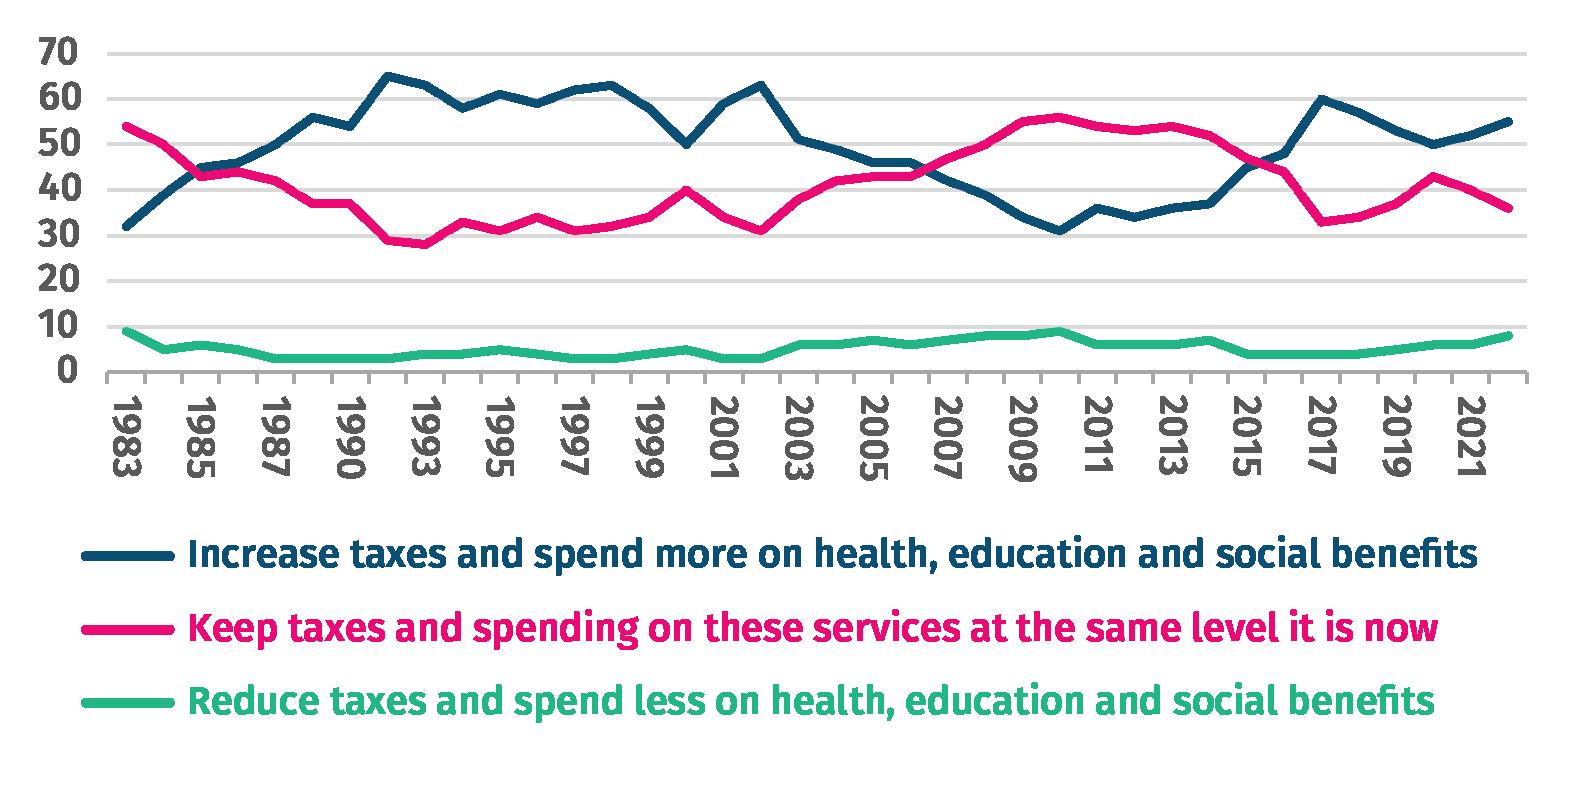
55 per cent of the British public support higher taxation and government spending on health, education, and social benefits. The proportion of people who support lower
18 IPPR | Fairer taxes, smarter spending: A recipe for sustainable growth
FIGURE 7.1: PUBLIC SUPPORT FOR HIGHER TAXATION AND GOVERNMENT SPENDING SURGED DURING THE PANDEMIC
Attitudestowardstaxationandspendingonhealth,educationandsocialbenefits
taxation and lower government spending on services has never been higher than 9 per cent in the 40-year history of the British Social Attitudes (BSA) survey. On average, only around 5 per cent of people have supported lower tax and spend in any given year. In fact, the latest BSA results show that a more active government is highly popular among the public (Curtice and Scholes 2023).
When Nesta’s ‘UK 2040 Options’ project put this question to voters in 144 marginal constituencies in May this year, 32 per cent supported higher taxes and spending, whilst 36 per cent said they preferred to keep things the same. Once again, only a small minority of 12 per cent supported lower taxes and spending (Orso and Szreter, 2023). Beyond attitudes to tax in general, the public are supportive of raising greater revenues from those with the broadest shoulders. YouGov polling in June this year showed 63 per cent of people thought that taxes on the richest in Britain were “too low – the rich are not paying enough and their taxes should be increased”. When probed further on what the specific level of income was above which taxes should be raised, 15 per cent thought £75,000, 25 per cent thought £100,000, another 15 per cent thought £150,000, and 11 per cent thought £250,000.
COST-OF-LIVING CONSIDERATIONS WEIGH ON VOTERS’ SUPPORT FOR TAXATION
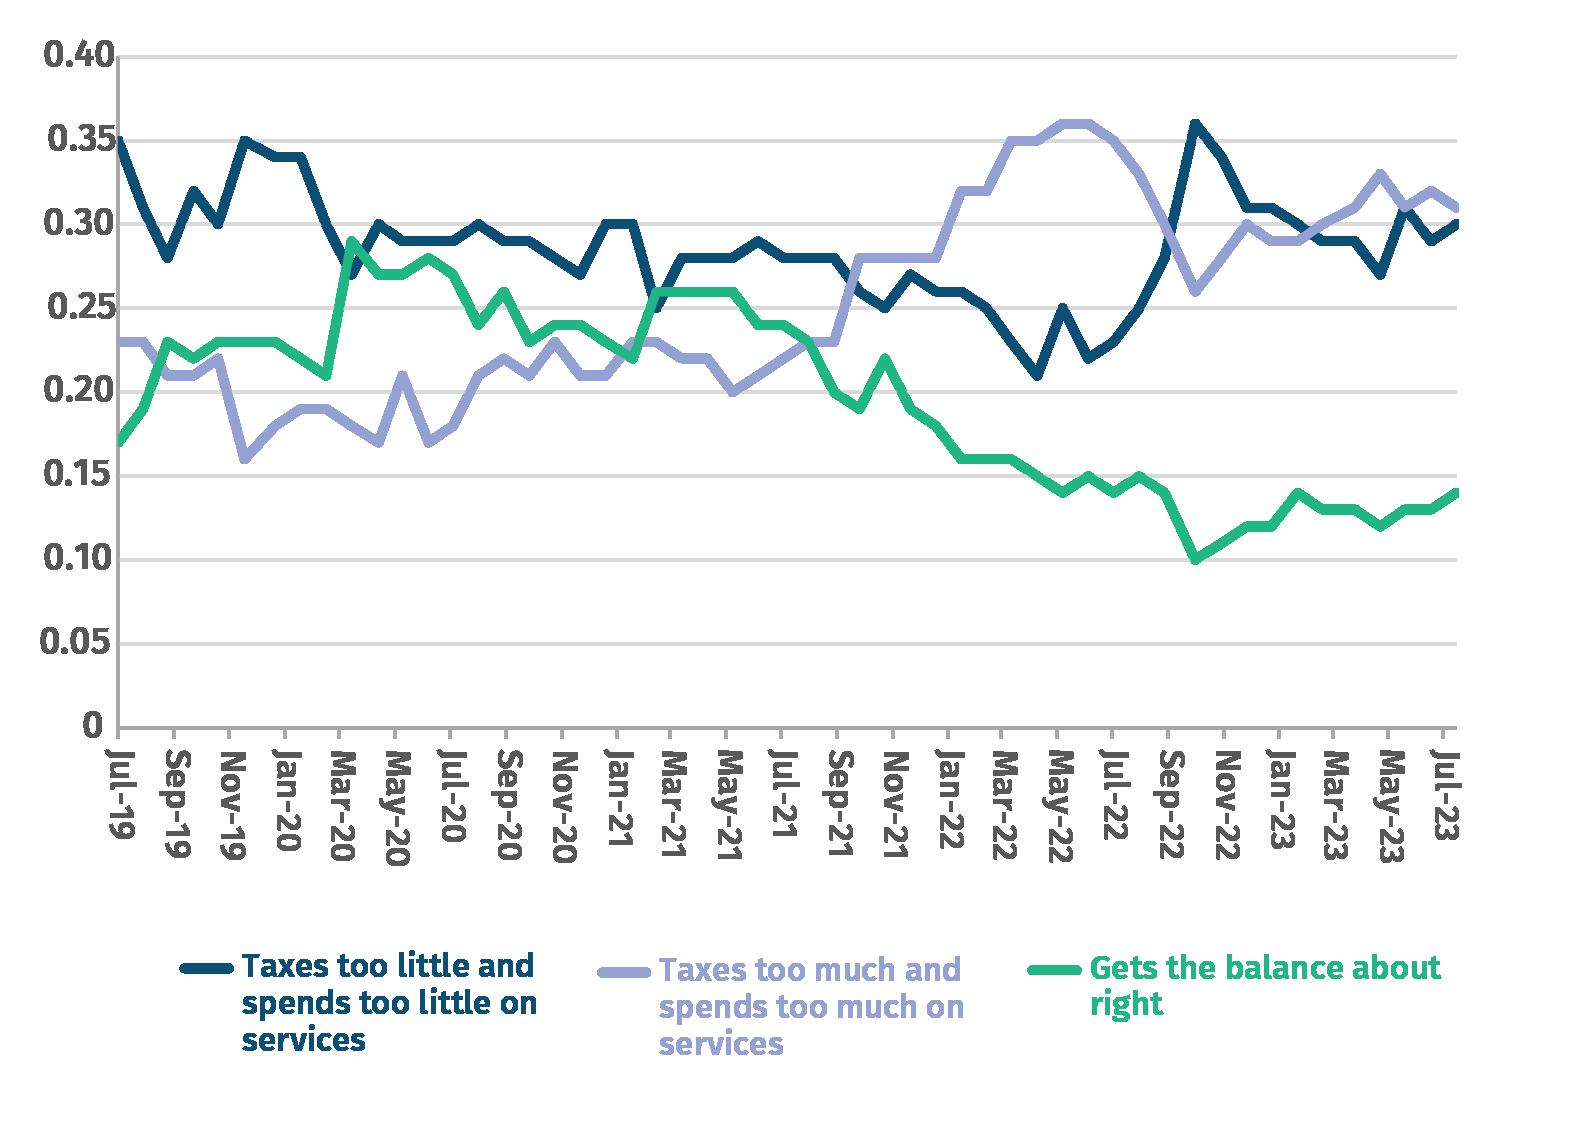
FIGURE 7.2: THE MINI-BUDGET COINCIDED WITH A SURGE OF SUPPORT FOR HIGHER TAX AND SPENDING
Responsestothequestion: “Generally speaking, do you think the government taxes too much and spends too much on services, taxes too little and spends too little on services, or gets the balance about right?”
19 IPPR | Fairer taxes, smarter spending: A recipe for sustainable growth
War in Ukraine begins; inflation takes off; partygate dominates headlines
Johnson administration’s short-lived national insurance increase and the national fuel crisis takes place
Mini budget
Source: YouGov 2023c
A separate survey by YouGov tells a slightly different story on public sentiment towards tax and spending. Public support for higher tax and spending was relatively high and sustained for many months from mid-2019 to late 2021 – the most popular answer then was that the government taxed and spent too little.
The turning point came in October 2021 when the proportion who thought government taxes and spends too much shot up from 23 per cent to 28 per cent. This was when Boris Johnson announced the introduction of a new health and social care levy, effectively an increase in national insurance contributions. It is likely that as the salience around inflation, cost of living and poor political leadership increased, support for the notion that taxes and spending were too high also increased.
It appears that the public then rejected the Truss administration’s efforts to radically cut taxes in their ‘mini-budget’ – the proportion of people who thought government was not taxing and spending enough shot up by 8 percentage points, whilst the proportion who thought it was taxing too much dropped 4 percentage points.
Even with the cost-of-living crisis putting a huge strain on household finances, polling carried out by YouGov as part of IPPR’s Commission on Health and Prosperity found an overwhelming majority of people support tax-funded health and social care (80 per cent and 70 per cent of people respectively). 45 per cent of people supported higher taxes to ensure that health and social care are properly funded (Thomas 2023).
20 IPPR | Fairer taxes, smarter spending: A recipe for sustainable growth
8. CONCLUSION
Public services, from the NHS to local councils, have been eroded by austerity measures, and are now struggling to meet the needs of the population. The UK’s ageing population is increasing the demand for public services, particularly in health and social care, while at the same time, a shrinking working-age population is reducing the pool of taxpayers. This puts significant strain on public services and the public purse.
To rectify this situation, the government has three choices: to cut spending on services, to borrow money, or to raise taxes. Austerity has shown that cuts to public spending have severe consequences for society and the economy, with the poorest disproportionately affected. A progressive, fiscally responsible government would ensure that day-to-day public services are adequately funded but that borrowing is mainly reserved for longerterm investments or short-term crisis measures such as the furlough scheme
This leaves raising taxes as a viable and necessary option. However, the challenge is to raise taxes in a way that is both fair and sustainable. It is crucial to consider who is being taxed and how. A progressive tax system, where those who earn more pay more, is key to maintaining fairness and ensuring those who can afford to contribute more do so.
The government’s current policy direction, with an increase in the tax level, could be seen as a step in the right direction, particularly if this increase is focussed on the wealthier sections of society. However, there are important questions about who pays the additional taxes. The tax level in and of itself is not inherently problematic; rather, it is how that tax is collected and how the revenue is spent that should be the focus of our attention.
There is also a need for transparency about what higher taxes will fund. Communicating to the public that increased taxes are being used to fund essential public services, to address social inequality, and to invest in a greener future could shift the narrative around taxation. Rather than viewing it as a burden, it could be seen as a collective investment in the country’s future.
At the international level, it's also worth noting that the UK’s tax level is not out of line with other comparable countries. Many of the most successful economies have higher tax levels. Scandinavian countries, for example, often have tax levels above 40 per cent of GDP, significantly higher than the UK, yet they rank highly on measures of societal wellbeing, economic stability, and social mobility.
The fixation on the tax level is a distraction from the real issues. The key challenges we face require strategic investment, which will necessitate higher tax receipts. The focus should be on ensuring that the tax system is fair, and that tax revenues are used effectively and transparently to meet society’s needs.
21 IPPR | Fairer taxes, smarter spending: A recipe for sustainable growth
REFERENCES
Boccarini G (2023) Health care funding, Health Foundation. w.health.org.uk/publications/longreads/health-care-funding
Brien P and Keep M (2023) Public spending during the Covid-19 Pandemic, House of Commons Library. https://commonslibrary.parliament.uk/research-briefings/cbp-9309/
Burn-Murdoch J (2023) ‘UK healthcare is already being privatised, but not in the way you think’, Financial Times https://www.ft.com/content/dbf166ce-1ebb-4a67-980e-9860fd170ba2
CBI Economics (2022) ‘Overcoming shortages: How to create a sustainable labour market’, article, Recruitment and Employment Confederation. https://www.rec.uk.com/our-view/policy-andcampaigns/labour-shortages/overcoming-shortages-creating-sustainable-labour-market
Causa O, Soldani E, Luu N and Soriolo C (2022) ‘A cost-of-living squeeze? Distributional implications of rising inflation’, Economics Department working paper, OECD. https://www.oecdilibrary.org/economics/a-cost-of-living-squeeze-distributional-implications-of-risinginflation_4b7539a3-en;jsessionid=6Igqxf6cqaLdY6wVXmUh_VKtWn0_lB9-g1R5g_Pa.ip-10-240-5-120
Conte M, Miller H and Pope T (2019) How do other countries raise more in tax than the UK?, IFS. https://ifs.org.uk/publications/how-do-other-countries-raise-more-tax-uk
Cooke G (2023) Economic Security: A foundation for dignity, opportunity and hope in an age of uncertainty, Joseph Rowntree Foundation. https://www.jrf.org.uk/report/economic-securityfoundation-dignity-opportunity-and-hope-age-uncertainty
Corlett A (2019) The shifting shape of UK tax, Resolution Foundation. https://www.resolutionfoundation.org/publications/the-shifting-shape-of-uk-tax/
Corlett A (2023) The Living Standards Outlook – Summer 2023 Update, Resolution Foundation. https://www.resolutionfoundation.org/publications/living-standards-outlook-summer2023/#:~:text=Key%20findings,income%20fall%20in%202022%2D23
Curtis J and Scholes A (2023) British social attitudes: Role and responsibilities of government – Have public attitudes changed?, National Centre for Social Research.
https://natcen.ac.uk/sites/default/files/202309/BSA%2040%20Role%20and%20responsibilities%20of%20government.pdf
Delestre I and Miller H (2023) Tax and public finances: the fundamentals, IFS and UK Options 2040. https://ifs.org.uk/publications/tax-and-public-finances-fundamentals
Department for Energy Security and Net Zero [DESNZ] (2023) ‘£40 billion spent protecting families and businesses from energy costs’, news article, UK Government.
https://www.gov.uk/government/news/40bn-spent-protecting-families-and-businesses-fromenergy-costs
Dibb G, Jung C, Parkes H, Nanda S (2021) Prosperity and justice after the pandemic, IPPR.
https://www.ippr.org/research/publications/prosperity-and-justice-after-the-pandemic
22 IPPR | Fairer taxes, smarter spending: A recipe for sustainable growth
Dibb G (2022) ‘Cutting corporation tax is not a magic bullet for increasing investment’, blog post, IPPR. https://www.ippr.org/blog/cutting-corporation-tax-not-magic-bullet-for-increasinginvestment
Farquharson C, Phelan D, Sibieta L and Tahir I (2023) ‘Teacher recruitment, training and retention’, submission to the Education Select Committee, IFS. https://ifs.org.uk/publications/teacherrecruitment-training-and-retention-submission-education-select-committee
Hodgkin R and Sasse T (2022) Tackling the UK’s energy efficiency problem, Institute for Government.
https://www.instituteforgovernment.org.uk/sites/default/files/publications/tackling-energyefficiency-problem.pdf
HMRC (2023a)’ Table 2.4 Shares of total income tax liability, Income tax statistics and distributions’, dataset. https://www.gov.uk/government/statistics/shares-of-total-income-before-and-after-taxand-income-tax-for-percentile-groups
HMRC (2023b) ‘Capital Gains Tax Statistics’, dataset, HMRC.
https://www.gov.uk/government/statistics/capital-gains-tax-statistics
International Monetary Fund (2023) ‘United Kingdom: 2023 Article IV Consultation’, press release; staff report; staff statement; and statement by the executive director for the United Kingdom, IMF.
https://www.imf.org/en/Publications/CR/Issues/2023/07/10/United-Kingdom-2023-Article-IVConsultation-Press-Release-Staff-Report-and-Statement-by-the-535878
Institute for Fiscal Studies [IFS] (2022) ‘Autumn Statement leaves colleges, nurseries and universities out in the cold’, press release. https://ifs.org.uk/news/autumn-statement-leavescolleges-nurseries-and-universities-out-cold
Keep M (2023) ‘Tax statistics: an overview’, research briefing, House of Commons Library. https://commonslibrary.parliament.uk/research-briefings/cbp-8513/
Nanda S (2021) Pulling down the ladder: The case for a proportional property tax, IPPR. https://www.ippr.org/research/publications/pulling-down-the-ladder
OECD (2023a) ‘Revenue Statistics: Comparative tables’, dataset. https://doi.org/10.1787/data-00262en
OECD (2023b) ‘National Accounts at a Glance’, dataset. https://www.oecdilibrary.org/economics/data/oecd-national-accounts-statistics/national-accounts-at-aglance_data-00369-en
Office for Budget Responsibility [OBR] (2023a) ‘Economic and Fiscal outlook – March 2023’, dataset https://obr.uk/efo/economic-and-fiscal-outlook-march-2023/
Office for Budget Responsibility [OBR] (2023b) ‘Fiscal Risks and Sustainability – July 2023’, dataset https://obr.uk/frs/fiscal-risks-and-sustainability-july-2023/
Office for National Statistics [ONS] (2023a) Impact of Blue Book 2023 changes on gross domestic product, dataset.
https://www.ons.gov.uk/economy/grossdomesticproductgdp/articles/impactofbluebook2023chan gesongrossdomesticproduct/2023-09-01#impact-of-blue-book-2023-on-volume-gdp
Office for National Statistics [ONS] (2023b) ‘Rising ill-health and economic inactivity because of long-term sickness, UK: 2019 to 2023’, dataset.
| Fairer taxes, smarter spending: A recipe for sustainable growth
23 IPPR
https://www.ons.gov.uk/employmentandlabourmarket/peoplenotinwork/economicinactivity/articl es/risingillhealthandeconomicinactivitybecauseoflongtermsicknessuk/2019to2023#:~:text=For%20t hose%20individuals%20suffering%20with,a%20long%2Dterm%20health%20condition
Office for National Statistics [ONS] (2023c) ‘UK House Price Index: May 2023’, dataset.
https://www.ons.gov.uk/economy/inflationandpriceindices/bulletins/housepriceindex/may2023
Orso L and Sztreter B (2023) The options ahead: What people in election battlegrounds think, UK 2040 Options. https://options2040.co.uk/the-options-ahead-what-people-in-electionbattlegrounds-think/
Parkes H and Nanda S (2019) Just tax: Reforming the taxation of income from wealth and work, IPPR Commission on Economic Justice. https://www.ippr.org/research/publications/just-tax
Pope T, Hoddinott S and Fright M (2022) ‘Austerity’ in public services: lessons from the 2010s, Institute for Government.
https://www.instituteforgovernment.org.uk/publication/report/austerity-public-services-lessons2010s
Ralston J (2021) Energy efficiency and decarbonising heat, Energy and Climate Intelligence Unit. https://eciu.net/analysis/briefings/low-carbon-heat/energy-efficiencys-role-in-heatdecarbonisation
Renaissance Learning and Education Policy Institute [EPI] (2021). Understanding progress in the 2020/21 academic year: Findings from the summer term and summary of all previous findings, Department for Education.
https://assets.publishing.service.gov.uk/government/uploads/system/uploads/attachment_data/f ile/1062286/Understanding_progress_in_the_2020_to_2021_academic_year_Findings_from_the_su mmer_term_and_summary_of_all_previous_findings.pdf
Resolution Foundation (2022) Stagnation Nation: The Interim Report of The Economy 2030 Inquiry. https://economy2030.resolutionfoundation.org/
Seargeant P (2023) Tax narratives in public discourse, Uncecked UK. https://unchecked.uk/wpcontent/uploads/2023/03/REPORT_Tax-Narratives-in-Public-Discourse_FINAL.pdf
Seely A (2023). Corporate tax reform, House of Commons Library. https://commonslibrary.parliament.uk/research-briefings/cbp-9178/
Simons J, Williams J, Cooper C and Ferriter K (2023) Red Shift: Labour’s Path to Power, Labour Together. https://labourtogether.uk/report/red-shift
Szreter B and Burns A (2023). Economic growth and the productivity puzzle: the choices, UK 2040 Options. https://options2040.co.uk/economic-growth-and-the-productivity-puzzle-the-choices/
Tanner W and O’Shaughnessy J (2019) The politics of Belonging, Onward. https://www.ukonward.com/reports/politics-of-belonging-workington-man-2019/
Tax Justice UK (2020) Talking tax: how to win support for taxing wealth. https://www.taxjustice.uk/uploads/1/0/0/3/100363766/talking_tax__how_to_win_support_for_taxing_wealth.pdf
Taxpayers’ Alliance (2023) Calling out the tax burden https://www.taxpayersalliance.com/calling_out_the_tax_burden
| Fairer taxes, smarter spending: A recipe for sustainable growth
24
IPPR
Thomas C (2020) Resilient Health and Care: Learning the lessons of Covid-19, IPPR. https://www.ippr.org/research/publications/resilient-health-and-care
Thomas C, Jung C, Statham R and Quilter-Pinner H (2023) Healthy people, prosperous lives, IPPR. Available at: https://www.ippr.org/research/publications/healthy-people-prosperous-lives
Thomas C (2023) Healthcare and prosperity: The NHS at 75, IPPR. https://www.ippr.org/research/publications/the-nhs-at-75
Worth J (2023) Short supply: Addressing the Post-Pandemic Teacher Supply Challenge in England, National Foundation for Educational Research. https://www.nfer.ac.uk/short-supply-addressingthe-post-pandemic-teacher-supply-challenge-inengland/#:~:text=Key%20Findings&text=The%20rapid%20growth%20of%20flexible,importantly%20f or%20retaining%20existing%20teachers
YouGov (2023a) ‘In principle, do you think that tax on earnings made that are not from a person’s job(s) (e.g. from investments, real estate) should be taxed at a higher, lower or about the same rate as a earning made from a person’s job(s)?’, dataset, YouGov Public data. https://yougov.co.uk/topics/politics/survey-results/daily/2023/08/21/6d498/1
YouGov (2023b) ‘Are taxes on the rich too high or low in Britain?’, dataset, YouGov Public data. https://yougov.co.uk/topics/politics/trackers/are-taxes-on-the-rich-too-high-or-low-in-britain
YouGov (2023c) ‘Are we taxing the right amount?’, dataset, YouGov Public data
https://yougov.co.uk/topics/politics/trackers/are-we-taxing-and-spending-the-right-amount
Zenghelis D, Taylor C and Stern N (2022) Policies for investing in sustainable growth: risks and opportunities in the current macroeconomic environment, Grantham Institute on Climate Change and the Environment. https://www.lse.ac.uk/granthaminstitute/publication/policies-for-investingin-sustainable-growth-risks-and-opportunities-in-the-current-macroeconomic-environment/
25 IPPR | Fairer taxes, smarter spending: A recipe for sustainable growth
Institute for Public Policy Research
GET IN TOUCH For more information about the Institute for Public Policy Research, please go to www.ippr.org You can also call us on +44 (0)20 7470 6100, e-mail info@ippr.org or tweet us @ippr Institute for Public Policy Research Registered Charity no. 800065 (England & Wales), SC046557 (Scotland), Company no, 2292601 (England & Wales)
