S P E C I A L O N RAW M ATE RI A L S , PIGMENTS, PA I NT & C O ATI NG TE CHNOLOGIES
BRAND-NEW
B
YK-Gardner - worldwide partner of the automotive, paint and plastic
© BYK-Gardner
Next Generation of BYK-Gardner’s Data Analysis Software smart-chart industries for quality control
of colour, appearance and physical properties - is announcing the next generation of their data analysis software smart-chart. In order to guarantee uniformity over time and be able to proactively take measures before colour or appearance start to drift, process stability has to be controlled. Therefore, a representative number of readings have to be taken and large data sets need to be analysed. The next generation of smart-chart software is built on a new state-of-the-art platform and offers advanced graphics and printout functionality as well as a streamlined user interface.
Dive into the new advanced graphical functionality of smart-chart
1
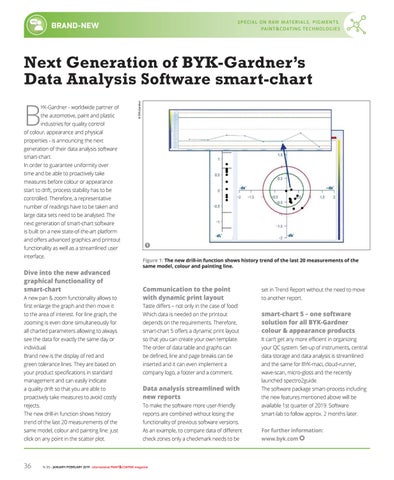
Figure 1: The new drill-in function shows history trend of the last 20 measurements of the same model, colour and painting line.
A new pan & zoom functionality allows to
Communication to the point with dynamic print layout
first enlarge the graph and then move it
Taste differs – not only in the case of food!
to the area of interest. For line graph, the
Which data is needed on the printout
zooming is even done simultaneously for
depends on the requirements. Therefore,
all charted parameters allowing to always
smart-chart 5 offers a dynamic print layout
smart-chart 5 – one software solution for all BYK-Gardner colour & appearance products
see the data for exactly the same day or
so that you can create your own template.
It can’t get any more efficient in organizing
individual.
The order of data table and graphs can
your QC system. Set-up of instruments, central
Brand new is the display of red and
be defined, line and page breaks can be
data storage and data analysis is streamlined
green tolerance lines. They are based on
inserted and it can even implement a
and the same for BYK-maci, cloud-runner,
your product specifications in standard
company logo, a footer and a comment.
wave-scan, micro-gloss and the recently
management and can easily indicate
set in Trend Report without the need to move to another report.
launched spectro2guide.
proactively take measures to avoid costly
Data analysis streamlined with new reports
rejects.
To make the software more user-friendly
available 1st quarter of 2019. Software
The new drill-in function shows history
reports are combined without losing the
smart-lab to follow approx. 2 months later.
trend of the last 20 measurements of the
functionality of previous software versions.
same model, colour and painting line: just
As an example, to compare data of different
For further information:
click on any point in the scatter plot.
check zones only a checkmark needs to be
www.byk.com
a quality drift so that you are able to
36
N. 55 - JANUARY/FEBRUARY 2019 - international PAINT&COATING magazine
The software package smart-process including the new features mentioned above will be