
Gulaq Gear 6 performance deep dive of 2022

Recap:
Gulaq portfolios follow multi-factor investing We track 130+ factors including fundamental, technical, and macro-economic factors in our portfolio construction process. Every month we will take market movement into consideration and accordingly rebalance our portfolios
Launched in 2020, Gulaq Gear 6 is our flagship portfolio with 100% equity allocation. The portfolio has been one of the top small cases with its strong outperformance. We have covered how the portfolio has performed in the initial 2 years in our earlier blog.
Since launched in 2020, we have seen only bull markets till 2021. During that period, Nifty gave 96% returns vs Gulaq Gear 6 giving 180% returns. Gulaq Gear 6 gained the reputation of alpha generating machine with its golden run in 2020, 2021 bull markets.
Coming from such a bull run, investors had huge expectations for 2022 How did Gulaq Gear 6 perform in such expectations, and did it live up to its reputation? Let’s find out
Gulaq Gear 6 Performance in 2022
We would like to break down the performance deep dive into 3 parts:
● Returns comparison with Nifty50
● Stock level analysis
● Diversification
Returns comparison with Nifty50
It's an accepted fact that a skilled investor is someone who can beat markets. Hence, we will start with whether we, as an investment advisor, are able to beat markets or not.
Performance wise 2022 is an interesting year. First half of 2022 has seen bear markets with Nifty losing 15% from its peak in Oct 2021. There were signs of recession, making the markets look gloomy. In such a situation, the second half came as a beautiful surprise with a massive recovery out of nowhere.
The following graph shows the performance comparison of Gulaq Gear 6 with Nifty 50 in 2022. During the bear markets, Gulaq Gear 6 gave slightly better performance compared to markets. During the bull markets from July 2022, the portfolio took off to create a huge alpha. Overall, Gulaq Gear has given 21.3% returns compared to Nifty50’s 3% returns.
Gulaq rebalances its portfolios monthly Though it is not fair to judge a portfolio’s performance on a monthly basis, it would still be interesting to see how Gulaq performed monthly The following bar graph shows the monthly returns comparison of Gulaq Gear 6 and Nifty50.
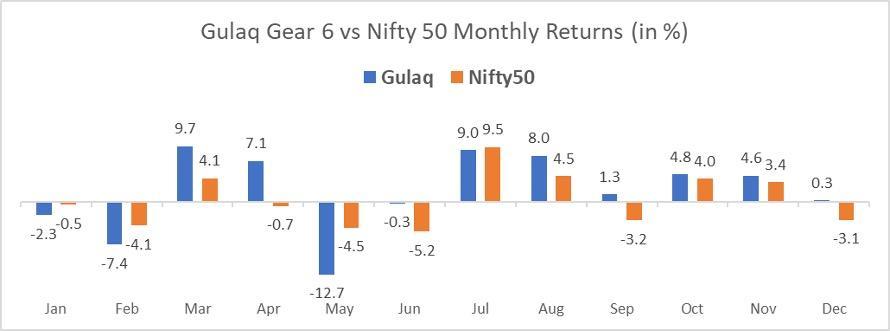
Despite beating Nifty50 in 8 out of 12 months, Gulaq Gear 6 has experienced a lot of volatility from Feb to May The portfolio gave as high as 9.7% in Mar, and a depressing

-12.7% returns in May.This is exactly why we do not recommend judging a portfolio on a monthly basis. It’s too short to judge.
We have performed quarterly rolling returns analysis to see a better picture of performance.The following bar chart shows the comparison of Gulaq Gear 6 with Nifty 50.

Example of quarterly rolling returns: The returns of 9.1% in Jan is the overall returns of Nov, Dec, and Jan. Similarly, -5.4% in Feb is the overall returns of Dec, Jan, and Feb.
Stock-level analysis:
We have picked our top 5 winners and losers to show stock-level analysis. The following tables show the power of our algorithms. On average, our key winners have a weight of 4.92% and contributed an average alpha of 5.38. Our key losers have only 2.75% weight with an average alpha of -1.9
Key Winners
Key Losers
Diversification:
We considered market cap allocation and sector allocation to judge the diversification aspect.
Market CapAllocation:
Gulaq Gear 6 is well diversified across market caps. The following table shows the split of Gulaq Gear 6 into Large cap, Mid cap, and Small cap. Our Large cap allocation of 40% to 50% tends to bring stability to the portfolio and the other constituents are incorporated to extract outperformance over benchmark indices like Nifty50 and Equity multicap.
However, the year 2022 belongs to large caps. Our algos picked clues from the market and added large caps more to the portfolio in the second half. The following shows the average allocation and returns across market caps.
SectorAllocation:

When we talk about diversification, sector allocation is one of the key aspects to look at. We had stocks picked from 9 sectors. Some sectors are overweight owing to their suitable market conditions and went underweight on others.
The sectors which stood out for Gulaq portfolios are Industrials, Consumer staples, and Utilities. We had consistent allocation to these sectors across the year. On the other hand, Financials because of its poor performance got removed from the portfolio in the second half.
Conclusion:
The year 2022 is a proof of our concept that multi-factor investing works in different market cycles. We believe Gulaq Gear 6 went beyond the expectations in terms of generating alpha over its benchmark. The portfolio gave 7X returns of what Nifty50 has produced.
At Gulaq, our mission is to make systematic investing accessible for everyone. We would love to have you in our family. If you haven’t subscribed to Gulaq portfolios, do it now. Happy investing!