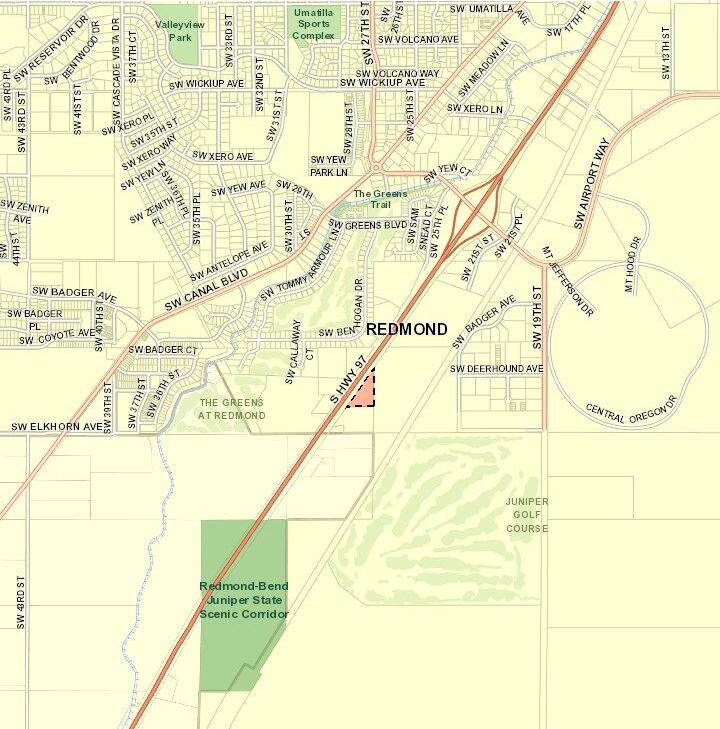
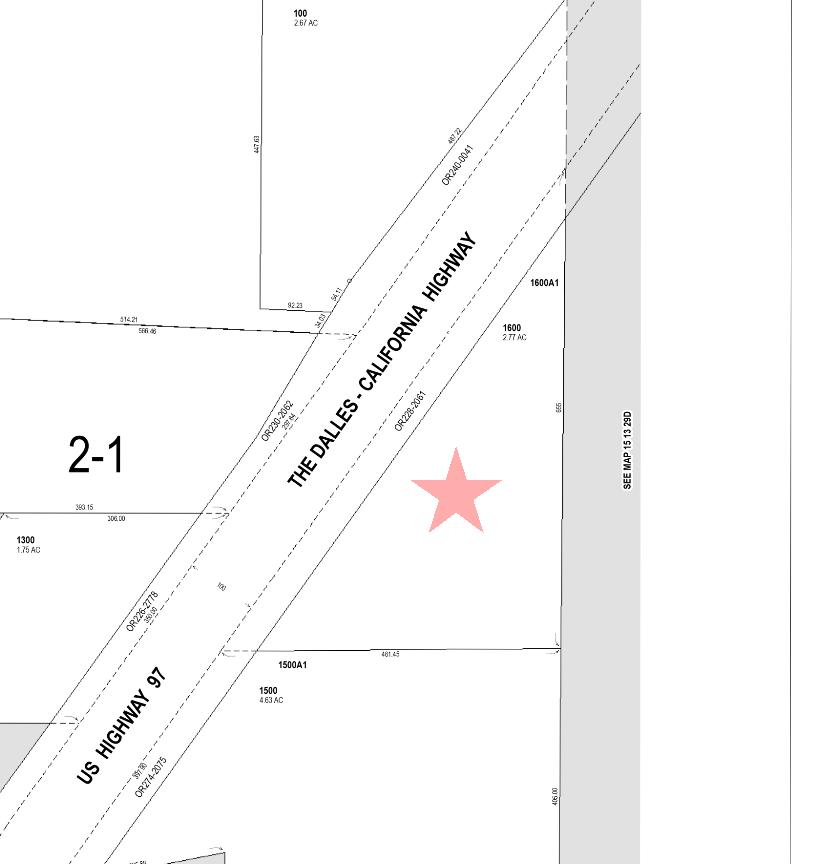
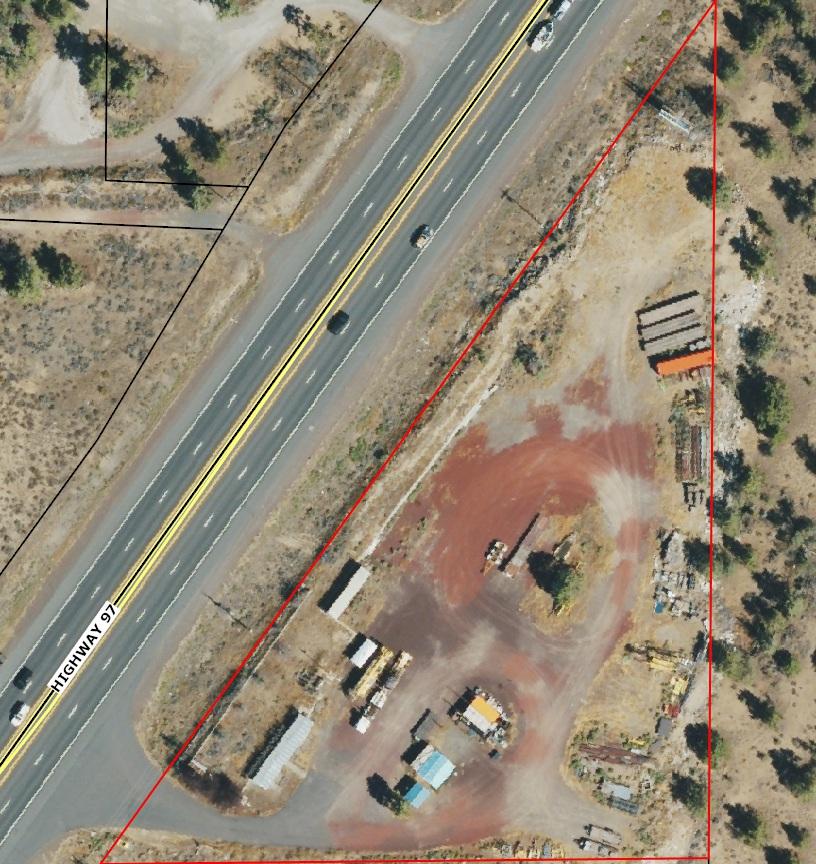
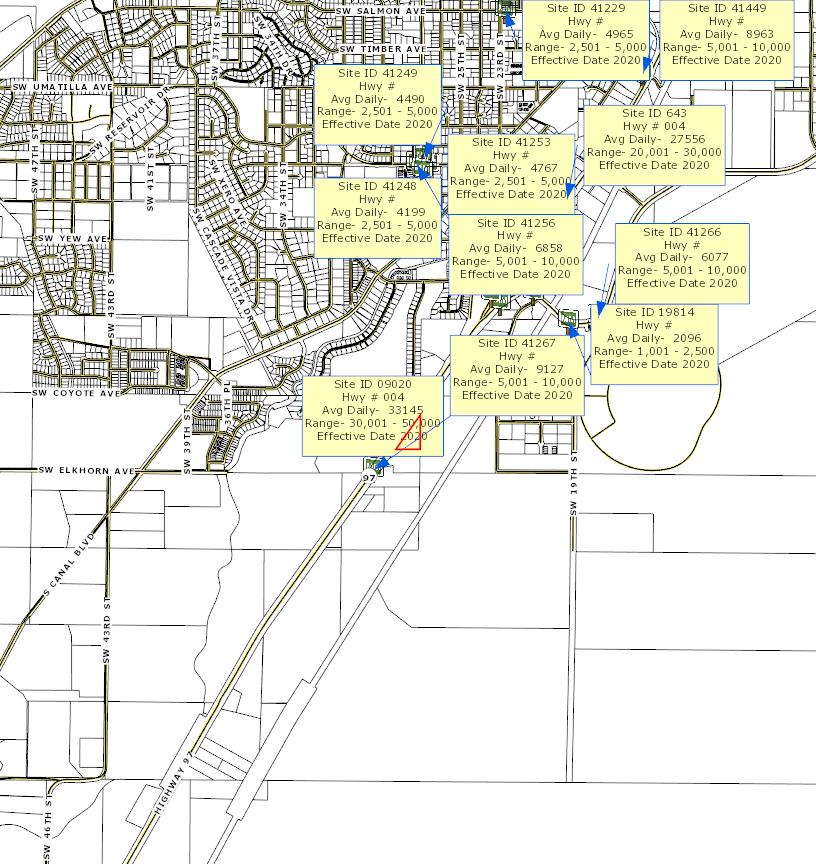
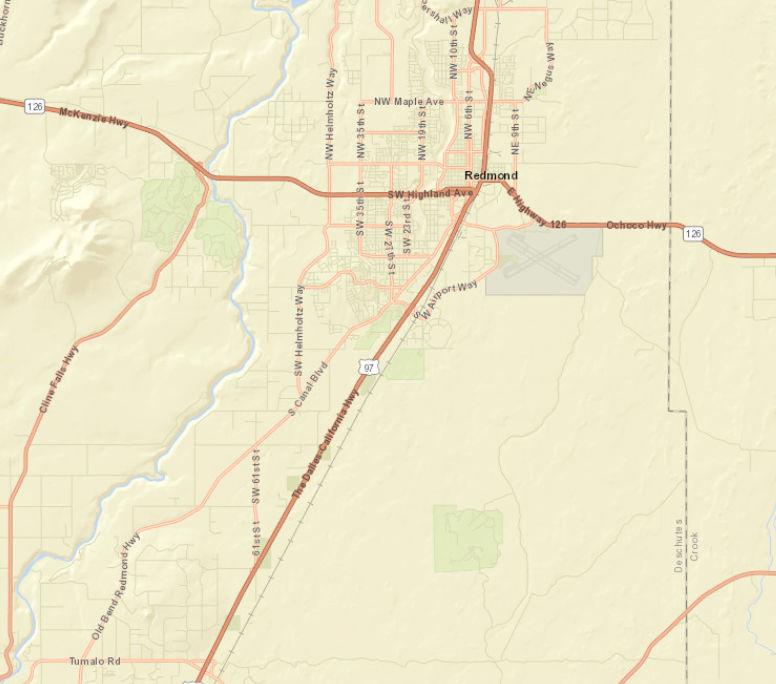
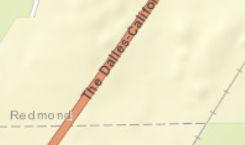
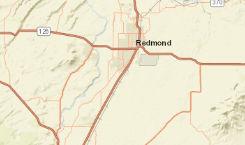
TransportationMap

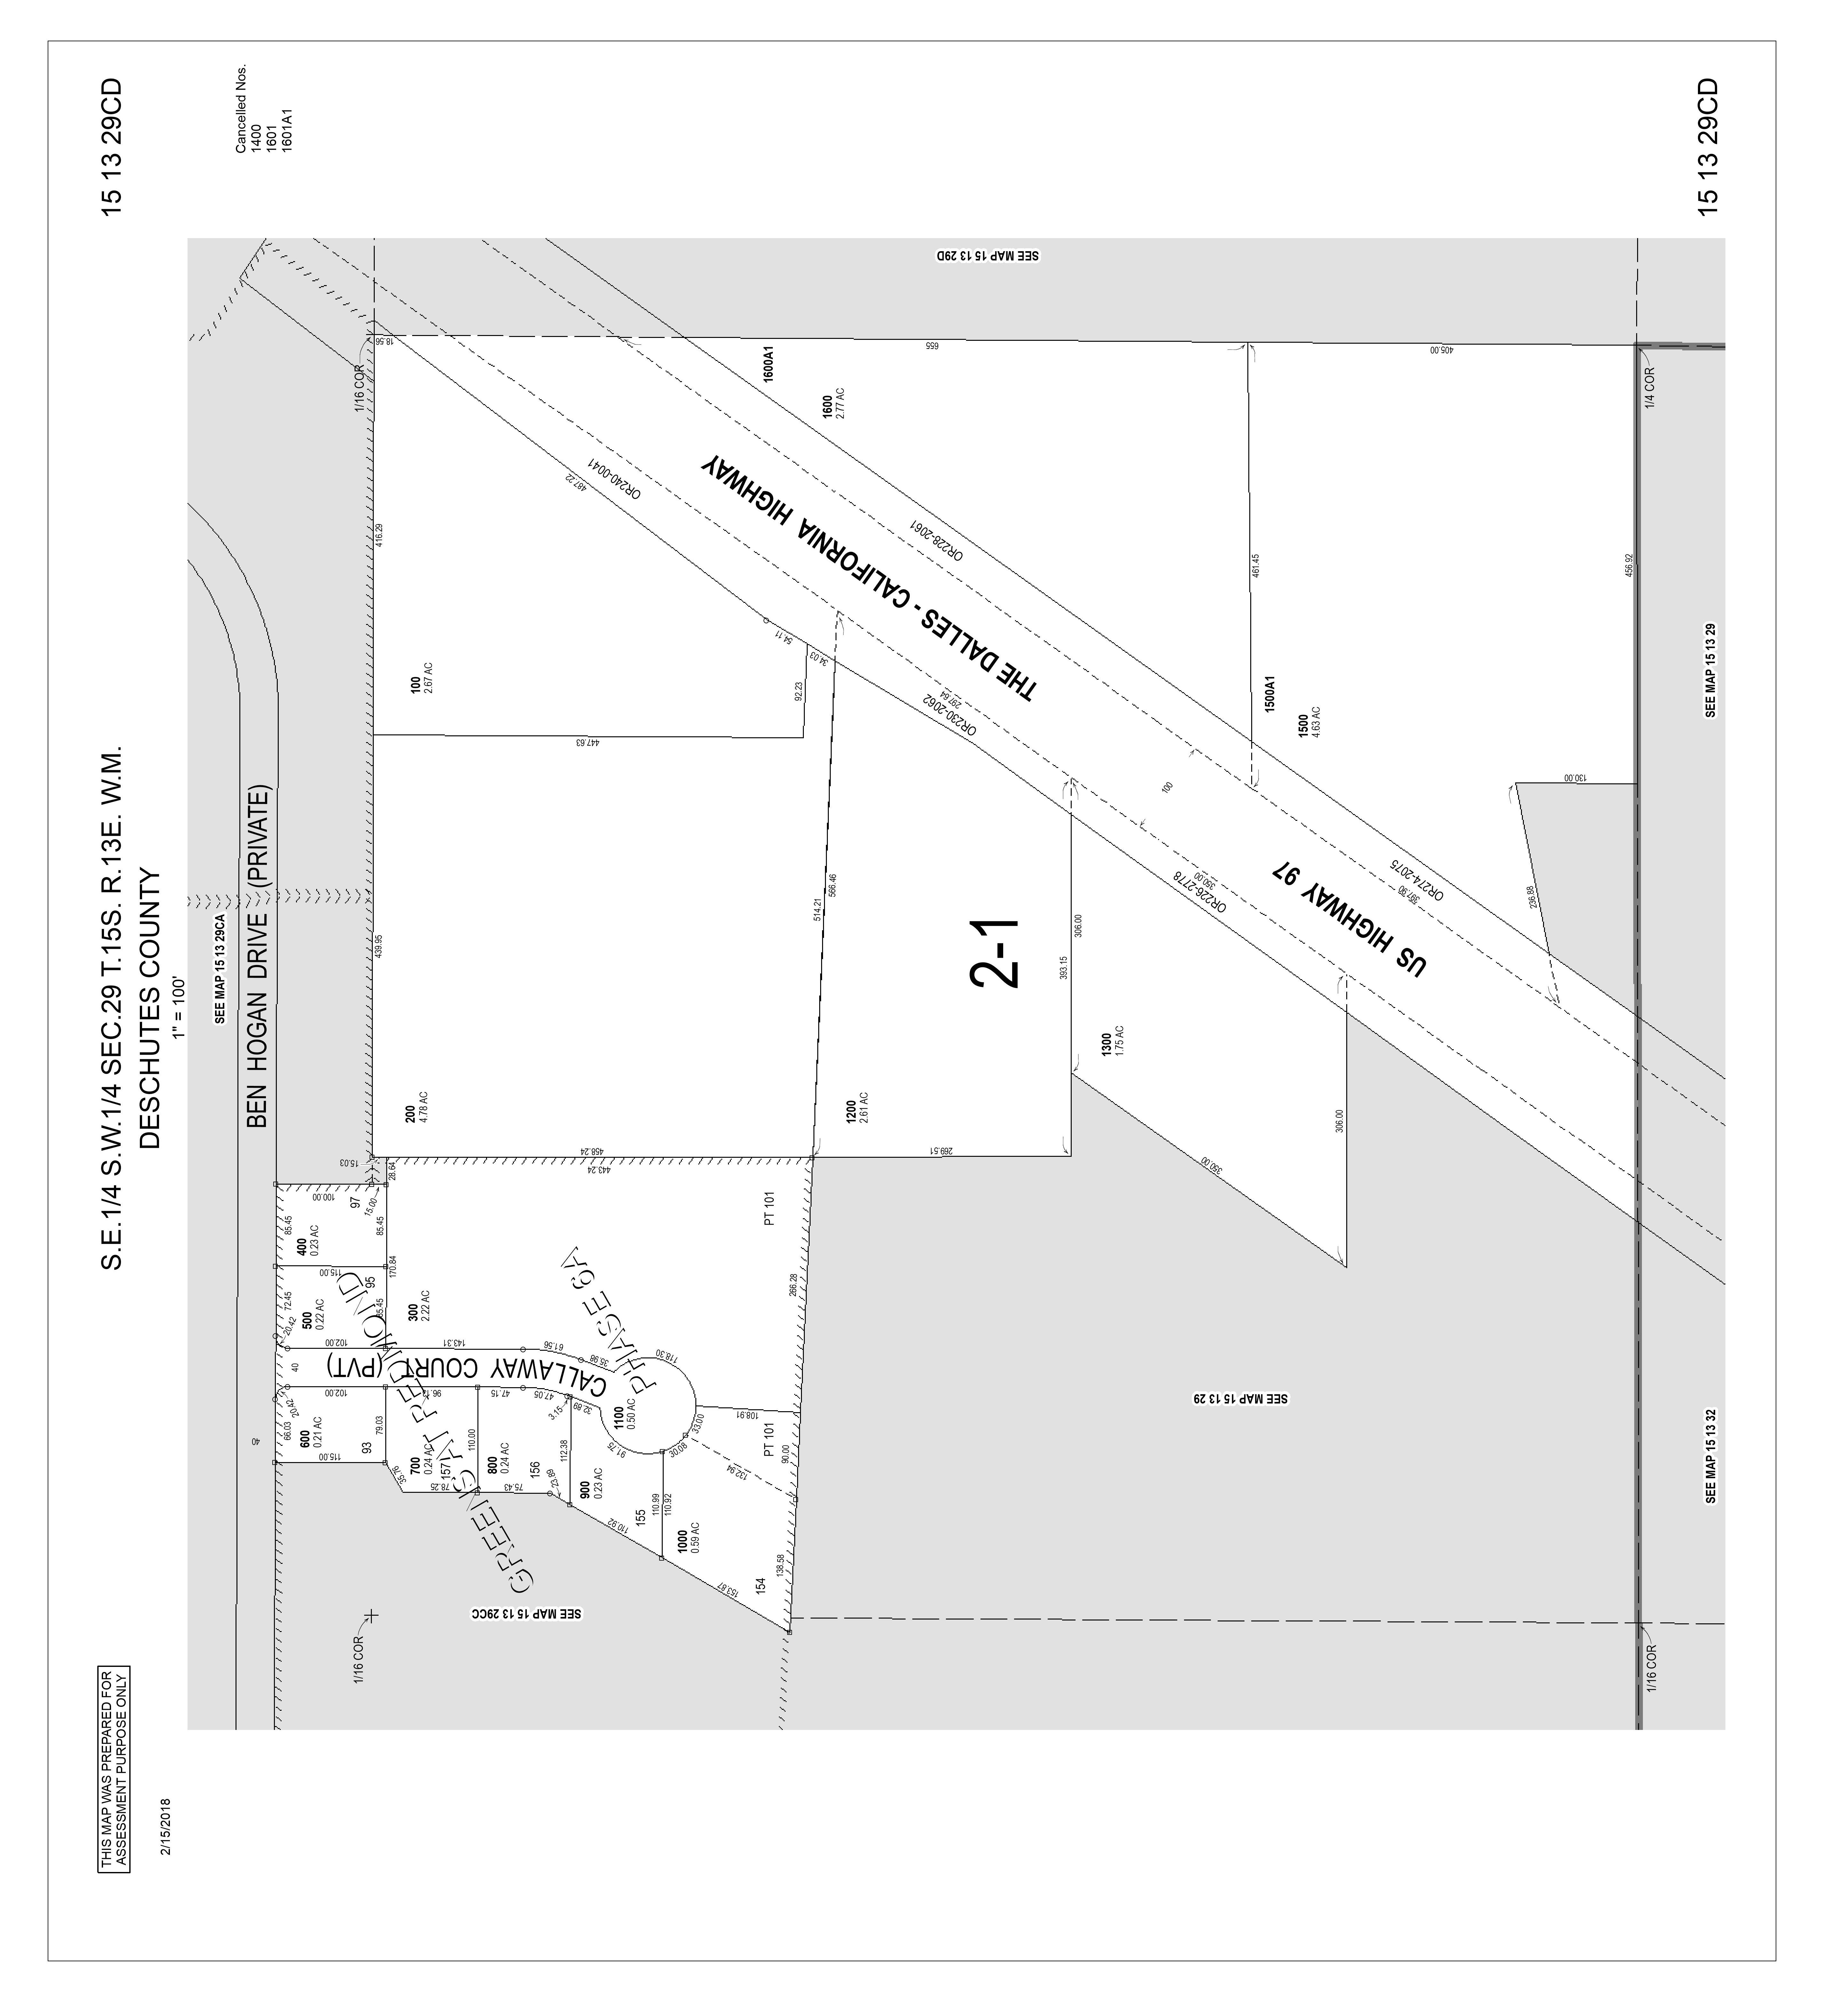
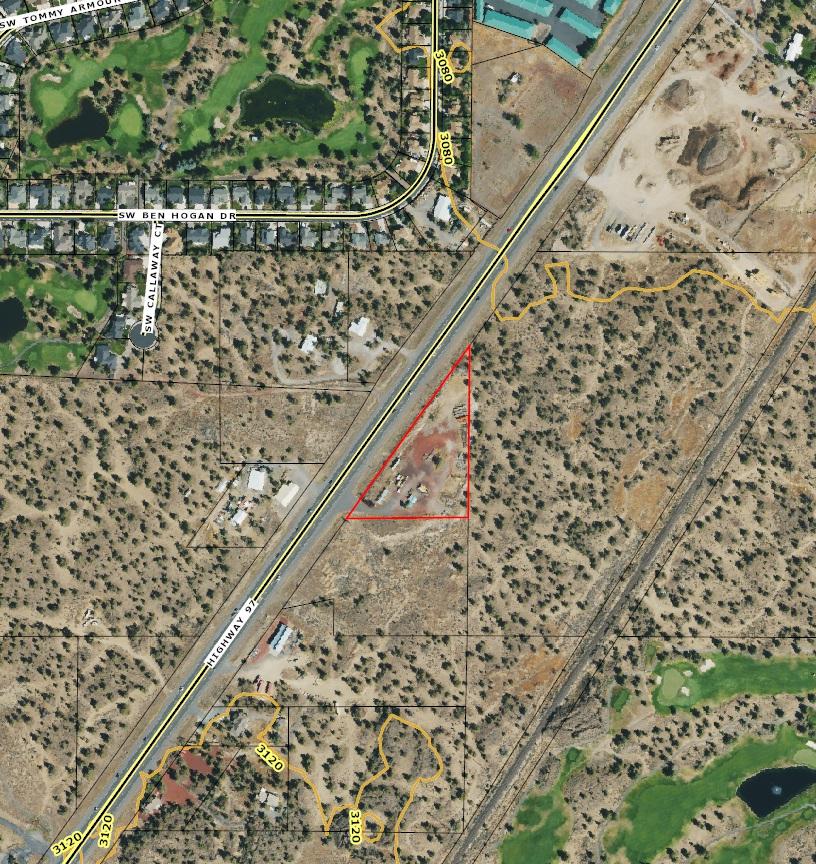
ParcelID:130165
TaxAccount#:151329CD01600
4422SHwy97, RedmondOR97756
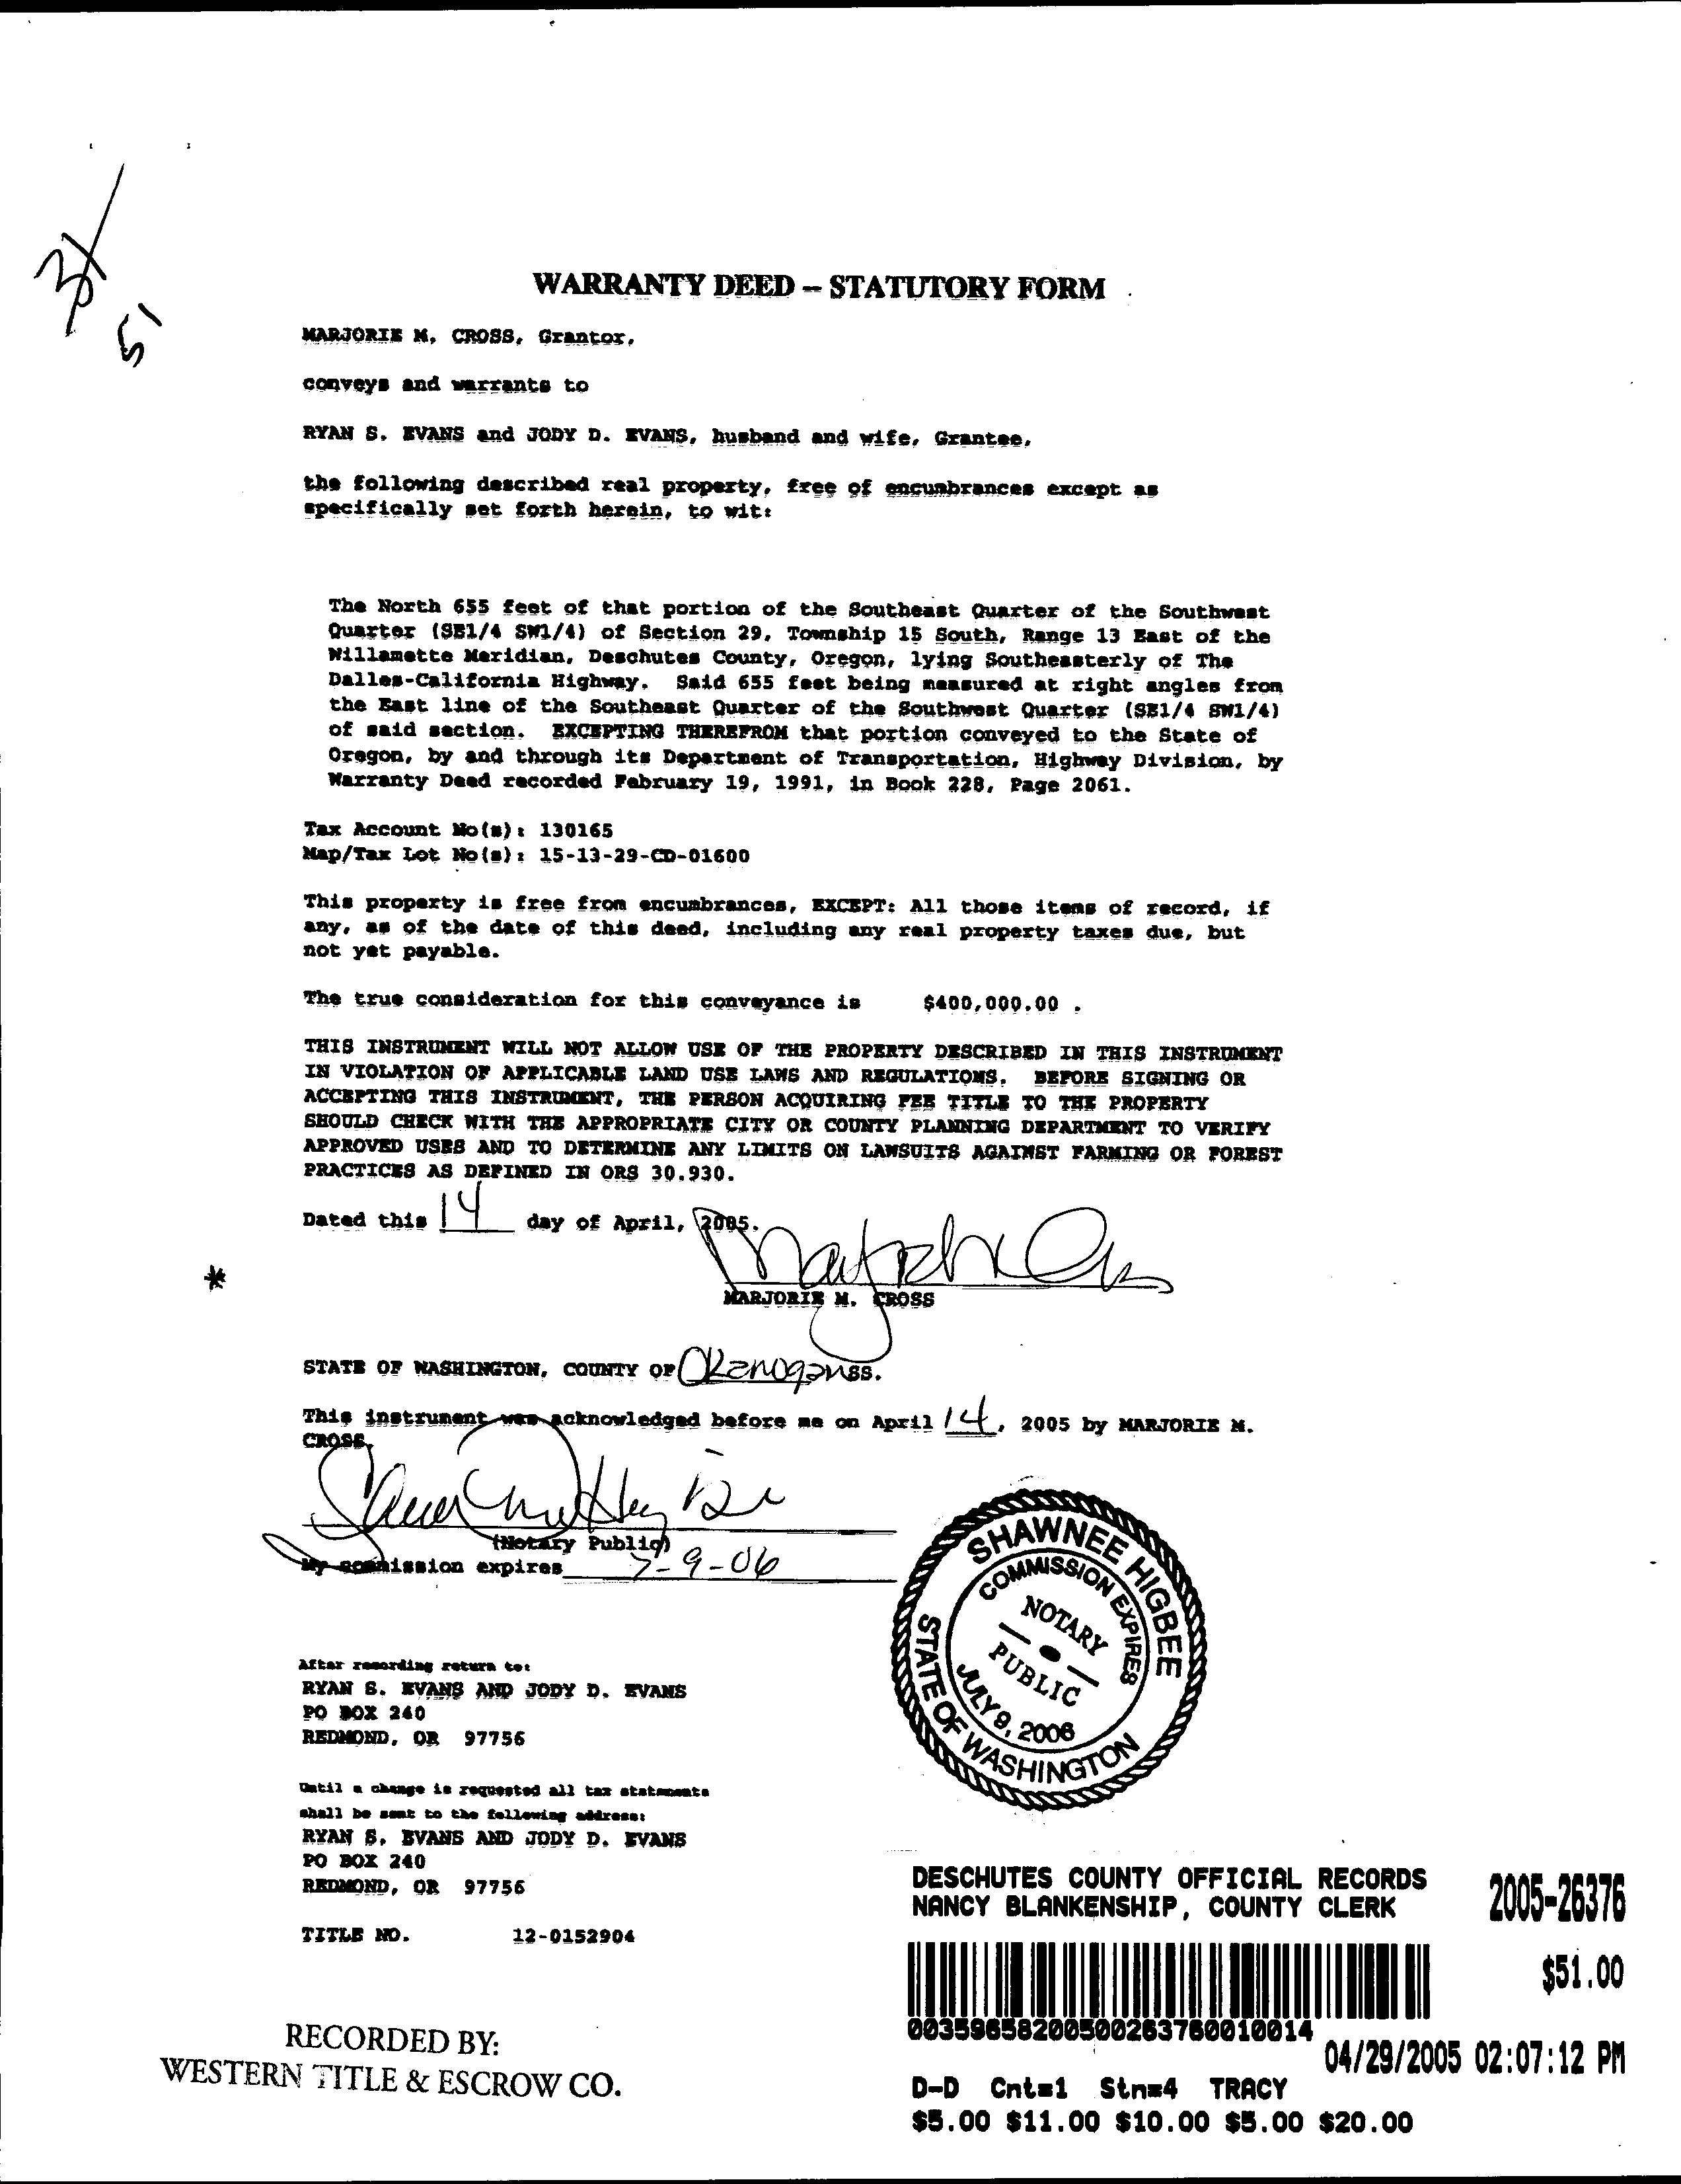
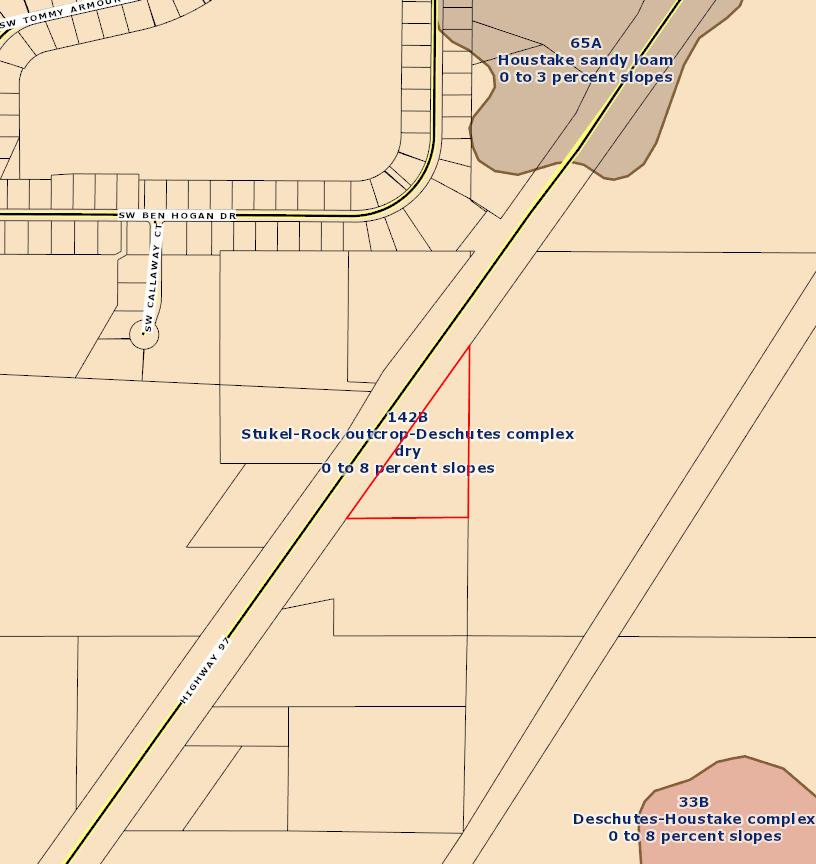
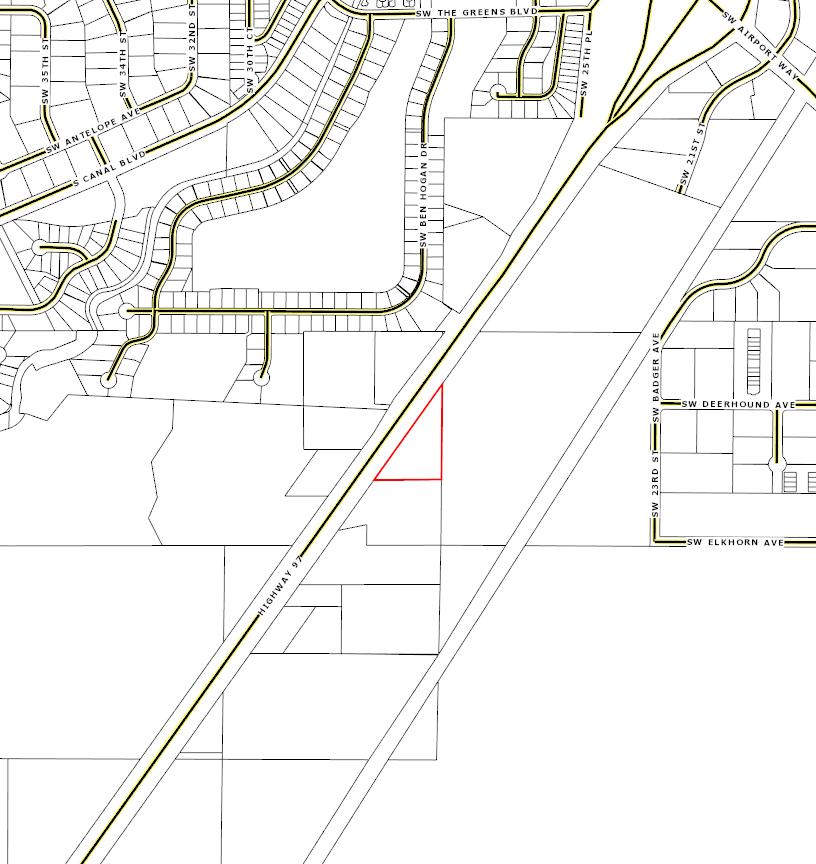
Thismap/platisbeingfurnishedasanaidinlocatingtheherein describedlandinrelationtoadjoiningstreets,naturalboundariesand otherland,andisnotasurveyofthelanddepictedExcepttotheextent apolicyoftitleinsuranceisexpresslymodifiedbyendorsement,ifany, thecompanydoesnotinsuredimensions,distances,locationof easements,acreageorothermattersshownthereon
ParcelID:130165
TaxAccount#:151329CD01600
4422SHwy97, RedmondOR97756
Thismap/platisbeingfurnishedasanaidinlocatingtheherein describedlandinrelationtoadjoiningstreets,naturalboundariesand otherland,andisnotasurveyofthelanddepictedExcepttotheextent apolicyoftitleinsuranceisexpresslymodifiedbyendorsement,ifany, thecompanydoesnotinsuredimensions,distances,locationof easements,acreageorothermattersshownthereon
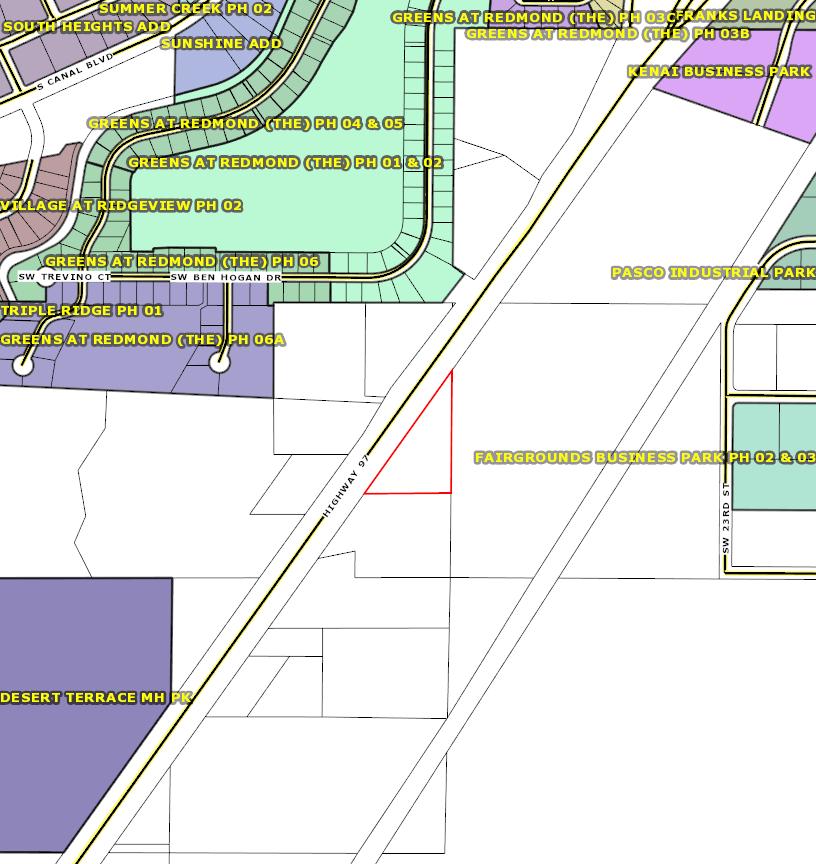
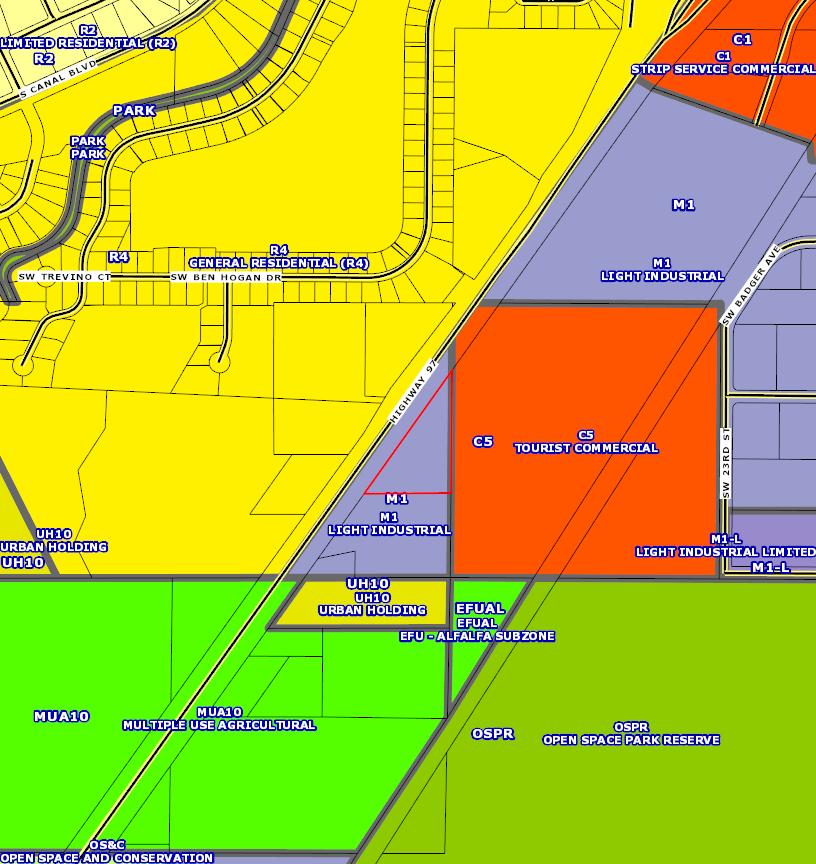
ZoningMap

Churc h of G od Seventh Day Rigo ber to 's Taco Shop Butler Ch iro practic's Black Bear Din er Redmon d Fire & Rescu e Initia tive Brewing Coun try No ok Cafe Salon West Bald y's BBQ Fir st Interstate Bank US Bank Eb erhar ds Dairy Prod ucts Loca l Paw s Wild Ride Brew in g & F ood Co urt Redmon d Airpo rt Deschu te s Co unty Fairg rou nds Juniper G of Co urse The Gre ens at Red mon d G olf Comfort Su ites Hotel Hampton Inn BestMed Urg ent Care Applebee 's Su per 8 Wynd ham Hotel Basx Yew Ave Self Stor age Northw est Self Storag e Coastal F arm & Ranc h Bi-M art Groc ery O utlet, Wilco, Ro ss & Wagn er Sq uare Miller Lumb er Dollar Tree & Ca rl's Jr Midstate Po wer Prod ucts Brad's Au to & Tru ck Parts Low es
M eyers Safew ay Walgre ens Surroundi ng Business es 44 22 S Hw y 97 , Redm ond BEND LA PIN E SISTERS REDMOND SUNR IVER 20 97 126 20 20 97 Map Data is deemed reliable but not guaranteed Deschutes County Tit e accepts no respons bility for accuracy 0 2,300 4,600 1,150 Feet 151329CD01600
Fred
REDMOND CODE
CHAPTER 8
DEVELOPMENT REGULATIONS
The contents of Chapter Development Regulations can be found here:
https://www.redmondoregon.gov/home/showpublisheddocument/3426/638091
082331730000
Deschutes County Code
https://deschutescounty.municipalcodeonline.com/book?type=ordinances#name
=TITLE_18_COUNTY_ZONING
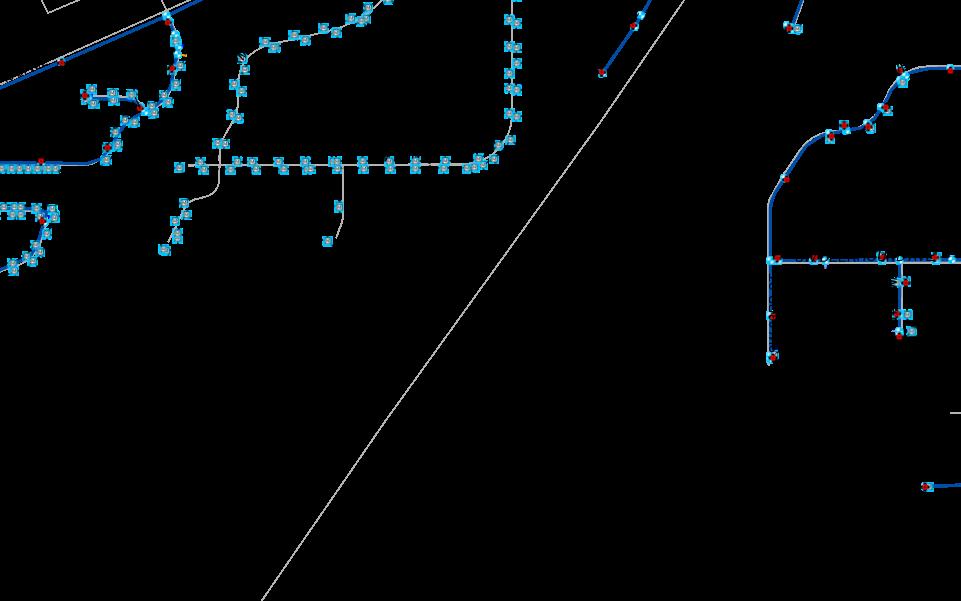
tButteCanal SW 36th St n WCanalBlvd Pilot Butte Canal SW Bad SW 36thSt SW Badg 20th St k Railroad n H o g a n D r Water Distribution - 4422 S Hwy 97 Esri, NASA, NGA, USGS, FEMA, Esri Community Maps Contributors, Oregon State Parks, State of Oregon GEO, © OpenStreetMap, Microsoft, REDMOND TAXLOTS STREET CENTERLINE STREET NAMES WATER LATERAL Commercial Domestic Fire HydrantLaterals Irrigation System Commercial/Fire GRAVITY MAIN SYSTEM VALVE METER HYDRANT 4/8/2024, 12:51:54 PM 0 0.1 0.2 0.05 mi 0 0.15 0.3 0.07 km 1:9,028 Web AppBuilder for ArcGIS Esri, NASA, NGA, USGS, FEMA | Esri Community Maps Contributors, Oregon State Parks, State of Oregon GEO, © OpenStreetMap, Microsoft, Esri, TomTom, Garmin, SafeGraph, GeoTechnologies, Inc, METI/NASA, USGS, Bureau of Land Management, EPA, NPS,
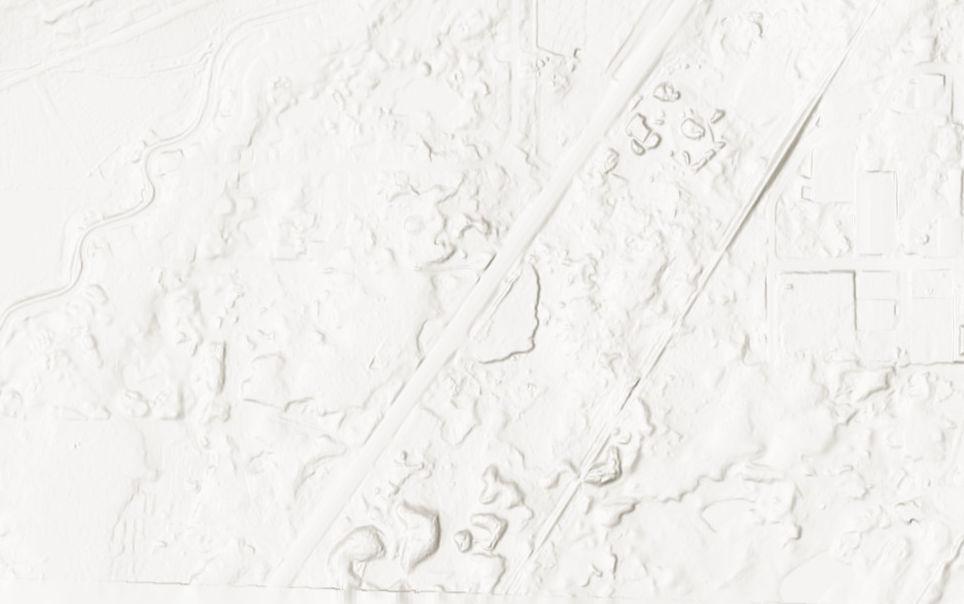
ilotButteCanal SW 36th St n SWCanalBlvd Pilot Butte Canal SW Badg SW 36thSt SW Badg 20th St nk Railroad n H o g a n D r Water Distribution - No Aerial - 4422 S Hwy 97 Esri, NASA, NGA, USGS, FEMA, Esri Community Maps Contributors, Oregon State Parks, State of Oregon GEO, © OpenStreetMap, Microsoft, REDMOND TAXLOTS STREET CENTERLINE STREET NAMES WATER LATERAL Commercial Domestic Fire HydrantLaterals Irrigation System Commercial/Fire GRAVITY MAIN SYSTEM VALVE METER HYDRANT 4/8/2024, 12:54:58 PM 0 0.1 0.2 0.05 mi 0 0.15 0.3 0.07 km 1:9,028 Web AppBuilder for ArcGIS Esri, NASA, NGA, USGS, FEMA | Esri Community Maps Contributors, Oregon State Parks, State of Oregon GEO, © OpenStreetMap, Microsoft, Esri, TomTom, Garmin, SafeGraph, GeoTechnologies, Inc, METI/NASA, USGS, Bureau of Land Management, EPA, NPS,
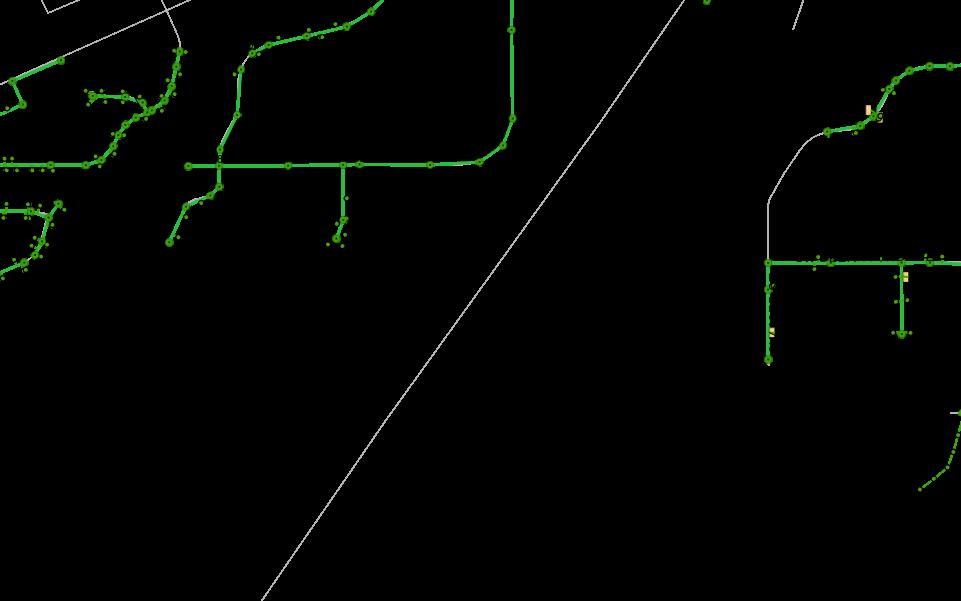
tButteCanal SW 36th St n WCanalBlvd Pilot Butte Canal SW Bad SW 36thSt SW Badg 20th St k Railroad n H o g a n D r Waste Water Collection System - 4422 S Hwy 97 Esri, NASA, NGA, USGS, FEMA, Esri Community Maps Contributors, Oregon State Parks, State of Oregon GEO, © OpenStreetMap, Microsoft, COLLECTION MAIN SAMPLING MANHOLES SERVICE LATERAL CLEAN OUT MANHOLE REDMOND TAXLOTS STREET CENTERLINE STREET NAMES 4/8/2024, 1:23:12 PM 0 0.1 0.2 0.05 mi 0 0.15 0.3 0.07 km 1:9,028 Web AppBuilder for ArcGIS Esri, NASA, NGA, USGS, FEMA | Esri Community Maps Contributors, Oregon State Parks, State of Oregon GEO, © OpenStreetMap, Microsoft, Esri, TomTom, Garmin, SafeGraph, GeoTechnologies, Inc, METI/NASA, USGS, Bureau of Land Management, EPA, NPS,
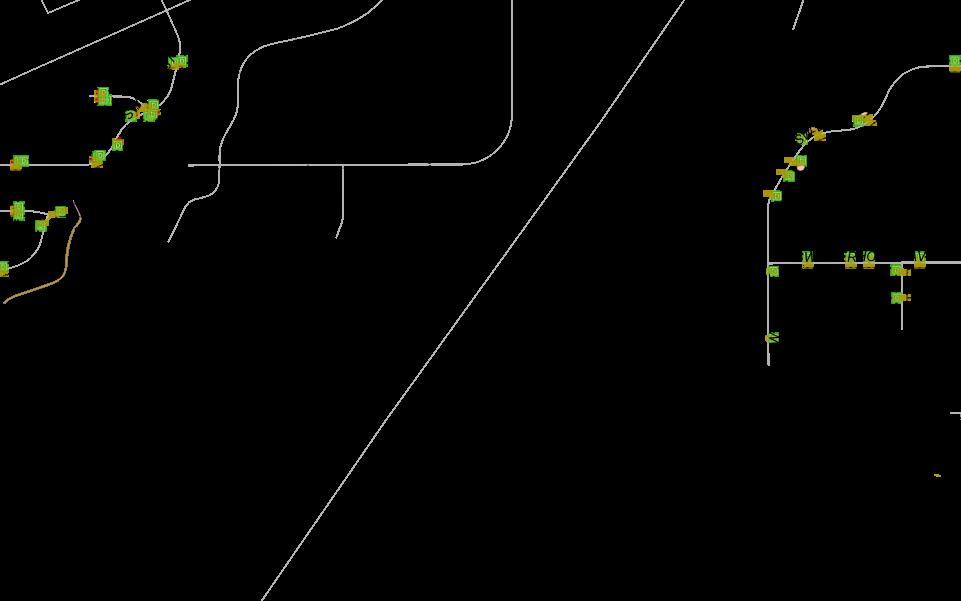
ilotButteCanal SW 36th St n SWCanalBlvd Pilot Butte Canal SW Badg SW 36thSt SW Badg 20th St nk Railroad n H o g a n D r Waste Water Collection System - No Aerial - 4422 S Hwy 97 Esri, NASA, NGA, USGS, FEMA, Esri Community Maps Contributors, Oregon State Parks, State of Oregon GEO, © OpenStreetMap, Microsoft, COLLECTION MAIN SAMPLING MANHOLES SERVICE LATERAL CLEAN OUT MANHOLE REDMOND TAXLOTS STREET CENTERLINE STREET NAMES 4/8/2024, 12:56:15 PM 0 0.1 0.2 0.05 mi 0 0.15 0.3 0.07 km 1:9,028 Web AppBuilder for ArcGIS Esri, NASA, NGA, USGS, FEMA | Esri Community Maps Contributors, Oregon State Parks, State of Oregon GEO, © OpenStreetMap, Microsoft, Esri, TomTom, Garmin, SafeGraph, GeoTechnologies, Inc, METI/NASA, USGS, Bureau of Land Management, EPA, NPS,
tButteCanal SW 36th St n WCanalBlvd Pilot Butte Canal SW Bad SW 36thSt SW Badg 20th St k Railroad n H o g a n D r Storm Water - 4422 S Hwy 97 Esri, NASA, NGA, USGS, FEMA, Esri Community Maps Contributors, Oregon State Parks, State of Oregon GEO, © OpenStreetMap, Microsoft, DETENTION BASINS INFILTRATION BASIN SWALE STORM PIPE ACCESS POINTS SEDIMENTATION MANHOLE STORM UIC FACILITIES DRYWELL CATCH BASINS DROP INLET REDMOND TAXLOTS STREET CENTERLINE STREET NAMES 4/8/2024, 1:24:19 PM 0 0.1 0.2 0.05 mi 0 0.15 0.3 0.07 km 1:9,028 Web AppBuilder for ArcGIS Esri, NASA, NGA, USGS, FEMA | Esri Community Maps Contributors, Oregon State Parks, State of Oregon GEO, © OpenStreetMap, Microsoft, Esri, TomTom, Garmin, SafeGraph, GeoTechnologies, Inc, METI/NASA, USGS, Bureau of Land Management, EPA, NPS,
ilotButteCanal SW 36th St n SWCanalBlvd Pilot Butte Canal SW Badg SW 36thSt SW Badg 20th St nk Railroad n H o g a n D r Storm Water No Aerial - 4422 S Hwy 97 Esri, NASA, NGA, USGS, FEMA, Esri Community Maps Contributors, Oregon State Parks, State of Oregon GEO, © OpenStreetMap, Microsoft, DETENTION BASINS INFILTRATION BASIN SWALE STORM PIPE ACCESS POINTS SEDIMENTATION MANHOLE STORM UIC FACILITIES DRYWELL CATCH BASINS DROP INLET REDMOND TAXLOTS STREET CENTERLINE STREET NAMES 4/8/2024, 1:25:18 PM 0 0.1 0.2 0.05 mi 0 0.15 0.3 0.07 km 1:9,028 Web AppBuilder for ArcGIS Esri, NASA, NGA, USGS, FEMA | Esri Community Maps Contributors, Oregon State Parks, State of Oregon GEO, © OpenStreetMap, Microsoft, Esri, TomTom, Garmin, SafeGraph, GeoTechnologies, Inc, METI/NASA, USGS, Bureau of Land Management, EPA, NPS,
tButteCanal SW 36th St n WCanalBlvd Pilot Butte Canal SW Bad SW 36thSt SW Badg 20th St k Railroad n H o g a n D r Natural Gas - 4422 S Hwy 97 Esri, NASA, NGA, USGS, FEMA, Esri Community Maps Contributors, Oregon State Parks, State of Oregon GEO, © OpenStreetMap, Microsoft, NATURAL GAS REDMOND TAXLOTS STREET CENTERLINE STREET NAMES 4/8/2024, 1:27:04 PM 0 0.1 0.2 0.05 mi 0 0.15 0.3 0.07 km 1:9,028 Web AppBuilder for ArcGIS Esri, NASA, NGA, USGS, FEMA | Esri Community Maps Contributors, Oregon State Parks, State of Oregon GEO, © OpenStreetMap, Microsoft, Esri, TomTom, Garmin, SafeGraph, GeoTechnologies, Inc, METI/NASA, USGS, Bureau of Land Management, EPA, NPS,
ilotButteCanal SW 36th St n SWCanalBlvd Pilot Butte Canal SW Badg SW 36thSt SW Badg 20th St nk Railroad n H o g a n D r Natural Gas No Aerial - 4422 S Hwy 97 Esri, NASA, NGA, USGS, FEMA, Esri Community Maps Contributors, Oregon State Parks, State of Oregon GEO, © OpenStreetMap, Microsoft, NATURAL GAS REDMOND TAXLOTS STREET CENTERLINE STREET NAMES 4/8/2024, 1:26:04 PM 0 0.1 0.2 0.05 mi 0 0.15 0.3 0.07 km 1:9,028 Web AppBuilder for ArcGIS Esri, NASA, NGA, USGS, FEMA | Esri Community Maps Contributors, Oregon State Parks, State of Oregon GEO, © OpenStreetMap, Microsoft, Esri, TomTom, Garmin, SafeGraph, GeoTechnologies, Inc, METI/NASA, USGS, Bureau of Land Management, EPA, NPS,

0 mi Site Map 4422 S Highway 97, Redmond, Oregon, 97756 2 Prepared by Esri 4422 S Highway 97, Redmond, Oregon, 97756 Latitude: 44.23435 Ring bands: 0-1, 1-3, 3-5 mile radii Longitude: -121.20029 April 11, 2024 ©2024 Esri Page 1 of 1

4422 S Highway 97, Redmond, Oregon, 97756 2 Prepared by Esri 4422 S Highway 97, Redmond, Oregon, 97756 Latitude: 44.23435 Ring band: 0 - 1 mile radius Longitude: -121.20029
ACS Estimate Percent MOE(±) Reliability TOTALS Total Population 1,824 476 Total Households 995 327 Total Housing Units 987 327 POPULATION AGE 3+ YEARS BY SCHOOL ENROLLMENT Total 1,808 100.0% 475 Enrolled in school 194 10 7% 136 Enrolled in nursery school, preschool 2 0 1% 92 Public school 1 0.1% 36 Private school 1 0 1% 57 Enrolled in kindergarten 1 0.1% 11 Public school 0 0.0% 10 Private school 0 0.0% 3 Enrolled in grade 1 to grade 4 42 2.3% 213 Public school 24 1.3% 61 Private school 18 1.0% 294 Enrolled in grade 5 to grade 8 66 3.7% 70 Public school 66 3.7% 70 Private school 0 0.0% 0 Enrolled in grade 9 to grade 12 10 0.6% 115 Public school 10 0.6% 115 Private school 0 0 0% 0 Enrolled in college undergraduate years 64 3.5% 101 Public school 64 3.5% 101 Private school 0 0.0% 0 Enrolled in graduate or professional school 9 0 5% 24 Public school 0 0.0% 0 Private school 9 0 5% 24 Not enrolled in school 1,615 89.3% 390 POPULATION AGE 65+ BY RELATIONSHIP AND HOUSEHOLD TYPE Total 767 100.0% 395 Living in Households 733 95 6% 388 Living in Family Households 518 67.5% 261 Householder 313 40 8% 158 Spouse 188 24 5% 131 Parent 0 0.0% 1 Parent-in-law 0 0 0% 0 Other Relative 16 2.1% 36 Nonrelative 1 0 1% 38 Living in Nonfamily Households 215 28 0% 298 Householder 208 27.1% 296 Nonrelative 7 0.9% 16 Living in Group Quarters 34 4 4% 66 Source: U.S. Census Bureau, 2017-2021 American Community Survey Reliability: high medium low April 11, 2024 ©2024 Esri Page 1 of 24
ACS Population Summary
2017-2021
4422 S Highway 97, Redmond, Oregon, 97756 2 Prepared by Esri 4422 S Highway 97, Redmond, Oregon, 97756 Latitude: 44.23435 Ring band: 0 - 1 mile radius Longitude: -121.20029
ACS Population Summary
ACS Estimate Percent MOE(±) Reliability HOUSEHOLDS BY TYPE AND SIZE Family Households 551 55 4% 174 2-Person 412 41.4% 178 3-Person 92 9.2% 88 4-Person 35 3.5% 52 5-Person 1 0.1% 44 6-Person 8 0.8% 134 7+ Person 3 0.3% 52 Nonfamily Households 443 44 5% 336 1-Person 375 37 7% 335 2-Person 65 6.5% 97 3-Person 2 0.2% 30 4-Person 2 0.2% 63 5-Person 0 0.0% 0 6-Person 0 0.0% 0 7+ Person 0 0.0% 0 HOUSEHOLDS BY PRESENCE OF PEOPLE UNDER 18 YEARS BY HOUSEHOLD TYPE Households with one or more people under 18 years 106 10.7% 82 Family households 105 10.6% 81 Married-couple family 68 6.8% 74 Male householder, no wife present 5 0.5% 52 Female householder, no husband present 32 3.2% 52 Nonfamily households 1 0.1% 11 Households with no people under 18 years 889 89.3% 332 Married-couple family 377 37.9% 164 Other family 69 6.9% 114 Nonfamily households 443 44.5% 337 HOUSEHOLDS BY PRESENCE OF PEOPLE 65 YEARS AND OVER, HOUSEHOLD SIZE AND HOUSEHOLD TYPE Households with Pop 65+ 573 57.6% 328 1-Person 224 22.5% 298 2+ Person Family 345 34.7% 158 2+ Person Nonfamily 4 0.4% 8 Households with No Pop 65+ 422 42.4% 191 1-Person 150 15.1% 179 2+ Person Family 207 20.8% 115 2+ Person Nonfamily 65 6.5% 91 HOUSEHOLD TYPE BY RELATIVES AND NONRELATIVES FOR POPULATION IN HOUSEHOLDS POPULATION IN HOUSEHOLDS Total 1,775 100.0% 468 In Family Households 1,293 72 8% 414 In Married-Couple Family 1,035 58 3% 393 Relatives 1,033 58 2% 392 Nonrelatives 2 0.1% 27 In Male Householder-No Spouse Present-Family 29 1.6% 275 Relatives 13 0.7% 130 Nonrelatives 16 0.9% 227 In Female Householder-No Spouse Present-Family 229 12 9% 306 Relatives 229 12.9% 306 Nonrelatives 0 0.0% 0 In Nonfamily Households 482 27 2% 359 Source: U.S. Census Bureau, 2017-2021 American Community Survey Reliability: high medium low April 11, 2024 ©2024 Esri Page 2 of 24
2017-2021
4422 S Highway 97, Redmond, Oregon, 97756 2 Prepared by Esri 4422 S Highway 97, Redmond, Oregon, 97756 Latitude: 44.23435 Ring band: 0 - 1 mile radius Longitude: -121.20029 2017-2021 ACS Estimate Percent MOE(±) Reliability POPULATION AGE 5+ YEARS BY LANGUAGE SPOKEN AT HOME AND ABILITY TO SPEAK ENGLISH Total 1,792 100.0% 476 5 to 17 years Speak only English 126 7 0% 154 Speak Spanish 11 0.6% 135 Speak English "very well" or "well" 11 0.6% 135 Speak English "not well" 0 0.0% 0 Speak English "not at all" 0 0 0% 0 Speak other Indo-European languages 0 0.0% 0 Speak English "very well" or "well" 0 0.0% 0 Speak English "not well" 0 0.0% 0 Speak English "not at all" 0 0 0% 0 Speak Asian and Pacific Island languages 0 0.0% 0 Speak English "very well" or "well" 0 0.0% 0 Speak English "not well" 0 0.0% 0 Speak English "not at all" 0 0 0% 0 Speak other languages 0 0.0% 0 Speak English "very well" or "well" 0 0.0% 0 Speak English "not well" 0 0.0% 0 Speak English "not at all" 0 0 0% 0 18 to 64 years Speak only English 849 47.4% 308 Speak Spanish 25 1.4% 299 Speak English "very well" or "well" 7 0.4% 67 Speak English "not well" 12 0.7% 184 Speak English "not at all" 6 0 3% 108 Speak other Indo-European languages 9 0.5% 156 Speak English "very well" or "well" 9 0.5% 155 Speak English "not well" 0 0.0% 0 Speak English "not at all" 0 0 0% 0 Speak Asian and Pacific Island languages 5 0.3% 71 Speak English "very well" or "well" 4 0.2% 57 Speak English "not well" 1 0.1% 15 Speak English "not at all" 0 0 0% 0 Speak other languages 0 0.0% 0 Speak English "very well" or "well" 0 0.0% 0 Speak English "not well" 0 0.0% 0 Speak English "not at all" 0 0 0% 0 65 years and over Speak only English 691 38 6% 397 Speak Spanish 47 2.6% 113 Speak English "very well" or "well" 47 2.6% 113 Speak English "not well" 0 0.0% 0 Speak English "not at all" 0 0 0% 0 Speak other Indo-European languages 0 0.0% 0 Speak English "very well" or "well" 0 0.0% 0 Speak English "not well" 0 0.0% 0 Speak English "not at all" 0 0 0% 0 Speak Asian and Pacific Island languages 28 1.6% 74 Speak English "very well" or "well" 28 1.6% 74 Speak English "not well" 0 0.0% 0 Speak English "not at all" 0 0 0% 0 Speak other languages 0 0.0% 0 Speak English "very well" or "well" 0 0.0% 0 Speak English "not well" 0 0.0% 0 Speak English "not at all" 0 0 0% 0
ACS Population Summary
Reliability: high medium low April 11, 2024 ©2024 Esri Page 3 of 24
Source: U.S. Census Bureau, 2017-2021 American Community Survey
4422 S Highway 97, Redmond, Oregon, 97756 2 Prepared by Esri 4422 S Highway 97, Redmond, Oregon, 97756 Latitude: 44.23435 Ring band: 0 - 1 mile radius Longitude: -121.20029 2017-2021 ACS Estimate Percent MOE(±) Reliability WORKERS AGE 16+ YEARS BY PLACE OF WORK Total 732 100.0% 313 Worked in state and in county of residence 653 89.2% 278 Worked in state and outside county of residence 49 6 7% 80 Worked outside state of residence 30 4.1% 61 SEX BY CLASS OF WORKER FOR THE CIVILIAN EMPLOYED POPULATION 16 YEARS AND OVER Total: 743 100.0% 318 Male: 383 51 5% 190 Employee of private company workers 242 32 6% 128 Self-employed in own incorporated business workers 101 13 6% 169 Private not-for-profit wage and salary workers 6 0.8% 16 Local government workers 5 0.7% 13 State government workers 20 2.7% 59 Federal government workers 1 0.1% 18 Self-employed in own not incorporated business workers 9 1 2% 118 Unpaid family workers 0 0.0% 0 Female: 360 48 5% 196 Employee of private company workers 250 33 6% 156 Self-employed in own incorporated business workers 6 0.8% 74 Private not-for-profit wage and salary workers 18 2.4% 33 Local government workers 71 9.6% 147 State government workers 0 0.0% 0 Federal government workers 1 0.1% 19 Self-employed in own not incorporated business workers 15 2.0% 32 Unpaid family workers 0 0 0% 0 POPULATION IN HOUSEHOLDS AND PRESENCE OF A COMPUTER Total 1,775 100.0% 468 Population <18 in Households 169 9 5% 130 Have a Computer 168 9.5% 272 Have NO Computer 1 0.1% 20 Population 18-64 in Households 873 49 2% 302 Have a Computer 836 47 1% 305 Have NO Computer 37 2 1% 89 Population 65+ in Households 733 41 3% 388 Have a Computer 561 31.6% 256 Have NO Computer 172 9 7% 323 HOUSEHOLDS AND INTERNET SUBSCRIPTIONS Total 995 100.0% 327 With an Internet Subscription 815 81.9% 198 Dial-Up Alone 5 0 5% 22 Broadband 751 75 5% 200 Satellite Service 19 1 9% 27 Other Service 1 0 1% 26 Internet Access with no Subscription 26 2.6% 58 With No Internet Access 153 15 4% 297 Source: U.S. Census Bureau, 2017-2021 American Community Survey Reliability: high medium low April 11, 2024 ©2024 Esri Page 4 of 24
ACS Population Summary
4422 S Highway 97, Redmond, Oregon, 97756 2 Prepared by Esri 4422 S Highway 97, Redmond, Oregon, 97756 Latitude: 44.23435 Ring band: 0 - 1 mile radius Longitude: -121.20029
ACS Estimate Percent MOE(±) Reliability WORKERS AGE 16+ YEARS BY MEANS OF TRANSPORTATION TO WORK Total 732 100.0% 313 Drove alone 499 68 2% 280 Carpooled 20 2.7% 153 Public transportation (excluding taxicab) 1 0.1% 74 Bus or trolley bus 1 0.1% 74 Light rail, streetcar or trolley 0 0.0% 0 Subway or elevated 0 0.0% 0 Long-distance/Commuter Train 0 0.0% 0 Ferryboat 0 0.0% 0 Taxicab 1 0.1% 57 Motorcycle 48 6.6% 120 Bicycle 71 9.7% 163 Walked 2 0.3% 27 Other means 5 0.7% 13 Worked at home 86 11.7% 99 WORKERS AGE 16+ YEARS (WHO DID NOT WORK FROM HOME) BY TRAVEL TIME TO WORK Total 647 100.0% 290 Less than 5 minutes 132 20 4% 173 5 to 9 minutes 93 14.4% 99 10 to 14 minutes 150 23 2% 159 15 to 19 minutes 62 9 6% 75 20 to 24 minutes 68 10 5% 74 25 to 29 minutes 82 12 7% 109 30 to 34 minutes 26 4.0% 124 35 to 39 minutes 15 2 3% 27 40 to 44 minutes 2 0.3% 64 45 to 59 minutes 16 2 5% 40 60 to 89 minutes 1 0.2% 30 90 or more minutes 1 0 2% 21 Average Travel Time to Work (in minutes) N/A N/A FEMALES AGE 20-64 YEARS BY AGE OF OWN CHILDREN AND EMPLOYMENT STATUS Total 387 100.0% 187 Own children under 6 years only 26 6.7% 41 In labor force 25 6.5% 42 Not in labor force 1 0.3% 25 Own children under 6 years and 6 to 17 years 16 4 1% 135 In labor force 5 1.3% 76 Not in labor force 11 2.8% 151 Own children 6 to 17 years only 58 15.0% 65 In labor force 45 11.6% 64 Not in labor force 12 3.1% 22 No own children under 18 years 287 74 2% 160 In labor force 221 57.1% 152 Not in labor force 66 17.1% 65
ACS Population Summary
2017-2021
April 11, 2024 ©2024 Esri Page 5 of 24
Source: U.S. Census Bureau, 2017-2021 American Community Survey Reliability: high medium low
4422 S Highway 97, Redmond, Oregon, 97756 2 Prepared by Esri 4422 S Highway 97, Redmond, Oregon, 97756 Latitude: 44.23435 Ring band: 0 - 1 mile radius Longitude: -121.20029 2017-2021 ACS Estimate Percent MOE(±) Reliability CIVILIAN NONINSTITUTIONALIZED POPULATION BY AGE & TYPES OHEALINSURANCE COVERAGE OF HEALTH INSURANCE COVERAGE Total 1,822 100.0% 476 Under 19 years: 209 11 5% 231 One Type of Health Insurance: 168 9 2% 259 Employer-Based Health Ins Only 46 2.5% 81 Direct-Purchase Health Ins Only 38 2 1% 92 Medicare Coverage Only 0 0.0% 0 Medicaid Coverage Only 85 4 7% 469 TRICARE/Military Hlth Cov Only 0 0.0% 0 VA Health Care Only 0 0.0% 0 2+ Types of Health Insurance 38 2.1% 64 No Health Insurance Coverage 2 0.1% 50 19 to 34 years: 238 13.1% 191 One Type of Health Insurance: 210 11.5% 185 Employer-Based Health Ins Only 164 9.0% 185 Direct-Purchase Health Ins Only 30 1.6% 57 Medicare Coverage Only 0 0.0% 0 Medicaid Coverage Only 15 0 8% 81 TRICARE/Military Hlth Cov Only 1 0.1% 33 VA Health Care Only 1 0 1% 9 2+ Types of Health Insurance 23 1.3% 42 No Health Insurance Coverage 5 0 3% 93 35 to 64 years: 609 33 4% 234 One Type of Health Insurance: 377 20 7% 183 Employer-Based Health Ins Only 268 14 7% 170 Direct-Purchase Health Ins Only 26 1.4% 89 Medicare Coverage Only 0 0.0% 0 Medicaid Coverage Only 79 4 3% 119 TRICARE/Military Hlth Cov Only 0 0.0% 22 VA Health Care Only 3 0 2% 46 2+ Types of Health Insurance 133 7.3% 122 No Health Insurance Coverage 99 5.4% 143 65+ years: 765 42.0% 395 One Type of Health Insurance: 451 24.8% 378 Employer-Based Health Ins Only 15 0.8% 39 Direct-Purchase Health Ins Only 0 0.0% 0 Medicare Coverage Only 437 24 0% 377 TRICARE/Military Hlth Cov Only 0 0 0% 0 VA Health Care Only 0 0.0% 0 2+ Types of Health Insurance: 314 17 2% 170 Employer-Based & Direct-Purchase Health Insurance 0 0.0% 0 Employer-Based Health & Medicare Insurance 67 3.7% 118 Direct-Purchase Health & Medicare Insurance 82 4.5% 121 Medicare & Medicaid Coverage 20 1.1% 23 Other Private Health Insurance Combos 0 0.0% 0 Other Public Health Insurance Combos 19 1.0% 37 Other Health Insurance Combinations 126 6.9% 113 No Health Insurance Coverage 0 0.0% 0
ACS Population Summary
Reliability: high medium low April 11, 2024 ©2024 Esri Page 6 of 24
Source: U.S. Census Bureau, 2017-2021 American Community Survey
4422 S Highway 97, Redmond, Oregon, 97756 2 Prepared by Esri 4422 S Highway 97, Redmond, Oregon, 97756 Latitude: 44.23435 Ring band: 0 - 1 mile radius Longitude: -121.20029
ACS Estimate Percent MOE(±) Reliability POPULATION BY RATIO OF INCOME TO POVERTY LEVEL Total 1,818 100.0% 476 Under 50 55 3.0% 62 50 to 99 72 4.0% 89 1 00 to 1 24 177 9.7% 313 1 25 to 1 49 44 2 4% 90 1 50 to 1 84 80 4.4% 414 1 85 to 1 99 4 0 2% 52 2 00 and over 1,384 76 1% 437 CIVILIAN POPULATION AGE 18 OR OLDER BY VETERAN STATUS Total 1,655 100.0% 439 Veteran 208 12.6% 154 Nonveteran 1,447 87.4% 420 Male 728 44 0% 181 Veteran 207 12 5% 155 Nonveteran 521 31 5% 187 Female 927 56 0% 343 Veteran 1 0.1% 45 Nonveteran 926 56 0% 343 CIVILIAN VETERANS AGE 18 OR OLDER BY PERIOD OF MILITARY SERVICE Total 208 100.0% 154 Gulf War (9/01 or later), no Gulf War (8/90 to 8/01), no Vietnam Era 35 16 8% 57 Gulf War (9/01 or later) and Gulf War (8/90 to 8/01), no Vietnam Era 1 0.5% 18 Gulf War (9/01 or later), and Gulf War (8/90 to 8/01), and Vietnam Era 0 0.0% 0 Gulf War (8/90 to 8/01), no Vietnam Era 1 0.5% 19 Gulf War (8/90 to 8/01) and Vietnam Era 0 0.0% 0 Vietnam Era, no Korean War, no World War II 124 59 6% 127 Vietnam Era and Korean War, no World War II 0 0.0% 0 Vietnam Era and Korean War and World War II 0 0.0% 0 Korean War, no Vietnam Era, no World War II 15 7.2% 38 Korean War and World War II, no Vietnam Era 0 0 0% 0 World War II, no Korean War, no Vietnam Era 1 0.5% 41 Between Gulf War and Vietnam Era only 3 1.4% 7 Between Vietnam Era and Korean War only 29 13 9% 55 Between Korean War and World War II only 0 0.0% 0 Pre-World War II only 0 0.0% 0 HOUSEHOLDS BY POVERTY STATUS Total 995 100.0% 327 Income in the past 12 months below poverty level 47 4.7% 53 Married-couple family 18 1.8% 38 Other family - male householder (no wife present) 0 0.0% 0 Other family - female householder (no husband present) 11 1.1% 21 Nonfamily household - male householder 1 0.1% 15 Nonfamily household - female householder 17 1.7% 29 Income in the past 12 months at or above poverty level 948 95 3% 334 Married-couple family 428 43 0% 166 Other family - male householder (no wife present) 6 0.6% 68 Other family - female householder (no husband present) 89 8.9% 127 Nonfamily household - male householder 156 15.7% 162 Nonfamily household - female householder 270 27 1% 301 Poverty Index 38 Source: U.S. Census Bureau, 2017-2021 American Community Survey Reliability: high medium low April 11, 2024 ©2024 Esri Page 7 of 24
ACS Population Summary
2017-2021
Data Note: N/A means not available Population by Ratio of Income to Poverty Level represents persons for whom poverty status is determined. Household income represents income in 2021, adjusted for inflation
2017-2021 ACS Estimate: The American Community Survey (ACS) replaces census sample data. Esri is releasing the 2017-2021 ACS estimates, five-year period data collected monthly from January 1, 2017 through December 31, 2021. Although the ACS includes many of the subjects previously covered by the decennial census sample, there are significant differences between the two surveys including fundamental differences in survey design and residency rules
Margin of error (MOE): The MOE is a measure of the variability of the estimate due to sampling error. MOEs enable the data user to measure the range of uncertainty for each estimate with 90 percent confidence. The range of uncertainty is called the confidence interval, and it is calculated by taking the estimate +/- the MOE. For example, if the ACS reports an estimate of 100 with an MOE of +/- 20, then you can be 90 percent certain the value for the whole population falls between 80 and 120.
Reliability: These symbols represent threshold values that Esri has established from the Coefficients of Variation (CV) to designate the usability of the estimates. The CV measures the amount of sampling error relative to the size of the estimate, expressed as a percentage
High Reliability: Small CVs (less than or equal to 12 percent) are flagged green to indicate that the sampling error is small relative to the estimate and the estimate is reasonably reliable.
Medium Reliability: Estimates with CVs between 12 and 40 are flagged yellow-use with caution.
Low Reliability: Large CVs (over 40 percent) are flagged red to indicate that the sampling error is large relative to the estimate. The estimate is considered very unreliable.
Source: U.S. Census Bureau, 2017-2021 American Community Survey Reliability: high medium low April 11,
4422 S Highway 97, Redmond, Oregon, 97756 2 Prepared by Esri 4422 S Highway 97, Redmond, Oregon, 97756 Latitude: 44.23435 Ring band: 0 - 1 mile radius Longitude: -121.20029
ACS Estimate Percent MOE(±) Reliability HOUSEHOLDS BY OTHER INCOME Social Security Income 585 58 8% 331 No Social Security Income 410 41.2% 196 Retirement Income 269 27 0% 152 No Retirement Income 726 73 0% 333 GROSS RENT AS A PERCENTAGE OF HOUSEHOLD INCOME IN THE PAST 12 MONTHS <10% of Income 0 0.0% 0 10-14 9% of Income 10 2.8% 82 15-19 9% of Income 1 0 3% 21 20-24 9% of Income 50 13 9% 96 25-29.9% of Income 4 1.1% 51 30-34 9% of Income 4 1.1% 68 35-39 9% of Income 1 0 3% 50 40-49 9% of Income 66 18 3% 135 50+% of Income 212 58 9% 304 Gross Rent % Inc Not Computed 11 3.1% 22 HOUSEHOLDS BY PUBLIC ASSISTANCE INCOME IN THE PAST 12 MONTHS Total 995 100.0% 327 With public assistance income 25 2.5% 44 No public assistance income 970 97.5% 322 HOUSEHOLDS BY FOOD STAMPS/SNAP STATUS Total 995 100.0% 327 With Food Stamps/SNAP 73 7.3% 94 With No Food Stamps/SNAP 922 92.7% 342 HOUSEHOLDS BY DISABILITY STATUS Total 995 100.0% 327 With 1+ Persons w/Disability 430 43.2% 321 With No Person w/Disability 565 56.8% 221
ACS Population Summary
2017-2021
©2024 Esri Page 8 of 24
2024
4422 S Highway 97, Redmond, Oregon, 97756 2 Prepared by Esri 4422 S Highway 97, Redmond, Oregon, 97756 Latitude: 44.23435 Ring band: 1 - 3 mile radius Longitude: -121.20029 2017-2021 ACS Estimate Percent MOE(±) Reliability TOTALS Total Population 20,240 1,433 Total Households 7,332 485 Total Housing Units 7,433 485 POPULATION AGE 3+ YEARS BY SCHOOL ENROLLMENT Total 19,411 100.0% 1,419 Enrolled in school 4,599 23 7% 618 Enrolled in nursery school, preschool 296 1 5% 191 Public school 171 0.9% 152 Private school 125 0 6% 115 Enrolled in kindergarten 237 1.2% 175 Public school 225 1 2% 175 Private school 12 0.1% 20 Enrolled in grade 1 to grade 4 1,205 6.2% 329 Public school 841 4.3% 304 Private school 364 1 9% 223 Enrolled in grade 5 to grade 8 1,283 6.6% 295 Public school 1,198 6 2% 276 Private school 85 0.4% 98 Enrolled in grade 9 to grade 12 1,089 5 6% 288 Public school 1,018 5.2% 280 Private school 71 0.4% 71 Enrolled in college undergraduate years 426 2.2% 130 Public school 360 1.9% 108 Private school 66 0.3% 75 Enrolled in graduate or professional school 63 0 3% 56 Public school 14 0.1% 22 Private school 49 0.3% 51 Not enrolled in school 14,812 76.3% 780 POPULATION AGE 65+ BY RELATIONSHIP AND HOUSEHOLD TYPE Total 2,144 100.0% 277 Living in Households 2,070 96 5% 274 Living in Family Households 1,373 64 0% 241 Householder 728 34 0% 143 Spouse 504 23 5% 121 Parent 10 0.5% 13 Parent-in-law 7 0 3% 37 Other Relative 74 3.5% 54 Nonrelative 50 2.3% 48 Living in Nonfamily Households 697 32 5% 145 Householder 664 31.0% 144 Nonrelative 34 1.6% 36 Living in Group Quarters 73 3 4% 40
ACS Population Summary
high medium low April 11, 2024 ©2024 Esri Page 9 of 24
Source: U.S. Census Bureau, 2017-2021 American Community Survey Reliability:
4422 S Highway 97, Redmond, Oregon, 97756 2 Prepared by Esri 4422 S Highway 97, Redmond, Oregon, 97756 Latitude: 44.23435 Ring band: 1 - 3 mile radius Longitude: -121.20029
ACS Population Summary
ACS Estimate Percent MOE(±) Reliability HOUSEHOLDS BY TYPE AND SIZE Family Households 4,731 64 5% 429 2-Person 1,547 21.1% 239 3-Person 1,433 19 5% 229 4-Person 989 13 5% 341 5-Person 373 5 1% 141 6-Person 284 3.9% 126 7+ Person 104 1.4% 50 Nonfamily Households 2,602 35 5% 363 1-Person 1,717 23 4% 278 2-Person 682 9.3% 273 3-Person 164 2 2% 83 4-Person 38 0.5% 62 5-Person 0 0.0% 0 6-Person 0 0.0% 0 7+ Person 0 0.0% 0 HOUSEHOLDS BY PRESENCE OF PEOPLE UNDER 18 YEARS BY HOUSEHOLD TYPE Households with one or more people under 18 years 2,818 38.4% 387 Family households 2,801 38.2% 387 Married-couple family 1,927 26.3% 360 Male householder, no wife present 415 5.7% 105 Female householder, no husband present 459 6.3% 216 Nonfamily households 18 0.2% 16 Households with no people under 18 years 4,514 61.6% 374 Married-couple family 1,486 20.3% 176 Other family 444 6.1% 148 Nonfamily households 2,584 35.2% 363 HOUSEHOLDS BY PRESENCE OF PEOPLE 65 YEARS AND OVER, HOUSEHOLD SIZE AND HOUSEHOLD TYPE Households with Pop 65+ 1,508 20.6% 194 1-Person 616 8.4% 141 2+ Person Family 858 11.7% 147 2+ Person Nonfamily 34 0.5% 31 Households with No Pop 65+ 5,824 79.4% 493 1-Person 1,101 15.0% 258 2+ Person Family 3,872 52.8% 418 2+ Person Nonfamily 850 11.6% 281 HOUSEHOLD TYPE BY RELATIVES AND NONRELATIVES FOR POPULATION IN HOUSEHOLDS POPULATION IN HOUSEHOLDS Total 20,126 100.0% 1,434 In Family Households 16,243 80 7% 1,403 In Married-Couple Family 12,282 61 0% 1,389 Relatives 12,061 59 9% 1,378 Nonrelatives 221 1.1% 148 In Male Householder-No Spouse Present-Family 1,710 8.5% 462 Relatives 1,203 6 0% 299 Nonrelatives 507 2.5% 218 In Female Householder-No Spouse Present-Family 2,251 11 2% 599 Relatives 2,073 10.3% 569 Nonrelatives 178 0 9% 164 In Nonfamily Households 3,883 19 3% 646
U.S. Census Bureau, 2017-2021 American Community Survey Reliability: high medium low April 11, 2024 ©2024 Esri Page 10 of 24
2017-2021
Source:
4422 S Highway 97, Redmond, Oregon, 97756 2 Prepared by Esri 4422 S Highway 97, Redmond, Oregon, 97756 Latitude: 44.23435 Ring band: 1 - 3 mile radius Longitude: -121.20029
ACS Estimate Percent MOE(±) Reliability POPULATION AGE 5+ YEARS BY LANGUAGE SPOKEN AT HOME AND ABILITY TO SPEAK ENGLISH Total 19,027 100.0% 1,419 5 to 17 years Speak only English 3,305 17 4% 572 Speak Spanish 742 3.9% 385 Speak English "very well" or "well" 710 3.7% 385 Speak English "not well" 32 0.2% 59 Speak English "not at all" 0 0 0% 0 Speak other Indo-European languages 3 0.0% 8 Speak English "very well" or "well" 3 0.0% 8 Speak English "not well" 0 0.0% 0 Speak English "not at all" 0 0 0% 0 Speak Asian and Pacific Island languages 19 0.1% 35 Speak English "very well" or "well" 0 0.0% 0 Speak English "not well" 19 0.1% 35 Speak English "not at all" 0 0 0% 0 Speak other languages 0 0.0% 0 Speak English "very well" or "well" 0 0.0% 0 Speak English "not well" 0 0.0% 0 Speak English "not at all" 0 0 0% 0 18 to 64 years Speak only English 11,067 58.2% 916 Speak Spanish 1,511 7.9% 405 Speak English "very well" or "well" 979 5 1% 384 Speak English "not well" 441 2.3% 246 Speak English "not at all" 92 0 5% 121 Speak other Indo-European languages 140 0.7% 149 Speak English "very well" or "well" 140 0 7% 148 Speak English "not well" 0 0.0% 0 Speak English "not at all" 0 0 0% 0 Speak Asian and Pacific Island languages 96 0.5% 69 Speak English "very well" or "well" 80 0.4% 59 Speak English "not well" 16 0.1% 27 Speak English "not at all" 0 0 0% 0 Speak other languages 0 0.0% 0 Speak English "very well" or "well" 0 0.0% 0 Speak English "not well" 0 0.0% 0 Speak English "not at all" 0 0 0% 0 65 years and over Speak only English 1,979 10 4% 275 Speak Spanish 48 0.3% 76 Speak English "very well" or "well" 31 0.2% 109 Speak English "not well" 0 0.0% 0 Speak English "not at all" 17 0 1% 74 Speak other Indo-European languages 71 0.4% 201 Speak English "very well" or "well" 70 0.4% 207 Speak English "not well" 0 0.0% 2 Speak English "not at all" 0 0 0% 0 Speak Asian and Pacific Island languages 47 0.2% 36 Speak English "very well" or "well" 25 0.1% 55 Speak English "not well" 22 0.1% 37 Speak English "not at all" 0 0 0% 0 Speak other languages 0 0.0% 0 Speak English "very well" or "well" 0 0.0% 0 Speak English "not well" 0 0.0% 0 Speak English "not at all" 0 0 0% 0
ACS Population Summary
2017-2021
Reliability: high medium low April 11, 2024 ©2024 Esri Page 11 of 24
Source: U.S. Census Bureau, 2017-2021 American Community Survey
4422 S Highway 97, Redmond, Oregon, 97756 2 Prepared by Esri 4422 S Highway 97, Redmond, Oregon, 97756 Latitude: 44.23435 Ring band: 1 - 3 mile radius Longitude: -121.20029
ACS Estimate Percent MOE(±) Reliability WORKERS AGE 16+ YEARS BY PLACE OF WORK Total 10,213 100.0% 951 Worked in state and in county of residence 9,443 92.5% 944 Worked in state and outside county of residence 660 6 5% 187 Worked outside state of residence 110 1.1% 54 SEX BY CLASS OF WORKER FOR THE CIVILIAN EMPLOYED POPULATION 16 YEARS AND OVER Total: 10,435 100.0% 942 Male: 5,442 52 2% 565 Employee of private company workers 3,990 38 2% 533 Self-employed in own incorporated business workers 310 3.0% 121 Private not-for-profit wage and salary workers 233 2.2% 105 Local government workers 82 0.8% 60 State government workers 123 1 2% 94 Federal government workers 96 0.9% 61 Self-employed in own not incorporated business workers 608 5 8% 190 Unpaid family workers 0 0.0% 0 Female: 4,993 47 8% 503 Employee of private company workers 3,240 31 0% 464 Self-employed in own incorporated business workers 190 1 8% 48 Private not-for-profit wage and salary workers 597 5.7% 215 Local government workers 504 4.8% 153 State government workers 78 0.7% 100 Federal government workers 55 0.5% 69 Self-employed in own not incorporated business workers 322 3.1% 89 Unpaid family workers 5 0 0% 23 POPULATION IN HOUSEHOLDS AND PRESENCE OF A COMPUTER Total 20,126 100.0% 1,434 Population <18 in Households 5,282 26 2% 625 Have a Computer 5,169 25 7% 622 Have NO Computer 113 0.6% 147 Population 18-64 in Households 12,773 63 5% 976 Have a Computer 12,559 62 4% 987 Have NO Computer 214 1.1% 140 Population 65+ in Households 2,070 10 3% 274 Have a Computer 1,818 9.0% 254 Have NO Computer 252 1 3% 164 HOUSEHOLDS AND INTERNET SUBSCRIPTIONS Total 7,332 100.0% 485 With an Internet Subscription 6,794 92.7% 494 Dial-Up Alone 46 0 6% 53 Broadband 5,539 75 5% 477 Satellite Service 574 7.8% 141 Other Service 38 0 5% 31 Internet Access with no Subscription 34 0.5% 29 With No Internet Access 504 6 9% 134 Source: U.S. Census Bureau, 2017-2021 American Community Survey Reliability: high medium low April 11, 2024 ©2024 Esri Page 12 of 24
ACS Population Summary
2017-2021
4422 S Highway 97, Redmond, Oregon, 97756 2 Prepared by Esri 4422 S Highway 97, Redmond, Oregon, 97756 Latitude: 44.23435 Ring band: 1 - 3 mile radius Longitude: -121.20029
ACS Estimate Percent MOE(±) Reliability WORKERS AGE 16+ YEARS BY MEANS OF TRANSPORTATION TO WORK Total 10,213 100.0% 951 Drove alone 8,215 80 4% 932 Carpooled 831 8 1% 177 Public transportation (excluding taxicab) 69 0.7% 64 Bus or trolley bus 69 0.7% 64 Light rail, streetcar or trolley 0 0.0% 0 Subway or elevated 0 0.0% 0 Long-distance/Commuter Train 0 0.0% 0 Ferryboat 0 0.0% 0 Taxicab 38 0.4% 74 Motorcycle 33 0.3% 111 Bicycle 58 0.6% 126 Walked 161 1 6% 67 Other means 102 1.0% 128 Worked at home 706 6 9% 145 WORKERS AGE 16+ YEARS (WHO DID NOT WORK FROM HOME) BY TRAVEL TIME TO WORK Total 9,507 100.0% 958 Less than 5 minutes 499 5.2% 116 5 to 9 minutes 1,554 16.3% 233 10 to 14 minutes 1,695 17 8% 435 15 to 19 minutes 607 6 4% 187 20 to 24 minutes 1,651 17 4% 374 25 to 29 minutes 1,429 15 0% 392 30 to 34 minutes 1,335 14.0% 319 35 to 39 minutes 190 2 0% 95 40 to 44 minutes 225 2.4% 93 45 to 59 minutes 139 1 5% 61 60 to 89 minutes 47 0.5% 44 90 or more minutes 136 1 4% 93 Average Travel Time to Work (in minutes) N/A N/A FEMALES AGE 20-64 YEARS BY AGE OF OWN CHILDREN AND EMPLOYMENT STATUS Total 6,419 100.0% 522 Own children under 6 years only 675 10.5% 226 In labor force 553 8 6% 192 Not in labor force 122 1.9% 123 Own children under 6 years and 6 to 17 years 497 7 7% 153 In labor force 302 4.7% 144 Not in labor force 195 3 0% 127 Own children 6 to 17 years only 1,379 21.5% 376 In labor force 1,105 17 2% 358 Not in labor force 274 4.3% 112 No own children under 18 years 3,868 60 3% 401 In labor force 3,133 48.8% 382 Not in labor force 735 11 5% 155
Reliability: high medium low April 11, 2024 ©2024 Esri Page 13 of 24
ACS Population Summary
2017-2021
Source: U.S. Census Bureau, 2017-2021 American Community Survey
4422 S Highway 97, Redmond, Oregon, 97756 2 Prepared by Esri 4422 S Highway 97, Redmond, Oregon, 97756 Latitude: 44.23435 Ring band: 1 - 3 mile radius Longitude: -121.20029 2017-2021 ACS Estimate Percent MOE(±) Reliability CIVILIAN NONINSTITUTIONALIZED POPULATION BY AGE & TYPES OHEALINSURANCE COVERAGE OF HEALTH INSURANCE COVERAGE Total 20,208 100.0% 1,433 Under 19 years: 5,626 27 8% 657 One Type of Health Insurance: 5,129 25 4% 614 Employer-Based Health Ins Only 1,359 6.7% 293 Direct-Purchase Health Ins Only 570 2 8% 382 Medicare Coverage Only 0 0.0% 0 Medicaid Coverage Only 3,198 15 8% 510 TRICARE/Military Hlth Cov Only 2 0.0% 26 VA Health Care Only 0 0.0% 0 2+ Types of Health Insurance 432 2.1% 199 No Health Insurance Coverage 64 0.3% 42 19 to 34 years: 4,133 20.5% 614 One Type of Health Insurance: 3,112 15.4% 388 Employer-Based Health Ins Only 2,043 10 1% 311 Direct-Purchase Health Ins Only 261 1 3% 186 Medicare Coverage Only 0 0.0% 0 Medicaid Coverage Only 764 3 8% 164 TRICARE/Military Hlth Cov Only 35 0.2% 47 VA Health Care Only 8 0 0% 15 2+ Types of Health Insurance 434 2.1% 234 No Health Insurance Coverage 587 2 9% 297 35 to 64 years: 8,334 41 2% 824 One Type of Health Insurance: 5,942 29 4% 791 Employer-Based Health Ins Only 3,782 18 7% 683 Direct-Purchase Health Ins Only 956 4 7% 349 Medicare Coverage Only 128 0.6% 84 Medicaid Coverage Only 965 4 8% 247 TRICARE/Military Hlth Cov Only 50 0.2% 36 VA Health Care Only 61 0 3% 45 2+ Types of Health Insurance 1,303 6.4% 319 No Health Insurance Coverage 1,088 5.4% 302 65+ years: 2,115 10.5% 276 One Type of Health Insurance: 833 4.1% 245 Employer-Based Health Ins Only 50 0.2% 50 Direct-Purchase Health Ins Only 1 0.0% 14 Medicare Coverage Only 782 3.9% 245 TRICARE/Military Hlth Cov Only 0 0 0% 0 VA Health Care Only 0 0.0% 0 2+ Types of Health Insurance: 1,275 6 3% 176 Employer-Based & Direct-Purchase Health Insurance 0 0.0% 0 Employer-Based Health & Medicare Insurance 150 0 7% 57 Direct-Purchase Health & Medicare Insurance 499 2.5% 168 Medicare & Medicaid Coverage 123 0 6% 43 Other Private Health Insurance Combos 0 0.0% 0 Other Public Health Insurance Combos 36 0.2% 23 Other Health Insurance Combinations 467 2.3% 99 No Health Insurance Coverage 7 0.0% 13
ACS Population Summary
April 11, 2024 ©2024 Esri Page 14 of 24
Source: U.S. Census Bureau, 2017-2021 American Community Survey Reliability: high
medium low
4422 S Highway 97, Redmond, Oregon, 97756 2 Prepared by Esri 4422 S Highway 97, Redmond, Oregon, 97756 Latitude: 44.23435 Ring band: 1 - 3 mile radius Longitude: -121.20029
ACS Population Summary
ACS Estimate Percent MOE(±) Reliability POPULATION BY RATIO OF INCOME TO POVERTY LEVEL Total 20,020 100.0% 1,433 Under 50 608 3.0% 241 50 to 99 1,132 5 7% 348 1 00 to 1 24 641 3.2% 224 1 25 to 1 49 1,404 7 0% 588 1 50 to 1 84 2,138 10 7% 638 1 85 to 1 99 495 2 5% 510 2 00 and over 13,602 67 9% 1,337 CIVILIAN POPULATION AGE 18 OR OLDER BY VETERAN STATUS Total 14,957 100.0% 984 Veteran 982 6.6% 154 Nonveteran 13,975 93.4% 967 Male 6,941 46 4% 579 Veteran 849 5 7% 129 Nonveteran 6,092 40 7% 583 Female 8,016 53 6% 559 Veteran 133 0.9% 92 Nonveteran 7,883 52 7% 558 CIVILIAN VETERANS AGE 18 OR OLDER BY PERIOD OF MILITARY SERVICE Total 982 100.0% 154 Gulf War (9/01 or later), no Gulf War (8/90 to 8/01), no Vietnam Era 236 24 0% 90 Gulf War (9/01 or later) and Gulf War (8/90 to 8/01), no Vietnam Era 47 4.8% 33 Gulf War (9/01 or later), and Gulf War (8/90 to 8/01), and Vietnam Era 0 0.0% 0 Gulf War (8/90 to 8/01), no Vietnam Era 148 15.1% 98 Gulf War (8/90 to 8/01) and Vietnam Era 0 0.0% 0 Vietnam Era, no Korean War, no World War II 365 37 2% 64 Vietnam Era and Korean War, no World War II 0 0.0% 0 Vietnam Era and Korean War and World War II 0 0.0% 0 Korean War, no Vietnam Era, no World War II 15 1.5% 24 Korean War and World War II, no Vietnam Era 0 0 0% 0 World War II, no Korean War, no Vietnam Era 34 3.5% 59 Between Gulf War and Vietnam Era only 114 11 6% 84 Between Vietnam Era and Korean War only 22 2.2% 45 Between Korean War and World War II only 0 0.0% 0 Pre-World War II only 0 0.0% 0
2017-2021
Total 7,332 100.0% 485 Income in the past 12 months below poverty level 642 8.8% 180 Married-couple family 71 1.0% 45 Other family - male householder (no wife present) 131 1.8% 97 Other family - female householder (no husband present) 110 1 5% 54 Nonfamily household - male householder 91 1.2% 75 Nonfamily household - female householder 239 3.3% 125 Income in the past 12 months at or above poverty level 6,690 91 2% 486 Married-couple family 3,342 45 6% 390 Other family - male householder (no wife present) 359 4.9% 90 Other family - female householder (no husband present) 718 9.8% 241 Nonfamily household - male householder 797 10.9% 203 Nonfamily household - female householder 1,474 20 1% 301 Poverty Index 71 Source: U.S. Census Bureau, 2017-2021 American Community Survey Reliability: high medium low April 11, 2024 ©2024 Esri Page 15 of 24
HOUSEHOLDS BY POVERTY STATUS
Data Note: N/A means not available Population by Ratio of Income to Poverty Level represents persons for whom poverty status is determined. Household income represents income in 2021, adjusted for inflation
2017-2021 ACS Estimate: The American Community Survey (ACS) replaces census sample data. Esri is releasing the 2017-2021 ACS estimates, five-year period data collected monthly from January 1, 2017 through December 31, 2021. Although the ACS includes many of the subjects previously covered by the decennial census sample, there are significant differences between the two surveys including fundamental differences in survey design and residency rules
Margin of error (MOE): The MOE is a measure of the variability of the estimate due to sampling error. MOEs enable the data user to measure the range of uncertainty for each estimate with 90 percent confidence. The range of uncertainty is called the confidence interval, and it is calculated by taking the estimate +/- the MOE. For example, if the ACS reports an estimate of 100 with an MOE of +/- 20, then you can be 90 percent certain the value for the whole population falls between 80 and 120.
Reliability: These symbols represent threshold values that Esri has established from the Coefficients of Variation (CV) to designate the usability of the estimates. The CV measures the amount of sampling error relative to the size of the estimate, expressed as a percentage
High Reliability: Small CVs (less than or equal to 12 percent) are flagged green to indicate that the sampling error is small relative to the estimate and the estimate is reasonably reliable.
Medium Reliability: Estimates with CVs between 12 and 40 are flagged yellow-use with caution.
Low Reliability: Large CVs (over 40 percent) are flagged red to indicate that the sampling error is large relative to the estimate. The estimate is considered very unreliable.
Source: U.S. Census Bureau, 2017-2021 American Community Survey
Reliability: high medium low April 11, 2024
4422 S Highway 97, Redmond, Oregon, 97756 2 Prepared by Esri 4422 S Highway 97, Redmond, Oregon, 97756 Latitude: 44.23435 Ring band: 1 - 3 mile radius Longitude: -121.20029
ACS Estimate Percent MOE(±) Reliability HOUSEHOLDS BY OTHER INCOME Social Security Income 1,966 26 8% 239 No Social Security Income 5,367 73.2% 478 Retirement Income 978 13 3% 178 No Retirement Income 6,354 86 7% 496 GROSS RENT AS A PERCENTAGE OF HOUSEHOLD INCOME IN THE PAST 12 MONTHS <10% of Income 90 3.3% 106 10-14 9% of Income 301 10 9% 95 15-19 9% of Income 453 16 4% 210 20-24 9% of Income 321 11 7% 149 25-29.9% of Income 315 11.4% 117 30-34 9% of Income 174 6.3% 88 35-39 9% of Income 382 13 9% 270 40-49 9% of Income 247 9.0% 61 50+% of Income 410 14 9% 125 Gross Rent % Inc Not Computed 62 2.3% 43 HOUSEHOLDS BY PUBLIC ASSISTANCE INCOME IN THE PAST 12 MONTHS Total 7,332 100.0% 485 With public assistance income 242 3.3% 109 No public assistance income 7,090 96.7% 489 HOUSEHOLDS BY FOOD STAMPS/SNAP STATUS Total 7,332 100.0% 485 With Food Stamps/SNAP 1,416 19.3% 241 With No Food Stamps/SNAP 5,916 80.7% 481 HOUSEHOLDS BY DISABILITY STATUS Total 7,332 100.0% 485 With 1+ Persons w/Disability 1,901 25.9% 237 With No Person w/Disability 5,432 74.1% 516
ACS Population Summary
2017-2021
©2024 Esri Page 16 of 24
4422 S Highway 97, Redmond, Oregon, 97756 2 Prepared by Esri 4422 S Highway 97, Redmond, Oregon, 97756 Latitude: 44.23435 Ring band: 3 - 5 mile radius Longitude: -121.20029 2017-2021 ACS Estimate Percent MOE(±) Reliability TOTALS Total Population 16,105 657 Total Households 6,546 227 Total Housing Units 7,121 232 POPULATION AGE 3+ YEARS BY SCHOOL ENROLLMENT Total 15,638 100.0% 634 Enrolled in school 2,950 18 9% 262 Enrolled in nursery school, preschool 218 1 4% 37 Public school 150 1.0% 39 Private school 68 0.4% 28 Enrolled in kindergarten 31 0.2% 20 Public school 9 0.1% 16 Private school 22 0.1% 26 Enrolled in grade 1 to grade 4 668 4.3% 95 Public school 596 3.8% 96 Private school 73 0.5% 51 Enrolled in grade 5 to grade 8 765 4.9% 109 Public school 634 4 1% 105 Private school 132 0.8% 42 Enrolled in grade 9 to grade 12 690 4 4% 139 Public school 620 4.0% 139 Private school 71 0.5% 25 Enrolled in college undergraduate years 506 3.2% 109 Public school 460 2.9% 111 Private school 46 0.3% 48 Enrolled in graduate or professional school 70 0 4% 56 Public school 41 0.3% 45 Private school 29 0.2% 33 Not enrolled in school 12,688 81.1% 415 POPULATION AGE 65+ BY RELATIONSHIP AND HOUSEHOLD TYPE Total 3,573 100.0% 130 Living in Households 3,559 99 6% 127 Living in Family Households 2,548 71 3% 113 Householder 1,288 36 0% 70 Spouse 1,057 29 6% 66 Parent 32 0.9% 26 Parent-in-law 94 2.6% 102 Other Relative 50 1.4% 27 Nonrelative 27 0.8% 44 Living in Nonfamily Households 1,011 28 3% 84 Householder 944 26.4% 79 Nonrelative 67 1.9% 32 Living in Group Quarters 14 0 4% 27
ACS Population Summary
medium low April 11, 2024 ©2024 Esri Page 17 of 24
Source: U.S. Census Bureau, 2017-2021 American Community Survey Reliability:
high
4422 S Highway 97, Redmond, Oregon, 97756 2 Prepared by Esri 4422 S Highway 97, Redmond, Oregon, 97756 Latitude: 44.23435 Ring band: 3 - 5 mile radius Longitude: -121.20029
ACS Population Summary
ACS Estimate Percent MOE(±) Reliability HOUSEHOLDS BY TYPE AND SIZE Family Households 4,432 67 7% 238 2-Person 2,238 34.2% 135 3-Person 1,031 15 8% 193 4-Person 587 9.0% 123 5-Person 434 6 6% 81 6-Person 105 1.6% 56 7+ Person 37 0.6% 46 Nonfamily Households 2,113 32 3% 127 1-Person 1,600 24 4% 113 2-Person 405 6.2% 65 3-Person 80 1.2% 68 4-Person 28 0.4% 82 5-Person 0 0.0% 0 6-Person 0 0.0% 0 7+ Person 0 0.0% 0 HOUSEHOLDS BY PRESENCE OF PEOPLE UNDER 18 YEARS BY HOUSEHOLD TYPE Households with one or more people under 18 years 1,579 24.1% 124 Family households 1,542 23.6% 124 Married-couple family 1,101 16.8% 112 Male householder, no wife present 145 2.2% 59 Female householder, no husband present 296 4.5% 142 Nonfamily households 37 0.6% 64 Households with no people under 18 years 4,967 75.9% 216 Married-couple family 2,436 37.2% 211 Other family 454 6.9% 96 Nonfamily households 2,077 31.7% 127 HOUSEHOLDS BY PRESENCE OF PEOPLE 65 YEARS AND OVER, HOUSEHOLD SIZE AND HOUSEHOLD TYPE Households with Pop 65+ 2,543 38.8% 99 1-Person 793 12.1% 79 2+ Person Family 1,587 24.2% 77 2+ Person Nonfamily 162 2.5% 45 Households with No Pop 65+ 4,003 61.2% 244 1-Person 807 12.3% 105 2+ Person Family 2,845 43.5% 230 2+ Person Nonfamily 351 5.4% 64 HOUSEHOLD TYPE BY RELATIVES AND NONRELATIVES FOR POPULATION IN HOUSEHOLDS POPULATION IN HOUSEHOLDS Total 16,049 100.0% 653 In Family Households 13,260 82 6% 681 In Married-Couple Family 10,165 63 3% 662 Relatives 10,021 62 4% 632 Nonrelatives 145 0.9% 80 In Male Householder-No Spouse Present-Family 723 4.5% 213 Relatives 594 3 7% 152 Nonrelatives 128 0.8% 73 In Female Householder-No Spouse Present-Family 2,372 14 8% 341 Relatives 2,118 13.2% 303 Nonrelatives 254 1 6% 167 In Nonfamily Households 2,789 17 4% 180 Source: U.S. Census Bureau, 2017-2021 American Community Survey Reliability: high medium low April 11, 2024 ©2024 Esri Page 18 of 24
2017-2021
4422 S Highway 97, Redmond, Oregon, 97756 2 Prepared by Esri 4422 S Highway 97, Redmond, Oregon, 97756 Latitude: 44.23435 Ring band: 3 - 5 mile radius Longitude: -121.20029
ACS Estimate Percent MOE(±) Reliability POPULATION AGE 5+ YEARS BY LANGUAGE SPOKEN AT HOME AND ABILITY TO SPEAK ENGLISH Total 15,337 100.0% 620 5 to 17 years Speak only English 1,981 12 9% 175 Speak Spanish 204 1.3% 76 Speak English "very well" or "well" 124 0.8% 48 Speak English "not well" 80 0.5% 58 Speak English "not at all" 0 0 0% 0 Speak other Indo-European languages 7 0.0% 11 Speak English "very well" or "well" 7 0.0% 11 Speak English "not well" 0 0.0% 0 Speak English "not at all" 0 0 0% 0 Speak Asian and Pacific Island languages 0 0.0% 0 Speak English "very well" or "well" 0 0.0% 0 Speak English "not well" 0 0.0% 0 Speak English "not at all" 0 0 0% 0 Speak other languages 0 0.0% 0 Speak English "very well" or "well" 0 0.0% 0 Speak English "not well" 0 0.0% 0 Speak English "not at all" 0 0 0% 0 18 to 64 years Speak only English 8,726 56.9% 575 Speak Spanish 616 4.0% 99 Speak English "very well" or "well" 508 3 3% 117 Speak English "not well" 107 0.7% 54 Speak English "not at all" 0 0 0% 24 Speak other Indo-European languages 215 1.4% 66 Speak English "very well" or "well" 215 1 4% 66 Speak English "not well" 0 0.0% 0 Speak English "not at all" 0 0 0% 0 Speak Asian and Pacific Island languages 15 0.1% 15 Speak English "very well" or "well" 15 0.1% 15 Speak English "not well" 0 0.0% 1 Speak English "not at all" 0 0 0% 0 Speak other languages 0 0.0% 0 Speak English "very well" or "well" 0 0.0% 0 Speak English "not well" 0 0.0% 0 Speak English "not at all" 0 0 0% 0 65 years and over Speak only English 3,351 21 8% 127 Speak Spanish 99 0.6% 36 Speak English "very well" or "well" 34 0.2% 57 Speak English "not well" 30 0.2% 39 Speak English "not at all" 35 0 2% 78 Speak other Indo-European languages 121 0.8% 177 Speak English "very well" or "well" 120 0 8% 184 Speak English "not well" 1 0.0% 4 Speak English "not at all" 0 0 0% 0 Speak Asian and Pacific Island languages 2 0.0% 23 Speak English "very well" or "well" 0 0.0% 17 Speak English "not well" 2 0.0% 34 Speak English "not at all" 0 0 0% 0 Speak other languages 0 0.0% 0 Speak English "very well" or "well" 0 0.0% 0 Speak English "not well" 0 0.0% 0 Speak English "not at all" 0 0 0% 0
Bureau, 2017-2021 American Community Survey Reliability: high medium low April 11, 2024 ©2024 Esri Page 19 of 24
ACS Population Summary
2017-2021
Source: U.S. Census
4422 S Highway 97, Redmond, Oregon, 97756 2 Prepared by Esri 4422 S Highway 97, Redmond, Oregon, 97756 Latitude: 44.23435 Ring band: 3 - 5 mile radius Longitude: -121.20029
ACS Estimate Percent MOE(±) Reliability WORKERS AGE 16+ YEARS BY PLACE OF WORK Total 7,498 100.0% 365 Worked in state and in county of residence 6,967 92.9% 357 Worked in state and outside county of residence 467 6 2% 112 Worked outside state of residence 64 0.9% 22 SEX BY CLASS OF WORKER FOR THE CIVILIAN EMPLOYED POPULATION 16 YEARS AND OVER Total: 7,675 100.0% 432 Male: 3,875 50 5% 298 Employee of private company workers 2,519 32 8% 233 Self-employed in own incorporated business workers 492 6.4% 66 Private not-for-profit wage and salary workers 119 1.6% 36 Local government workers 193 2.5% 95 State government workers 92 1.2% 30 Federal government workers 146 1.9% 68 Self-employed in own not incorporated business workers 312 4 1% 108 Unpaid family workers 3 0.0% 22 Female: 3,800 49 5% 218 Employee of private company workers 2,169 28 3% 205 Self-employed in own incorporated business workers 382 5 0% 49 Private not-for-profit wage and salary workers 568 7.4% 114 Local government workers 303 3.9% 48 State government workers 104 1.4% 14 Federal government workers 43 0.6% 31 Self-employed in own not incorporated business workers 221 2.9% 38 Unpaid family workers 10 0 1% 21 POPULATION IN HOUSEHOLDS AND PRESENCE OF A COMPUTER Total 16,049 100.0% 653 Population <18 in Households 2,959 18 4% 217 Have a Computer 2,959 18 4% 223 Have NO Computer 0 0.0% 1 Population 18-64 in Households 9,531 59 4% 578 Have a Computer 9,461 59 0% 577 Have NO Computer 70 0 4% 75 Population 65+ in Households 3,559 22 2% 127 Have a Computer 3,492 21.8% 126 Have NO Computer 66 0 4% 40 HOUSEHOLDS AND INTERNET SUBSCRIPTIONS Total 6,546 100.0% 227 With an Internet Subscription 6,052 92.5% 231 Dial-Up Alone 32 0 5% 21 Broadband 4,704 71 9% 222 Satellite Service 850 13 0% 119 Other Service 43 0 7% 18 Internet Access with no Subscription 110 1.7% 35 With No Internet Access 385 5 9% 83 Source: U.S. Census Bureau, 2017-2021 American Community Survey Reliability: high medium low April 11, 2024 ©2024 Esri Page 20 of 24
ACS Population Summary
2017-2021
4422 S Highway 97, Redmond, Oregon, 97756 2 Prepared by Esri 4422 S Highway 97, Redmond, Oregon, 97756 Latitude: 44.23435 Ring band: 3 - 5 mile radius Longitude: -121.20029
ACS Estimate Percent MOE(±) Reliability WORKERS AGE 16+ YEARS BY MEANS OF TRANSPORTATION TO WORK Total 7,498 100.0% 365 Drove alone 5,222 69 6% 278 Carpooled 867 11 6% 159 Public transportation (excluding taxicab) 65 0.9% 99 Bus or trolley bus 65 0.9% 99 Light rail, streetcar or trolley 0 0.0% 0 Subway or elevated 0 0.0% 0 Long-distance/Commuter Train 0 0.0% 0 Ferryboat 0 0.0% 0 Taxicab 18 0.2% 30 Motorcycle 16 0.2% 19 Bicycle 15 0.2% 23 Walked 151 2 0% 55 Other means 119 1.6% 157 Worked at home 1,026 13 7% 186 WORKERS AGE 16+ YEARS (WHO DID NOT WORK FROM HOME) BY TRAVEL TIME TO WORK Total 6,472 100.0% 343 Less than 5 minutes 280 4.3% 59 5 to 9 minutes 1,052 16.3% 209 10 to 14 minutes 1,018 15 7% 92 15 to 19 minutes 796 12 3% 105 20 to 24 minutes 631 9.7% 107 25 to 29 minutes 657 10 2% 226 30 to 34 minutes 1,249 19.3% 141 35 to 39 minutes 193 3 0% 42 40 to 44 minutes 209 3.2% 51 45 to 59 minutes 192 3 0% 39 60 to 89 minutes 140 2.2% 76 90 or more minutes 55 0 8% 29 Average Travel Time to Work (in minutes) N/A N/A FEMALES AGE 20-64 YEARS BY AGE OF OWN CHILDREN AND EMPLOYMENT STATUS Total 4,916 100.0% 341 Own children under 6 years only 500 10.2% 133 In labor force 414 8 4% 122 Not in labor force 86 1.7% 79 Own children under 6 years and 6 to 17 years 172 3 5% 53 In labor force 116 2.4% 46 Not in labor force 56 1.1% 43 Own children 6 to 17 years only 825 16.8% 86 In labor force 710 14 4% 77 Not in labor force 115 2.3% 45 No own children under 18 years 3,418 69 5% 332 In labor force 2,515 51.2% 290 Not in labor force 903 18 4% 140
Reliability: high medium low April 11, 2024 ©2024 Esri Page 21 of 24
ACS Population Summary
2017-2021
Source: U.S. Census Bureau, 2017-2021 American Community Survey
4422 S Highway 97, Redmond, Oregon, 97756 2 Prepared by Esri 4422 S Highway 97, Redmond, Oregon, 97756 Latitude: 44.23435 Ring band: 3 - 5 mile radius Longitude: -121.20029 2017-2021 ACS Estimate Percent MOE(±) Reliability CIVILIAN NONINSTITUTIONALIZED POPULATION BY AGE & TYPES OHEALINSURANCE COVERAGE OF HEALTH INSURANCE COVERAGE Total 16,090 100.0% 655 Under 19 years: 3,165 19 7% 230 One Type of Health Insurance: 2,972 18 5% 234 Employer-Based Health Ins Only 1,430 8.9% 182 Direct-Purchase Health Ins Only 85 0 5% 35 Medicare Coverage Only 0 0.0% 0 Medicaid Coverage Only 1,285 8 0% 169 TRICARE/Military Hlth Cov Only 172 1.1% 154 VA Health Care Only 0 0.0% 0 2+ Types of Health Insurance 117 0.7% 42 No Health Insurance Coverage 76 0.5% 77 19 to 34 years: 3,136 19.5% 293 One Type of Health Insurance: 2,648 16.5% 257 Employer-Based Health Ins Only 1,731 10 8% 241 Direct-Purchase Health Ins Only 244 1 5% 153 Medicare Coverage Only 0 0.0% 0 Medicaid Coverage Only 618 3 8% 123 TRICARE/Military Hlth Cov Only 51 0.3% 50 VA Health Care Only 3 0 0% 29 2+ Types of Health Insurance 326 2.0% 131 No Health Insurance Coverage 162 1 0% 51 35 to 64 years: 6,220 38 7% 420 One Type of Health Insurance: 4,660 29 0% 382 Employer-Based Health Ins Only 3,106 19 3% 371 Direct-Purchase Health Ins Only 689 4 3% 84 Medicare Coverage Only 85 0.5% 42 Medicaid Coverage Only 697 4 3% 92 TRICARE/Military Hlth Cov Only 55 0.3% 18 VA Health Care Only 29 0 2% 33 2+ Types of Health Insurance 921 5.7% 129 No Health Insurance Coverage 639 4.0% 126 65+ years: 3,569 22.2% 127 One Type of Health Insurance: 1,094 6.8% 94 Employer-Based Health Ins Only 32 0.2% 20 Direct-Purchase Health Ins Only 4 0.0% 20 Medicare Coverage Only 1,057 6.6% 94 TRICARE/Military Hlth Cov Only 0 0 0% 0 VA Health Care Only 0 0.0% 0 2+ Types of Health Insurance: 2,475 15 4% 104 Employer-Based & Direct-Purchase Health Insurance 0 0.0% 0 Employer-Based Health & Medicare Insurance 467 2 9% 78 Direct-Purchase Health & Medicare Insurance 1,175 7.3% 66 Medicare & Medicaid Coverage 153 1 0% 53 Other Private Health Insurance Combos 0 0.0% 0 Other Public Health Insurance Combos 38 0.2% 14 Other Health Insurance Combinations 642 4.0% 63 No Health Insurance Coverage 0 0.0% 0
ACS Population Summary
April 11, 2024 ©2024 Esri Page 22 of 24
Source: U.S. Census Bureau, 2017-2021 American Community Survey Reliability: high
medium low
4422 S Highway 97, Redmond, Oregon, 97756 2 Prepared by Esri 4422 S Highway 97, Redmond, Oregon, 97756 Latitude: 44.23435 Ring band: 3 - 5 mile radius Longitude: -121.20029
ACS Population Summary
ACS Estimate Percent MOE(±) Reliability POPULATION BY RATIO OF INCOME TO POVERTY LEVEL Total 16,018 100.0% 648 Under 50 749 4.7% 146 50 to 99 658 4 1% 185 1 00 to 1 24 677 4.2% 201 1 25 to 1 49 1,409 8 8% 277 1 50 to 1 84 446 2.8% 101 1 85 to 1 99 227 1 4% 52 2 00 and over 11,851 74 0% 646 CIVILIAN POPULATION AGE 18 OR OLDER BY VETERAN STATUS Total 13,137 100.0% 568 Veteran 1,398 10.6% 134 Nonveteran 11,739 89.4% 519 Male 6,108 46 5% 318 Veteran 1,311 10 0% 127 Nonveteran 4,797 36 5% 268 Female 7,029 53 5% 331 Veteran 87 0.7% 105 Nonveteran 6,942 52 8% 330 CIVILIAN VETERANS AGE 18 OR OLDER BY PERIOD OF MILITARY SERVICE Total 1,398 100.0% 134 Gulf War (9/01 or later), no Gulf War (8/90 to 8/01), no Vietnam Era 231 16 5% 152 Gulf War (9/01 or later) and Gulf War (8/90 to 8/01), no Vietnam Era 22 1.6% 12 Gulf War (9/01 or later), and Gulf War (8/90 to 8/01), and Vietnam Era 0 0.0% 0 Gulf War (8/90 to 8/01), no Vietnam Era 113 8.1% 74 Gulf War (8/90 to 8/01) and Vietnam Era 7 0.5% 20 Vietnam Era, no Korean War, no World War II 448 32 0% 57 Vietnam Era and Korean War, no World War II 2 0.1% 19 Vietnam Era and Korean War and World War II 0 0.0% 0 Korean War, no Vietnam Era, no World War II 76 5.4% 28 Korean War and World War II, no Vietnam Era 0 0 0% 0 World War II, no Korean War, no Vietnam Era 0 0.0% 0 Between Gulf War and Vietnam Era only 382 27 3% 75 Between Vietnam Era and Korean War only 117 8.4% 21 Between Korean War and World War II only 0 0.0% 0 Pre-World War II only 0 0.0% 0 HOUSEHOLDS BY
Total 6,546 100.0% 227 Income in the past 12 months below poverty level 627 9.6% 90 Married-couple family 117 1 8% 55 Other family - male householder (no wife present) 6 0.1% 85 Other family - female householder (no husband present) 103 1 6% 46 Nonfamily household - male householder 170 2.6% 83 Nonfamily household - female householder 230 3.5% 61 Income in the past 12 months at or above poverty level 5,919 90 4% 218 Married-couple family 3,421 52 3% 230 Other family - male householder (no wife present) 209 3.2% 66 Other family - female householder (no husband present) 576 8.8% 104 Nonfamily household - male householder 653 10.0% 65 Nonfamily household - female householder 1,060 16 2% 105 Poverty Index 77 Source: U.S. Census Bureau, 2017-2021 American Community Survey Reliability: high medium low April 11, 2024 ©2024 Esri Page 23 of 24
2017-2021
POVERTY STATUS
Data Note: N/A means not available Population by Ratio of Income to Poverty Level represents persons for whom poverty status is determined. Household income represents income in 2021, adjusted for inflation
2017-2021 ACS Estimate: The American Community Survey (ACS) replaces census sample data. Esri is releasing the 2017-2021 ACS estimates, five-year period data collected monthly from January 1, 2017 through December 31, 2021. Although the ACS includes many of the subjects previously covered by the decennial census sample, there are significant differences between the two surveys including fundamental differences in survey design and residency rules
Margin of error (MOE): The MOE is a measure of the variability of the estimate due to sampling error. MOEs enable the data user to measure the range of uncertainty for each estimate with 90 percent confidence. The range of uncertainty is called the confidence interval, and it is calculated by taking the estimate +/- the MOE. For example, if the ACS reports an estimate of 100 with an MOE of +/- 20, then you can be 90 percent certain the value for the whole population falls between 80 and 120.
Reliability: These symbols represent threshold values that Esri has established from the Coefficients of Variation (CV) to designate the usability of the estimates. The CV measures the amount of sampling error relative to the size of the estimate, expressed as a percentage
High Reliability: Small CVs (less than or equal to 12 percent) are flagged green to indicate that the sampling error is small relative to the estimate and the estimate is reasonably reliable.
Medium Reliability: Estimates with CVs between 12 and 40 are flagged yellow-use with caution.
Low Reliability: Large CVs (over 40 percent) are flagged red to indicate that the sampling error is large relative to the estimate. The estimate is considered very unreliable.
Source: U.S. Census Bureau, 2017-2021 American Community Survey Reliability: high medium low April 11, 2024
4422 S Highway 97, Redmond, Oregon, 97756 2 Prepared by Esri 4422 S Highway 97, Redmond, Oregon, 97756 Latitude: 44.23435 Ring band: 3 - 5 mile radius Longitude: -121.20029
ACS Estimate Percent MOE(±) Reliability HOUSEHOLDS BY OTHER INCOME Social Security Income 2,756 42 1% 140 No Social Security Income 3,790 57.9% 235 Retirement Income 1,927 29 4% 125 No Retirement Income 4,619 70 6% 225 GROSS RENT AS A PERCENTAGE OF HOUSEHOLD INCOME IN THE PAST 12 MONTHS <10% of Income 65 4.1% 45 10-14 9% of Income 134 8.4% 87 15-19 9% of Income 171 10 8% 39 20-24 9% of Income 116 7.3% 38 25-29.9% of Income 181 11.4% 67 30-34 9% of Income 148 9.3% 51 35-39 9% of Income 62 3 9% 47 40-49 9% of Income 178 11 2% 84 50+% of Income 479 30 2% 65 Gross Rent % Inc Not Computed 54 3.4% 77 HOUSEHOLDS BY PUBLIC ASSISTANCE INCOME IN THE PAST 12 MONTHS Total 6,546 100.0% 227 With public assistance income 200 3.1% 81 No public assistance income 6,346 96.9% 219 HOUSEHOLDS BY FOOD STAMPS/SNAP STATUS Total 6,546 100.0% 227 With Food Stamps/SNAP 635 9.7% 74 With No Food Stamps/SNAP 5,911 90.3% 229 HOUSEHOLDS BY DISABILITY STATUS Total 6,546 100.0% 227 With 1+ Persons w/Disability 1,940 29.6% 153 With No Person w/Disability 4,606 70.4% 238
ACS Population Summary
2017-2021
©2024 Esri Page 24 of 24
Data Note: Household population includes persons not residing in group quarters
Average Household Size is the household population divided by total households Persons in families include the householder and persons related to the householder by birth, marriage, or adoption. Per Capita Income represents the income received by all persons aged 15 years and over divided by the total population.
Source: Esri forecasts for 2023 and 2028. U.S. Census Bureau 2000 and 2010 decennial Census data converted by Esri into 2020 geography. April 11, 2024
4422 S Highway 97, Redmond, Oregon, 97756 2 Prepared by Esri 4422 S Highway 97, Redmond, Oregon, 97756 Latitude: 44.23435 Ring bands: 0-1, 1-3, 3-5 mile radii Longitude: -121.20029 0 - 1 mile 1 - 3 mile 3 - 5 mile Population Summary 2010 Total Population 1,449 15,411 13,418 2020 Total Population 2,390 18,703 17,012 2020 Group Quarters 12 42 98 2023 Total Population 2,860 20,203 18,532 2023 Group Quarters 13 41 98 2028 Total Population 2,996 21,168 19,386 2023-2028 Annual Rate 0.93% 0.94% 0.91% 2023 Total Daytime Population 2,761 18,958 17,351 Workers 935 8,899 7,334 Residents 1,826 10,059 10,017 Household Summary 2010 Households 679 5,799 5,226 2010 Average Household Size 2.04 2.62 2.56 2020 Total Households 1,071 7,032 6,623 2020 Average Household Size 2.22 2.65 2.55 2023 Households 1,251 7,668 7,178 2023 Average Household Size 2.28 2.63 2.57 2028 Households 1,314 8,105 7,553 2028 Average Household Size 2.27 2.61 2.55 2023-2028 Annual Rate 0.99% 1.11% 1.02% 2010 Families 431 3,910 3,757 2010 Average Family Size 2.51 3.10 2.94 2023 Families 770 5,035 5,017 2023 Average Family Size 2.85 3.15 3.00 2028 Families 804 5,287 5,261 2028 Average Family Size 2.85 3.13 2.98 2023-2028 Annual Rate 0.87% 0.98% 0.95% Housing Unit Summary 2000 Housing Units 504 4,177 3,436 Owner Occupied Housing Units 68.3% 58.6% 69.4% Renter Occupied Housing Units 22.8% 36.2% 22.1% Vacant Housing Units 8.9% 5.2% 8.5% 2010 Housing Units 745 6,393 6,290 Owner Occupied Housing Units 67.8% 47.5% 56.0% Renter Occupied Housing Units 23.2% 43.2% 27.1% Vacant Housing Units 8.9% 9.3% 16.9% 2020 Housing Units 1,170 7,377 7,382 Owner Occupied Housing Units 69.9% 55.1% 66.1% Renter Occupied Housing Units 21.6% 40.2% 23.6% Vacant Housing Units 9.1% 4.7% 10.2% 2023 Housing Units 1,375 8,079 7,929 Owner Occupied Housing Units 84.9% 53.5% 70.0% Renter Occupied Housing Units 6.0% 41.4% 20.5% Vacant Housing Units 9.0% 5.1% 9.5% 2028 Housing Units 1,428 8,476 8,277 Owner Occupied Housing Units 86.1% 54.2% 71.5% Renter Occupied Housing Units 6.0% 41.5% 19.7% Vacant Housing Units 8.0% 4.4% 8.7%
Market Profile
©2024 Esri Page 1 of 8
Data Note: Income represents the preceding year, expressed in current dollars Household income includes wage and salary earnings, interest dividends, net rents, pensions, SSI and welfare payments, child support, and alimony.
Source: Esri forecasts for 2023 and 2028. U.S. Census Bureau 2000 and 2010 decennial Census data converted by Esri into 2020 geography. April 11, 2024
4422 S Highway 97, Redmond, Oregon, 97756 2 Prepared by Esri 4422 S Highway 97, Redmond, Oregon, 97756 Latitude: 44.23435 Ring bands: 0-1, 1-3, 3-5 mile radii Longitude: -121.20029 0 - 1 mile 1 - 3 mile 3 - 5 mile 2023 Households by Income Household Income Base 1,251 7,668 7,178 <$15,000 15.0% 5.9% 6.4% $15,000 - $24,999 9.3% 6.2% 4.6% $25,000 - $34,999 5.0% 4.7% 5.3% $35,000 - $49,999 12.9% 13.9% 13.1% $50,000 - $74,999 15.4% 19.4% 16.3% $75,000 - $99,999 11.3% 20.5% 17.7% $100,000 - $149,999 25.5% 20.7% 21.9% $150,000 - $199,999 3.5% 5.5% 8.5% $200,000+ 2.2% 3.3% 6.3% Average Household Income $76,019 $87,266 $100,970 2028 Households by Income Household Income Base 1,314 8,105 7,553 <$15,000 12.8% 5.2% 5.5% $15,000 - $24,999 5.6% 4.6% 3.3% $25,000 - $34,999 4.3% 3.7% 3.7% $35,000 - $49,999 11.7% 12.3% 10.0% $50,000 - $74,999 16.1% 17.9% 14.2% $75,000 - $99,999 11.0% 21.2% 17.9% $100,000 - $149,999 29.9% 23.2% 25.6% $150,000 - $199,999 5.5% 7.6% 11.8% $200,000+ 2.8% 4.3% 8.0% Average Household Income $89,294 $99,569 $118,767 2023 Owner Occupied Housing Units by Value Total 1,168 4,323 5,554 <$50,000 1.2% 3.1% 2.1% $50,000 - $99,999 0.2% 6.9% 0.4% $100,000 - $149,999 0.0% 2.4% 0.5% $150,000 - $199,999 0.5% 5.6% 1.4% $200,000 - $249,999 0.6% 5.3% 1.2% $250,000 - $299,999 1.1% 7.4% 2.9% $300,000 - $399,999 7.4% 17.7% 8.4% $400,000 - $499,999 40.1% 18.3% 26.5% $500,000 - $749,999 46.1% 28.4% 41.6% $750,000 - $999,999 2.3% 3.1% 9.6% $1,000,000 - $1,499,999 0.3% 0.8% 4.2% $1,500,000 - $1,999,999 0.1% 1.0% 0.9% $2,000,000 + 0.0% 0.1% 0.3% Average Home Value $526,457 $428,494 $581,947 2028 Owner Occupied Housing Units by Value Total 1,229 4,591 5,920 <$50,000 0.0% 0.1% 0.3% $50,000 - $99,999 0.0% 1.7% 0.0% $100,000 - $149,999 0.0% 0.0% 0.0% $150,000 - $199,999 0.0% 0.3% 0.0% $200,000 - $249,999 0.0% 0.5% 0.0% $250,000 - $299,999 0.0% 0.6% 0.0% $300,000 - $399,999 0.4% 21.0% 2.7% $400,000 - $499,999 31.2% 27.1% 26.7% $500,000 - $749,999 64.1% 38.5% 51.5% $750,000 - $999,999 3.2% 5.9% 10.4% $1,000,000 - $1,499,999 0.7% 1.7% 6.5% $1,500,000 - $1,999,999 0.2% 2.4% 1.8% $2,000,000 + 0.0% 0.2% 0.2% Average Home Value $584,426 $558,876 $658,791
Market Profile
©2024 Esri Page 2 of 8
Source: Esri forecasts for 2023 and 2028. U.S. Census Bureau 2000 and 2010 decennial Census data converted by Esri into 2020 geography. April 11, 2024
4422 S Highway 97, Redmond, Oregon, 97756 2 Prepared by Esri 4422 S Highway 97, Redmond, Oregon, 97756 Latitude: 44.23435 Ring bands: 0-1, 1-3, 3-5 mile radii Longitude: -121.20029 0 - 1 mile 1 - 3 mile 3 - 5 mile Median Household Income 2023 $60,475 $74,782 $79,644 2028 $73,532 $80,601 $92,033 Median Home Value 2023 $497,115 $408,850 $539,682 2028 $571,383 $495,056 $598,663 Per Capita Income 2023 $31,418 $33,567 $38,853 2028 $36,976 $38,644 $45,982 Median Age 2010 52.4 33.4 38.9 2020 48.1 36.1 42.4 2023 51.8 35.5 40.9 2028 51.4 35.8 41.1 2020 Population by Age Total 2,390 18,703 17,012 0 - 4 4.8% 6.6% 5.3% 5 - 9 5.4% 6.8% 5.8% 10 - 14 5.9% 7.0% 6.2% 15 - 24 8.6% 12.3% 10.8% 25 - 34 10.2% 15.6% 12.4% 35 - 44 12.1% 13.6% 12.6% 45 - 54 10.9% 11.2% 11.4% 55 - 64 12.9% 11.3% 13.2% 65 - 74 16.7% 9.4% 13.6% 75 - 84 9.3% 4.5% 6.9% 85 + 3.3% 1.7% 1.9% 18 + 81.0% 75.7% 78.8% 2023 Population by Age Total 2,860 20,201 18,534 0 - 4 4.2% 7.1% 5.9% 5 - 9 4.7% 7.2% 6.3% 10 - 14 4.8% 6.9% 6.6% 15 - 24 8.9% 13.1% 11.5% 25 - 34 10.2% 15.0% 11.8% 35 - 44 9.9% 13.7% 13.3% 45 - 54 11.4% 11.4% 12.4% 55 - 64 13.8% 10.6% 13.1% 65 - 74 16.2% 8.8% 12.0% 75 - 84 11.6% 4.5% 5.5% 85 + 4.2% 1.6% 1.7% 18 + 83.5% 74.9% 77.0% 2028 Population by Age Total 2,998 21,167 19,385 0 - 4 4.3% 7.2% 6.0% 5 - 9 4.6% 7.0% 6.3% 10 - 14 5.1% 7.2% 6.8% 15 - 24 8.5% 12.8% 10.8% 25 - 34 10.0% 14.6% 12.3% 35 - 44 10.6% 14.0% 12.9% 45 - 54 10.6% 11.3% 12.3% 55 - 64 12.7% 10.1% 12.0% 65 - 74 15.4% 8.9% 12.1% 75 - 84 12.9% 5.1% 6.7% 85 + 5.3% 1.7% 1.9% 18 + 82.8% 74.8% 76.9% 2020 Population by Sex
Market Profile
©2024 Esri Page 3 of 8
Data Note: Persons of Hispanic Origin may be of any race. The Diversity Index measures the probability that two people from the same area will be from different race/ethnic groups
Source: Esri forecasts for 2023 and 2028. U.S. Census Bureau 2000 and 2010 decennial Census data converted by Esri into 2020 geography.
April 11, 2024
Market
4422 S Highway 97, Redmond, Oregon, 97756 2 Prepared by Esri 4422 S Highway 97, Redmond, Oregon, 97756 Latitude: 44.23435 Ring bands: 0-1, 1-3, 3-5 mile radii Longitude: -121.20029 0 - 1 mile 1 - 3 mile 3 - 5 mile Males 1,171 9,139 8,363 Females 1,219 9,564 8,649 2023 Population by Sex Males 1,404 9,820 9,168 Females 1,456 10,383 9,364 2028 Population by Sex Males 1,462 10,271 9,563 Females 1,534 10,897 9,823 2010 Population by Race/Ethnicity Total 1,449 15,410 13,418 White Alone 94.3% 88.2% 91.7% Black Alone 0.1% 0.4% 0.4% American Indian Alone 1.2% 1.4% 1.0% Asian Alone 0.6% 0.6% 0.8% Pacific Islander Alone 0.1% 0.1% 0.2% Some Other Race Alone 1.8% 6.2% 3.3% Two or More Races 2.0% 3.1% 2.5% Hispanic Origin 4.8% 13.4% 8.9% Diversity Index 19.2 39.9 29.4 2020 Population by Race/Ethnicity Total 2,390 18,703 17,012 White Alone 87.4% 81.0% 83.6% Black Alone 0.3% 0.6% 0.4% American Indian Alone 0.8% 1.2% 1.0% Asian Alone 1.3% 1.2% 0.9% Pacific Islander Alone 0.1% 0.2% 0.1% Some Other Race Alone 2.4% 5.9% 4.7% Two or More Races 7.7% 10.0% 9.2% Hispanic Origin 7.6% 14.3% 11.5% Diversity Index 33.7 49.5 43.5 2023 Population by Race/Ethnicity Total 2,860 20,203 18,533 White Alone 87.0% 79.9% 82.8% Black Alone 0.3% 0.6% 0.4% American Indian Alone 0.8% 1.2% 1.1% Asian Alone 1.4% 1.3% 1.0% Pacific Islander Alone 0.1% 0.2% 0.1% Some Other Race Alone 2.4% 6.3% 5.0% Two or More Races 8.1% 10.4% 9.7% Hispanic Origin 8.0% 15.4% 12.3% Diversity Index 34.9 51.6 45.3 2028 Population by Race/Ethnicity Total 2,996 21,168 19,386 White Alone 86.0% 78.6% 81.6% Black Alone 0.3% 0.6% 0.4% American Indian Alone 0.8% 1.2% 1.1% Asian Alone 1.5% 1.3% 1.0% Pacific Islander Alone 0.1% 0.2% 0.1% Some Other Race Alone 2.6% 6.9% 5.4% Two or More Races 8.6% 11.1% 10.3% Hispanic Origin 8.5% 16.4% 13.1% Diversity Index 36.8 53.8 47.5
Profile
©2024 Esri Page 4 of 8
Source: Esri forecasts for 2023 and 2028. U.S. Census Bureau 2000 and 2010 decennial Census data converted by Esri into 2020 geography. April 11, 2024
Market Profile 4422 S Highway 97, Redmond, Oregon, 97756 2 Prepared by Esri 4422 S Highway 97, Redmond, Oregon, 97756 Latitude: 44.23435 Ring bands: 0-1, 1-3, 3-5 mile radii Longitude: -121.20029 0 - 1 mile 1 - 3 mile 3 - 5 mile 2020 Population by Relationship and Household Type Total 2,390 18,703 17,012 In Households 99.5% 99.8% 99.4% Householder 41.8% 38.2% 38.7% Opposite-Sex Spouse 24.0% 17.6% 21.8% Same-Sex Spouse 0.3% 0.2% 0.2% Opposite-Sex Unmarried Partner 2.7% 3.7% 2.8% Same-Sex Unmarried Partner 0.2% 0.1% 0.1% Biological Child 21.4% 26.7% 24.0% Adopted Child 0.7% 0.6% 0.7% Stepchild 1.1% 1.4% 1.2% Grandchild 1.3% 2.0% 2.0% Brother or Sister 0.6% 1.1% 0.8% Parent 0.9% 1.1% 1.2% Parent-in-law 0.4% 0.3% 0.4% Son-in-law or Daughter-in-law 0.6% 0.4% 0.5% Other Relatives 0.6% 1.2% 1.0% Foster Child 0.2% 0.1% 0.1% Other Nonrelatives 2.8% 5.0% 4.0% In Group Quaters 0.5% 0.2% 0.6% Institutionalized 0.5% 0.1% 0.3% Noninstitutionalized 0.0% 0.1% 0.3% 2023 Population 25+ by Educational Attainment Total 2,216 13,272 12,906 Less than 9th Grade 3.8% 4.2% 1.7% 9th - 12th Grade, No Diploma 5.8% 6.8% 3.8% High School Graduate 34.6% 21.9% 21.7% GED/Alternative Credential 0.6% 4.5% 3.5% Some College, No Degree 26.6% 22.5% 27.9% Associate Degree 8.6% 14.1% 9.8% Bachelor's Degree 17.1% 17.7% 22.8% Graduate/Professional Degree 2.9% 8.4% 8.9% 2023 Population 15+ by Marital Status Total 2,471 15,925 15,032 Never Married 16.0% 32.5% 22.8% Married 57.1% 48.5% 55.7% Widowed 14.1% 4.9% 5.3% Divorced 12.7% 14.1% 16.2% 2023 Civilian Population 16+ in Labor Force Civilian Population 16+ 1,140 11,101 8,991 Population 16+ Employed 91.9% 93.2% 96.1% Population 16+ Unemployment rate 8.1% 6.8% 3.9% Population 16-24 Employed 9.9% 13.0% 12.3% Population 16-24 Unemployment rate 10.3% 23.0% 17.4% Population 25-54 Employed 72.4% 67.5% 65.9% Population 25-54 Unemployment rate 0.8% 3.8% 1.3% Population 55-64 Employed 14.3% 14.2% 15.8% Population 55-64 Unemployment rate 33.0% 5.2% 3.4% Population 65+ Employed 3.4% 5.3% 6.0% Population 65+ Unemployment rate 0.0% 0.2% 1.0%
©2024 Esri Page 5 of 8
Source: Esri forecasts for 2023 and 2028. U.S. Census Bureau 2000 and 2010 decennial Census data converted by Esri into 2020 geography. April 11, 2024
4422 S Highway 97, Redmond, Oregon, 97756 2 Prepared by Esri 4422 S Highway 97, Redmond, Oregon, 97756 Latitude: 44.23435 Ring bands: 0-1, 1-3, 3-5 mile radii Longitude: -121.20029 0 - 1 mile 1 - 3 mile 3 - 5 mile 2023 Employed Population 16+ by Industry Total 1,048 10,343 8,636 Agriculture/Mining 0.4% 1.1% 1.9% Construction 15.8% 15.4% 9.8% Manufacturing 3.2% 6.5% 5.2% Wholesale Trade 1.9% 2.3% 1.4% Retail Trade 21.5% 14.5% 13.9% Transportation/Utilities 0.4% 5.3% 7.2% Information 0.0% 0.6% 1.5% Finance/Insurance/Real Estate 0.4% 2.1% 4.9% Services 53.6% 49.9% 51.0% Public Administration 2.7% 2.5% 3.4% 2023 Employed Population 16+ by Occupation Total 1,048 10,343 8,638 White Collar 49.6% 55.4% 61.8% Management/Business/Financial 17.9% 14.4% 18.1% Professional 19.1% 18.3% 21.1% Sales 8.5% 9.8% 10.3% Administrative Support 4.1% 12.8% 12.4% Services 28.3% 18.4% 17.3% Blue Collar 22.0% 26.2% 20.9% Farming/Forestry/Fishing 0.0% 0.2% 0.2% Construction/Extraction 4.3% 10.1% 5.2% Installation/Maintenance/Repair 1.4% 2.5% 3.2% Production 0.9% 3.8% 4.2% Transportation/Material Moving 15.5% 9.6% 8.0% 2020 Households by Type Total 1,071 7,032 6,623 Married Couple Households 58.7% 46.5% 57.0% With Own Children <18 16.9% 18.9% 18.7% Without Own Children <18 41.8% 27.6% 38.2% Cohabitating Couple Households 6.7% 10.0% 7.5% With Own Children <18 1.3% 3.6% 2.5% Without Own Children <18 5.4% 6.4% 5.0% Male Householder, No Spouse/Partner 12.1% 17.0% 13.9% Living Alone 9.1% 10.0% 8.7% 65 Years and over 5 8% 3 7% 3 4% With Own Children <18 0.4% 2.0% 1.3% Without Own Children <18, With Relatives 1.4% 2.7% 2.2% No Relatives Present 1.3% 2.3% 1.7% Female Householder, No Spouse/Partner 22.3% 26.5% 21.7% Living Alone 15.2% 13.4% 12.2% 65 Years and over 11.4% 7.2% 7.3% With Own Children <18 2.5% 5.6% 3.4% Without Own Children <18, With Relatives 3.8% 6.0% 4.9% No Relatives Present 0.7% 1.6% 1.2% 2020 Households by Size Total 1,071 7,032 6,623 1 Person Household 24.3% 23.3% 21.0% 2 Person Household 43.0% 34.1% 41.0% 3 Person Household 13.1% 17.5% 15.1% 4 Person Household 11.3% 13.9% 13.2% 5 Person Household 5.1% 7.1% 5.7% 6 Person Household 2.1% 2.7% 2.5% 7 + Person Household 1.2% 1.4% 1.5%
Market Profile
©2024 Esri Page 6 of 8
Data Note: Households with children include any households with people under age 18, related or not. Multigenerational households are families with 3 or more parent-child relationships. Unmarried partner households are usually classified as nonfamily households unless there is another member of the household related to the householder. Multigenerational and unmarried partner households are reported only to the tract level. Esri estimated block group data, which is used to estimate polygons or non-standard geography.
Source: Esri forecasts for 2023 and 2028. U.S. Census Bureau 2000 and 2010 decennial Census data converted by Esri into 2020 geography.
April 11, 2024
4422 S Highway 97, Redmond, Oregon, 97756 2 Prepared by Esri 4422 S Highway 97, Redmond, Oregon, 97756 Latitude: 44.23435 Ring bands: 0-1, 1-3, 3-5 mile radii Longitude: -121.20029 0 - 1 mile 1 - 3 mile 3 - 5 mile 2020 Households by Tenure and Mortgage Status Total 1,071 7,032 6,623 Owner Occupied 76.4% 57.8% 73.7% Owned with a Mortgage/Loan 52.7% 45.1% 53.8% Owned Free and Clear 23.7% 12.7% 19.9% Renter Occupied 23.6% 42.2% 26.3% 2023 Affordability, Mortgage and Wealth Housing Affordability Index 50 75 61 Percent of Income for Mortgage 49.4% 32.9% 40.7% Wealth Index 64 61 93 2020 Housing Units By Urban/ Rural Status Total 1,170 7,377 7,382 Urban Housing Units 94.4% 93.0% 65.8% Rural Housing Units 5.6% 7.0% 34.2% 2020 Population By Urban/ Rural Status Total 2,390 18,703 17,012 Urban Population 94.9% 93.0% 72.7% Rural Population 5.1% 7.0% 27.3%
Market Profile
©2024 Esri Page 7 of 8
Data Note: Consumer spending shows the amount spent on a variety of goods and services by households that reside in the area. Expenditures are shown by broad budget categories that are not mutually exclusive Consumer spending does not equal business revenue. Total and Average Amount Spent Per Household represent annual figures. The Spending Potential Index represents the amount spent in the area relative to a national average of 100
Source: Consumer Spending data are derived from the 2019 and 2020 Consumer Expenditure Surveys, Bureau of Labor Statistics. Esri.
Source: Esri forecasts for 2023 and 2028. U.S. Census Bureau 2000 and 2010 decennial Census data converted by Esri into 2020 geography. April 11, 2024
Market Profile 4422 S Highway 97, Redmond, Oregon, 97756 2 Prepared by Esri 4422 S Highway 97, Redmond, Oregon, 97756 Latitude: 44.23435 Ring bands: 0-1, 1-3, 3-5 mile radii Longitude: -121.20029 0 - 1 mile 1 - 3 mile 3 - 5 mile Top 3 Tapestry Segments 1. Midlife Constants (5E) Urban Edge Families (7C) Middleburg (4C) 2. Front Porches (8E) Front Porches (8E) The Great Outdoors (6C) 3. Middleburg (4C) Middleburg (4C) Silver & Gold (9A) 2023 Consumer Spending Apparel & Services: Total $ $1,900,166 $13,891,322 $14,457,054 Average Spent $1,518.92 $1,811.60 $2,014.08 Spending Potential Index 69 82 92 Education: Total $ $1,484,093 $10,809,531 $10,919,034 Average Spent $1,186.33 $1,409.69 $1,521.18 Spending Potential Index 66 79 85 Entertainment/Recreation: Total $ $3,461,133 $23,464,868 $25,924,387 Average Spent $2,766.69 $3,060.10 $3,611.64 Spending Potential Index 73 81 95 Food at Home: Total $ $6,099,821 $43,039,515 $45,479,896 Average Spent $4,875.96 $5,612.87 $6,336.01 Spending Potential Index 72 83 93 Food Away from Home: Total $ $3,204,710 $23,745,910 $25,031,494 Average Spent $2,561.72 $3,096.75 $3,487.25 Spending Potential Index 69 83 94 Health Care: Total $ $7,156,376 $45,719,027 $52,035,358 Average Spent $5,720.52 $5,962.31 $7,249.28 Spending Potential Index 78 81 99 HH Furnishings & Equipment: Total $ $2,646,629 $18,533,335 $20,257,014 Average Spent $2,115.61 $2,416.97 $2,822.10 Spending Potential Index 72 82 95 Personal Care Products & Services: Total $ $843,536 $6,075,241 $6,474,230 Average Spent $674.29 $792.28 $901.95 Spending Potential Index 71 83 94 Shelter: Total $ $21,443,190 $158,307,276 $164,945,263 Average Spent $17,140.84 $20,645.18 $22,979.28 Spending Potential Index 69 83 93 Support Payments/Cash Contributions/Gifts in Kind: Total $ $2,984,100 $19,334,148 $22,450,601 Average Spent $2,385.37 $2,521.41 $3,127.70 Spending Potential Index 76 81 100 Travel: Total $ $1,985,042 $14,058,932 $15,525,172 Average Spent $1,586.76 $1,833.45 $2,162.88 Spending Potential Index 71 81 96 Vehicle Maintenance & Repairs: Total $ $1,190,237 $8,442,183 $9,148,474 Average Spent $951.43 $1,100.96 $1,274.52 Spending Potential Index 73 84 97
©2024 Esri Page 8 of 8
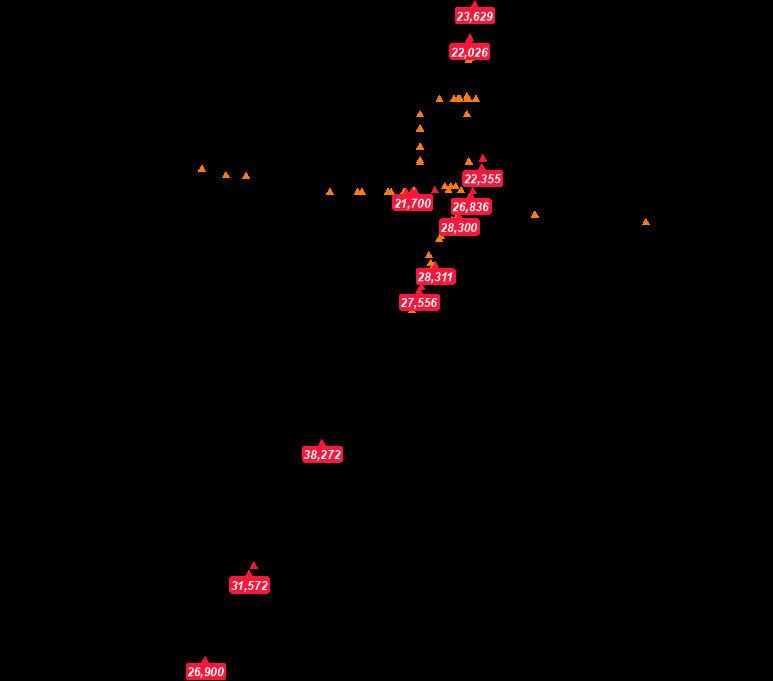
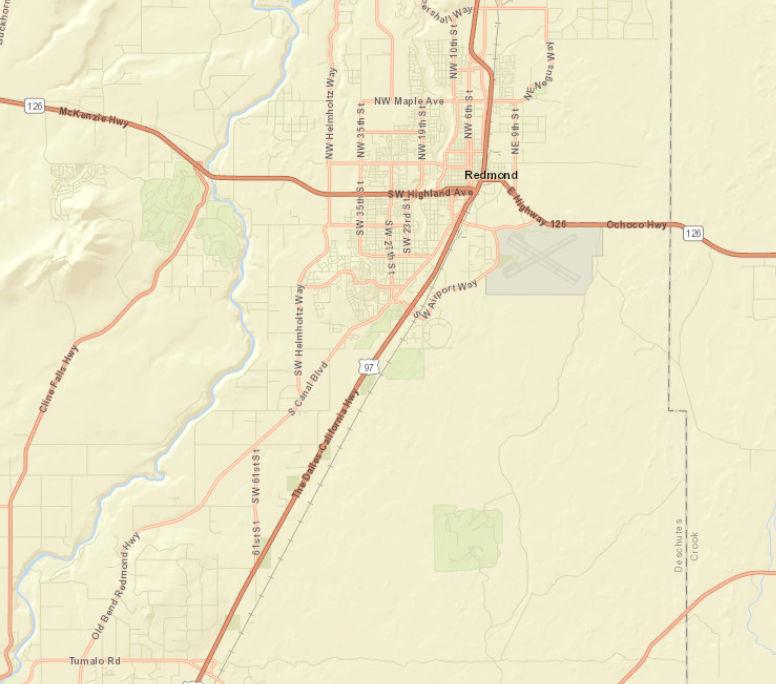
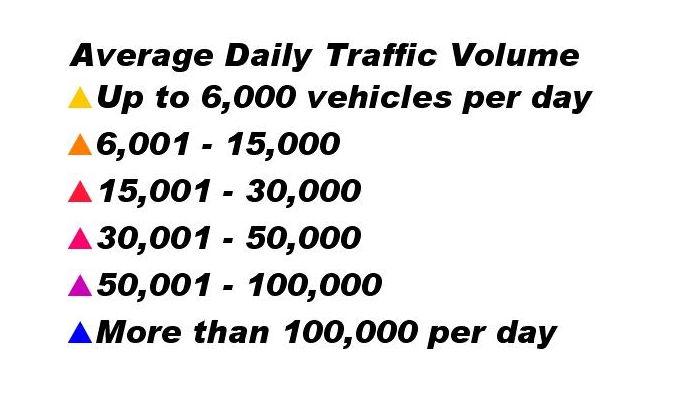
0 mi Traffic Count Map 4422 S Highway 97, Redmond, Oregon, 97756 2 Prepared by Esri 4422 S Highway 97, Redmond, Oregon, 97756 Latitude: 44.23435 Ring bands: 0-1, 1-3, 3-5 mile radii Longitude: -121.20029
April 11, 2024 ©2024 Esri Page 1 of 1
Source: ©2023 Kalibrate Technologies (Q4 2023).
1. By the one-time payment of a non-refundable parking and mobility improvement fee to the City in the amount established in the City’s Fee Schedule, paid prior to the issuance of Certificate of Occupancy. Fees collected shall be used to fund parking, street improvements or facilities to improve mobility or enhance pedestrian connectivity and safety in the Downtown OverlayDistrict.
2. From time to time the City shall establish the value of off-street parking facilities on a per parking space basis, used to establish the above parkingandmobilityimprovement fee.
3. The City Engineering shall evaluate development proposals requesting to pay an in-lieu fee through conducting a Transportation System Analysis or parkingstudy.
4. Any such request for parking in-lieu may be denied or reduced by the Community Development Director, or designee. The Director, or designee, shalldetermine:
a. Whether there is sufficient alternative parking within a two to fourblockradiusoftheproject location.
b. Whether approval of the request would have an adverse effect on surroundingneighborhoods.
c. Whether the request meets the Purpose and Intent of the Downtown OverlayDistrictZone.
d. Compliance with the Redmond Comprehensive Plan 2040 and supportplans, as amended.
[Section 8.0175amended byOrd. #2016-17passedJanuary31, 2017]
[Section 8.0175amended byOrd. #2022-04passedJune 28, 2022]
[Section 8.0175amended byOrd. #2022-09passedDecember 13, 2022]
[Section 8.0175amended byOrd. #2023-07passedDecember 19, 2023]
8.0180Light Industrial (M-1) Zone.
8.0182General Industrial (M-1.5) Zone.
8.0185Heavy Industrial (M-2) Zone.
8.0186Large Lot Industrial (LLI) Zone.
1. LLI Zone Regulations. Thefollowing standardsandregulationsapplyintheLLI Zone: A. The lot shall adhere to the designation as acknowledged by the Central Oregon IntergovernmentalCouncil.
B. No property that is zoned LLI can be rezoned to another zone within ten years of theLLI designation.
C. The minimum lot size is 50 acres. Division or separation of lots or parcels within the site to new lots or parcels less than the minimum lot size is not allowed until thesiteis developedwith a primarytradedsectoruserequiringalargelot.
D. Allowedusesaretradedsectorusesas provided in Section 2.
E. Usesallowedtosupportaprimaryuserincluded:
1. Subordinate industrial uses that rely upon and support the primary traded sectoruse;
2. Service commercial uses that support the traded sector uses if they are limitedto7500squarefeet per use; and
3. Retail uses accessory to a traded sector use and limited to 7500 square feet.
F. Conceptual Phased Site Development Plan. A Conceptual Phased Site Development Plan is required for each primary traded-sector use as part of the
CHAPTER 8 DEVELOPMENT REGULATIONS 68
Site and Design Review process in addition to the criteria and requirements outlined in Article IV of this code. In addition to the requirements outlined in Section 8.3025, the following elements shall be considered as part of the ConceptualPhased SiteDevelopment Plan:
1. Open Space. Generally identifylandprovidedfor openspaceonthesite.
2. Connectivity and Trail Networks. A conceptual transportation plan for streets, pedestrians connectivity and trail networks. E.g., Connection of bicycle routes and pedestrian network for utility and recreational purposes.
3. Site Design. Describe how the design elements (i.e., streets, open spaces, signage, and architecture) are integrated and coordinated throughout thesite.
4. Analysis of Anticipated Utility Consumption by Phase. Analysis of theanticipatedutility consumption by phasefor wastewater, water,power, natural gas, and other utility infrastructure necessary to support the development.
2. LLI Zone Uses Permitted. The following uses are allowed outright or conditionally in theLargeLotIndustrialZone:
Land Use: Zone: RESTRICTIONS AND REQUIREMENTS:
Traded-Sector Usage
Subordinate Industrial Uses
Service Commercial Uses
Retail Uses
O PerORS285B.280,tradedsectormeansindustriesinwhich memberfirmsselltheirgoodsorservicesintomarketsforwhich nationalorinternationalcompetitionexists,aswellasusesand servicesthatdirectlybenefittradedsectoruses.Alloweduses includemanufacturing,processingplants,distributioncenter, warehousing,researchanddevelopment,andhighereducation institutions
O Afteraprimarytraded-sectorusehasbeensited,subordinate industrialusesareallowed.Subordinatemeansindustriesthat relyuponandsupportaprimarytradedsectoruse
C Afteraprimarytraded-sectorusehasbeensited,service commercialusesareallowedthatsupportthetradedsectoruses andshallbelimitedto7500squarefeetperstructure
C Afteraprimarytraded-sectorusehasbeensited,retailuses,and eatinganddrinkingestablishmentsareallowedasaconditional useandshallbelimitedto7500squarefeetperuseinthe structure.
O=Outrightuses,C=ConditionalUses
3. Minimum Standards. See TableD, 8.0195.
[Section 8.0186added by Ord. #2015-11 passedSeptember22,2015]
[Section 8.0186amended byOrd. #2022-09passedDecember 13, 2022]
CHAPTER 8 DEVELOPMENT REGULATIONS 69
8.0190Table C, Uses Permitted. The following uses identified below are allowed outright or conditionally in each of the Commercial and Industrial zones. Outright or conditional uses in the M-1.5 zone may be permitted Conditionally in the M-1 or M-2 zones; this allowance doesnot applyfor usesNot Allowed (“N”).
CHAPTER 8 DEVELOPMENT REGULATIONS 70
“O” means Permitted Outright “C”means Permitted Conditionally “N”means Not Allowed Commercial/Industrial: C-1 C-2 C-3 C-4 C-4A C-5 M-1 M-1.5 M-2 DOD Restrictions and Requirements: AssistedLivingFacility O O O O O O N N N C AffordableHousing, containing100%affordable dwellingunits O O O O O O N N N O* *Onlyifalsoallowedbythe underlyingzonedistrict. BedandBreakfast C C C C N N N N N C BoardingHouse O O O O C C N N N O Caretaker C N N C N C C C O N Mustliveonsite. Dairy N N N N N N N N N O HomelessShelter O C C C N N O C N N ManufacturedHomePark C N N C N N N N N N MixedUseWorkforce Housing,containingground floorcommercialand100% workforceoraffordable dwellingunits O O O O O O N N N O* *Onlyifalsoallowedbythe underlyingzonedistrict. Multi-FamilyComplex O O O O O O N N N O* *ResidentialUseonground floorrestrictedto<25%and shallnotbeinfrontof building. PlannedUnitDevelopment C C C C C C C C C C Public-OwnedAffordable HousingDevelopment O O O O O O O N N O SeeSection8.0145 ResidentialUseabove groundfloor O O O O O O N N N O ResidentialUseon groundfloor<25% O O O O N N N N N O Notinfrontofbuilding. ResidentialUseon groundfloor>25% N N N N N N N N N N Residentialcarefacility O C O C N N N N N C Residentialcarehome O O O O N N N N N O ResidentialConversionof ExistingCommercial Structure O O O O O O O N N O* SeeSection8.0144.*Onlyif alsoallowedbythe underlyingzonedistrict. SingleFamilyDetached Dwelling(includingADUs) andDuplexesonground floor C O* C N N N N N N O* *Onlypermittedforthose usespre-datingtheadoption oftheC-2ZoneAmendments andDowntownOverlay DistrictonAugust12,2008. AttachedSingleFamily andtriplexandquadplex abovegroundfloor O O O O O O N N N O Resumptionofa residentialuse O O O O O O N N N C Onlyaspreviously established.
CHAPTER 8 DEVELOPMENT REGULATIONS 71 Triplex,Quadplex C O O O N N N N N O Eating and Drinking: C-1 C-2 C-3 C-4 C-4A C-5 M-1 M-1.5 M-2 DOD Restrictions and Requirements: Bakery(retail/sit-down) O O O O O* O O O O O Bar,Lounge,Tavern, Nightclub O O C O O* O O O O O Café,Restaurant(sit-down), Diner, BrewPub O O O O O* O O O O O Deli'sarelistedunder"retail uses." Café,Restaurant, Espresso(drive-through) O O O O O* O O O O O Deli'sarelistedunder"retail uses." MobileFoodPod O O N O O O O O O O PermittedthroughSiteand DesignReview.Notallowed onlotswithdwellingunit(s). MobileFoodUnit O O O O O O O O O O Permittedthrougha TemporaryUsePermit, Section8.0380.Notallowed onlotswithdwellingunit(s). MobileFoodVendoron privateproperty O O O O O O O O O O PermittedthroughBusiness LicensingprovisionsinCity Code,Section7.005etseq. Canonlyoperatebetween8 AMand9PMfornomore thantwoconsecutivedays withina90-dayperiodand mustbelocatedonreal propertyinassociationwith anevent. MobileFoodVendoron publicproperty O O O O O O O O O O PermittedthroughSpecial EventsprovisionsinCity Code,Section7.350etseq. orParksReservationPermit. Entertainment: C-1 C-2 C-3 C-4 C-4A C-5 M-1 M-1.5 M-2 DOD Restrictions and Requirements: AmusementPark C N N N O O N N N N ArenaforIndoorSports Events O C N C O O N N N C Largerthanindoor commercialrecreationaluse. DrivingRange O N N N N O N N N N GolfCourse N N N N N O N N N N IndoorCommercial Recreation O O O O O O C C C O MiniatureGolf, "Pitch&Putt" O N N N N O N N N N OutdoorCommercial Recreation C C N C O C N N N C Walk-inMovieTheater O O O O O O N N N O Automobile, Trucks, RV's: C-1 C-2 C-3 C-4 C-4A C-5 M-1 M-1.5 M-2 DOD Restrictions and Requirements: AutoDetailing O C N O O* N O O N C** Noautobodyworkpermitted as"detailing". **ExemptedasaConditional Useforexistingbusinesses priortoAugust12,2008.
CHAPTER 8 DEVELOPMENT REGULATIONS 72 AutoPainting, AutoBodyWork O N N N O* N O O O N AutoRepair O C N C O* N O O O C** Definedinpartbysomeonsiteautostorage.
Useforexistingbusinesses priortoAugust12,2008. AutoSales(newand used);AutoRentals C C N O N N N N N C** **ExemptedasaConditional Useforexistingbusinesses priortoAugust12,2008. AutoService O C N O O* N N N O C** Includesautolubeshops ('sameday'service).
Useforexistingbusinesses priortoAugust12,2008. RecreationalVehicleor BoatSalesandService C N N C C N C C N N Includesmotorcycles,ATVs, otherrecreationalvehicles. CarWash O O O O O O O O O C** Steamcleaningpermittedin theindustrialzones.
Useforexistingbusinesses priortoAugust12,2008. GasStationsIncluding CardLock O O N O O O O O O C** **ExemptedasaConditional Useforexistingbusinesses priortoAugust12,2008. TireSalesandService O O N O O N N N N N TruckStop O N N N O N O O O N TruckTerminal N N N N N N O O O N Automobileand RecreationalVehicle Storage/TowingYard N N N N N N C C C N Includesimpoundyards,auto fleets. Industrially Related Uses: C-1 C-2 C-3 C-4 C-4A C-5 M-1 M-1.5 M-2 DOD Restrictions and Requirements: Aircraft/AirportService, ParkingLot,Maintenance N N N N N N O N O N AutoWrecking,Recycling N N N N N N C C O N Bakery,Wholesale Distribution C N N N N N O C O N BatchPlants (Asphalt/Concrete) N N N N N N N C O N Commercial Manufacturing(Retail Support,Craftsmen) O O O O O O O O O O Mustbefullyenclosedin"C" zonesthatpermitthisuse. Concrete&Concrete Products,Stone-cutting N N N N N N C C O N DistributionCenter N N N N O N O O O N Dump,Landfill N N N N N N N N C N EnclosedWarehousing andManufacturing N N N N N N O O O N Upto50%retailallowedin IndustrialZones.
**ExemptedasaConditional
**ExemptedasaConditional
**ExemptedasaConditional
CHAPTER 8 DEVELOPMENT REGULATIONS 73 Junkyard N N N N N N N N O N AutoWreckingYard'isa separatecategory. LandscapingSupply(Bulk) N N N N N N O O O N Outdoorstorageofbulk landscapingmaterial. LumberMill N N N N N N N C O N Manufacturing (HeavyIndustrial) N N N N N N N C O N Manufacturing (LightIndustrial) N N N N N N O O O N SubjecttoDEQrequirements andneighborhood compatibility. MedicalResearchFacility O O O O O O O O O O Excludesresearchusing biohazardousmaterial. PrecisionMachineShop C N N C N N O O O N Mustbefullyenclosedin"C" zonesthatpermitthisuse. RetailUsesinsupportof primaryIndustrialUse N N N N N N O O O N Mustbelessthan50%ofthe grossfloorarea. RockCrushing/Recycling N N N N N N C C O N Slaughterhouse N N N N N N N N O N Tanning,Curing, StoringofHides N N N N N N N C O N WholesalePrintingand Distribution N N N N N N O O O N WoodProduct Manufacturingand Assembly N N N N N N O O O N Offices and Office Products: C-1 C-2 C-3 C-4 C-4A C-5 M-1 M-1.5 M-2 DOD Restrictions and Requirements: Office O O O O O O C C N O OfficeServiceand Supplies O O O O O* O N C N O Officesrelatedto IndustrialUse N N N N N N O O O N Printing,Publishing O O O O O O O O N O Telemarketing,CallCenter O O O O O O C C N N Public and Semi Public Uses: C-1 C-2 C-3 C-4 C-4A C-5 M-1 M-1.5 M-2 DOD Restrictions and Requirements: AgriculturalUses N N N N N N N N N N Churches,Religious Institutions C C C C C C C C N C ConventionCenter O O N O N O N N N O EmergencyShelter O O O O O O O O O O ReviewedunderORS 197.782.Emergencyshelters fornaturaldisasterresponse arenotsubjecttoreview. Hospital N N O N N N N N N N Lodge,Club, Non-profit/frat.Org. C C C C C C C C N C Park,PublicorPrivate O O O O O O O O O O ParkingGarage, PublicorPrivate O O O O O O O O O O PublicTransportation Station O O O O O O O O O O RVPark,PublicorPrivate C N N C N C C C N N Referto8.0615(14) PoliceorFireStation: PublicSafetyor EmergencyServices O O O O O O O C C C
CHAPTER 8 DEVELOPMENT REGULATIONS 74 Schools,PublicorPrivate C C C C C C C C N C SupportiveShelter O N N N O O O O N N SeeSection8.0370, SupportiveShelter Standards. CityOwnedUtilityor PublicFacility O O O O O O O O O O Retail Uses: C-1 C-2 C-3 C-4 C-4A C-5 M-1 M-1.5 M-2 DOD Restrictions and Requirements: BicycleSalesandService O O N O O* O N O N O BulkyRetail (includingfurniture) O O N O O O N O N O Excludesequipmentand heavyequipment. ContractorSupplies (enclosed) O O N O O N O O O O AlsocalledBuildingSupplies (non-landscaping). ContractorSupplies (outdoors) O C N C O N N O N C Delicatessen O O O O O* O C C N O DrugStore,Pharmacy O O O O O* O N O N O EquipmentSales,Service &Rental O O N O O N N O N C ExcludesHeavyEquipment SalesandService. Florist O O O O O* O N O N O Gallery,Studio O O N O O O N O N O GeneralRetail O O N O O* O N N N O Gift/CardShop O O O O O* O N N N O GroceryStore,Market O O N O O** O N N N O HardwareStore O O N O O* O N C N O HeavyEquipmentSales O N N N N N O C O N Onlypermittedw/primary serviceuseinMZone. HeavyEquipmentService O N N N N N O C O N HeavyEquipmentStorage (outdoor) N N N N N N N C O N MedicalSupplies(Retail) O O O O O N N C N O Mobile/Manufactured HomeSales&Service O N N C N N N N N N Novelty,Specialty, VarietyStore O O C O O* O N N N O Includesmusic,artsupply, electronicequipment, sportinggoods. OutdoorMerchandise Display,Other O C N O O N N C N C Nonstoragerelated;forretail sales. PetShop O O N O O O N N N O PlantNursery O N N O O O N C N N ThriftStore-1 O O O O N O N N N O Service Commercial Uses: C-1 C-2 C-3 C-4 C-4A C-5 M-1 M-1.5 M-2 DOD Restrictions and Requirements: ApplianceandComputer Repair O O N O O* N N N N O Includesstereos,electronic equipment,residential appliances. Bank,FinancialInstitution O O N O O C N N N O Beauty&BarberShops& Salons(Includingspas) O O O O O* O N N N O ContractorService O N N O O N O O O N Enclosedwithinabuilding (exceptinM-2zone); includesequipmentrentals andsales. Contractor'sYard C N N N N N C O O N Includesoutdoorstorageof equipmentandbuilding supplies.
[Section 8.0190amended byOrd. #2012-10passedAugust 14, 2012]
[Section 8.0190amended byOrd. #2015-04passedMay19, 2015]
[Section 8.0190amended byOrd. #2016-17passedJanuary31, 2017]
[Section 8.0190amended byOrd. #2017-12passedDecember 12, 2017]
[Section 8.0190amended byOrd. #2018-09passedSeptember11,2018]
[Section 8.0190amended byOrd. #2020-15passedNovember 10, 2020]
[Section 8.0190amended byOrd. #2022-04passedJune 28, 2022]
[Section 8.0190amended byOrd. #2022-09passedDecember 13, 2022]
[Section 8.0190amended byOrd. #2023-07passedDecember 19, 2023]
CHAPTER 8 DEVELOPMENT REGULATIONS 75 ChildCareFacility O O O O O O C C N O Ifafacilityispartofan industrialdevelopmentand withinthemanufacturing structure,aconditionaluse permitisnotrequired. DryCleaner(drop-offonly) O O N O O* O N C N O DryCleaner(fullservice) O C N C O* N N C N C Kennel C N N C N N O C O N Laundromat O O N O O O N C N O MiniStorage C N N C N N C C N N SeeSection8.0615(17). Mortuary,FuneralHome O O O N N O N C N O Motel,Hotel O O C O O O C N N O PrintingandCopyingStore O O N O O* O N C N O VeterinarianServices O O O O O O O C O C FullyenclosedinCzones;no outdoorkennels.
O*Maximumsize=10,000squarefeet O**Maximumsize=20,000squarefeet
8.0195Table D, Minimum Standards. The following minimum standards are required in each oftheCommercialandIndustrialzonesas follows(alldistances aremeasuredinfeet):
Note: Residential uses permitted in Commercial and Industrial zonesshall besubject to thedensity standardsfor theR-5 zone, except for the Downtown Overlay District and theC-2 and C-3 zones, for which thereisno maximum density standard.
*Theminimumlotsizeshallbedeterminedbasedondemonstrationoftheabilitytodevelopthesiteinaccordancewiththezonestandards,offstreetparkingstandards,Site&DesignReviewStandards,landscapingrequirementsandotherapplicableDevelopmentCodeprovisionswithout adverseimpacttowaterandlandresourcequalityandadjoiningproperties.
A Arearyardabuttinganalleyshallbe25feetfromthepropertylinetofoundationwhenthealleyisusedtoservicethecommercialestablishment and10feetinothercases.
B Maximumbuildingheightislimitedto45feetforallstructureswithinonefullcityblockofaresidentialzone.Whereallowedbuildingsover45 feetshallconformtheUpperFloorSetbackStandardsintheDowntownOverlayZoneSiteandDesignStandardsinSection8.0175(5).
C RearyardsalongthenorthsideofHighlandAvenue/Highway126betweenSW23rdandSW27thStreetsshallhaveaminimumarterial setbackof25feet.Allotherrearsetbacksadjacenttoarterialsshallbe50feet.
CHAPTER 8 DEVELOPMENT
76
REGULATIONS
C-1 C-2 C-3 C-4 C-4A C-5 M-1 & M-1.5 M-2 LLI DOD Minimum Yard Setbacks Front LocalStreet 10 H 5 10 10 10 10 10 10 10 H 2 Collector 25 25 25 25 25 25 25 25 Arterial 50 50 50 50 50 50 50 50 InteriorSide Standard D 5 F 10-15 F 10-15 10-15 AdjacenttoR-Zone 25 25 25 25 StreetSide LocalStreet 10 10 10 10 50 10 10 10 Collector 25 25 25 25 50 25 25 25 Arterial 50 25 50 50 50 50 50 50 Rear Interior D 5 10 10 10 LocalStreet 10 10 10 10 50 10 10 10 Collector 25 25 25 25 50 25 25 25 Arterial 50 25 C 25/50 25 50 50 50 50 AdjacenttoR-Zone 25 25 25 25 50 Adjacenttoalley A 10/25 A 10/25 A 10/25 A 10/25 Maximum FrontYard Setback I 15 I 10 Maximum Building Height 60 B 50/60 60 60 60 60 60 60 60 G 50/60/75 Minimum Street Frontage StandardStreet 50 50 50 50 50 50 50 50 50 Cul-de-sac 30 30 30 30 30 30 30 30 30 Minimum Lot Size* 200 acres for1st Lot.50 acres
D TheminimumsetbackbetweenastructureandanexistinguseintheC-5zoneshallbe5feetfromthepropertylineand10feetfromany adjacentstructureonthesubjectsiteoradjacentproperty.
E Nouselocatedinanindustrialzoneadjacenttooracrossthestreetfromaresidentialzoneshallexceed60%ofthelotareaincludingbuildings, storageorfacilities,andoff-streetparkingandloading.
F Theminimumsideyardinanindustrialzoneshallbe10feetfor1and2storybuildingsand15feetfor3storybuildings.
G Maximumbuildingheightislimitedto50feetforallstructureswithinonefullcityblockofaresidentialzone.Whereallowed,buildingsover50 feetshallconformtheDowntownOverlayDistrictSiteandDesignStandardsinSection8.0175(5).Themaximumbuildingheightforstructures westofSW5th Streetis60feet.Themaximumbuildingheightforstructureseastof5th Streetis75feetandmaybeincreasedabove75feetifa ConditionalUsePermitforthestructureisapprovedbyaHearingsandReviewAuthority.
H Existingzero-lotlinestructuresasofAugust12,2008,shallbeexemptfromthisstandard.Atthetimethefrontfaçadeofabuildingorabuilding isdemolishedasdefinedbythisCode,thenthebuildingshallcomplywiththisstandardunlessavarianceisapproved.
I Fullblockdevelopmentsrequireaminimumof50percentofthebuildingfaçadetobedevelopedtotheminimumsetback.Asphaltandirrigated turfareprohibitedinthefrontyardsetback(concrete,pavers,landscapingareallowed).
[Section 8.0195amended byOrd. #2012-10passedAugust 14, 2012]
[Section 8.0195amended byOrd. #2014-12passedMay27, 2014]
[Section 8.0195amended byOrd. #2015-11passedSeptember22,2015]
[Section 8.0195amended byOrd. #2018-09passedSeptember11,2018]
[Section 8.0195amended byOrd. #2020-15passedNovember 10, 2020]
[Section 8.0195amended byOrd. #2022-04passedJune 28, 2022]
[Section 8.0195amended byOrd. #2023-07passedDecember 19, 2023]
CHAPTER 8 DEVELOPMENT REGULATIONS 77