


Report Date: 9/29/2025 3:40:35 PM
The information and maps presented in this report are provided for your convenience. Every reasonable effort has been made to assure the accuracy of the data and associated maps. Deschutes County makes no warranty, representation or guarantee as to the content, sequence, accuracy, timeliness or completeness of any of the data provided herein. Deschutes County explicitly disclaims any representations and warranties, including, without limitation, the implied warranties of merchantability and fitness for a particular purpose. Deschutes County shall assume no liability for any errors, omissions, or inaccuracies in the information provided regardless of how caused. Deschutes County assumes no liability for any decisions made or actions taken or not taken by the user of this information or data furnished hereunder.
Review of digital records maintained by the Deschutes County Assessor’s Office, Tax Office, Finance Office, and the Community Development Department indicates that there are no special tax, assessment or property development related notations associated with this account. However, independent verification of the presence of other Deschutes County tax, assessment, development, and additional property related considerations is recommended. Confirmation is commonly provided by title companies, real estate agents, developers, engineering and surveying firms, and other parties who are involved in property transactions or property development. In addition, County departments may be contacted directly to discuss the information.
Related accounts apply to a property that may be on one map and tax lot but due to billing have more than one account. This occurs when a property is in multiple tax code areas. In other cases there may be business personal property or a manufactured home on this property that is not in the same ownership as the land.
DR, REDMOND, OR 97756
LIBRARY DISTRICT DESCHUTES PUBLIC LIBRARY (541) 617-7050 601 NW WALL ST, BEND, OR 97703
WATER SERVICE PROVIDER REDMOND WATER DEPARTMENT (541) 504-2000
Permit Number:
711-B61814
Permit Name: ROBERT L LEVER
EADY,THEODORE LOWELL;EADY,KERI
Contractor:
Commercial Building Class: WALL SIGN: MARTIAL ARTS CENTER Class of Work: WALL SIGN: MARTIAL ARTS CENTER Building Use:
Inspections
Date Init. Comments
04/04/2006 Application Date: 05/23/2006 Issue Date: 05/25/2006 Final Date:
05/25/2006 RWW 1999 Final Building -- Insp Cancelled : Information Only
05/03/2006 PMT CALLED LEVER SIGN SPW SUE ADV PERMIT IS READY & AMT OWING.
04/21/2006 MEC ROUTED TO CITY OF REDMOND
04/20/2006 MEC ND DETAILS PROVIDED FOR SIGN ATTACHMENT
04/12/2006 PMT GAVE FILE TO DENNIS P TO GIVE TO DAN HORTON FOR PLAN REVIEW.
04/11/2006 DSE APPROVED BY PLANNING; FORWARDED TO BUILDING FOR REVIEW.
Finaled Status:
04/04/2006 RFG FORWARDED SIGN PERMIT SUBMITTAL TO GAIL BLOOM TO PREPARE FILE FOR SCOTT E.
Building Permit
Permit Number:
Permit Name:
Contractor:
711-S95-543501
Commercial Building Class: Class of Work: NEW AWNING Building Use:
Inspections
No inspection records found.
Assessor's Office Supplemental Information
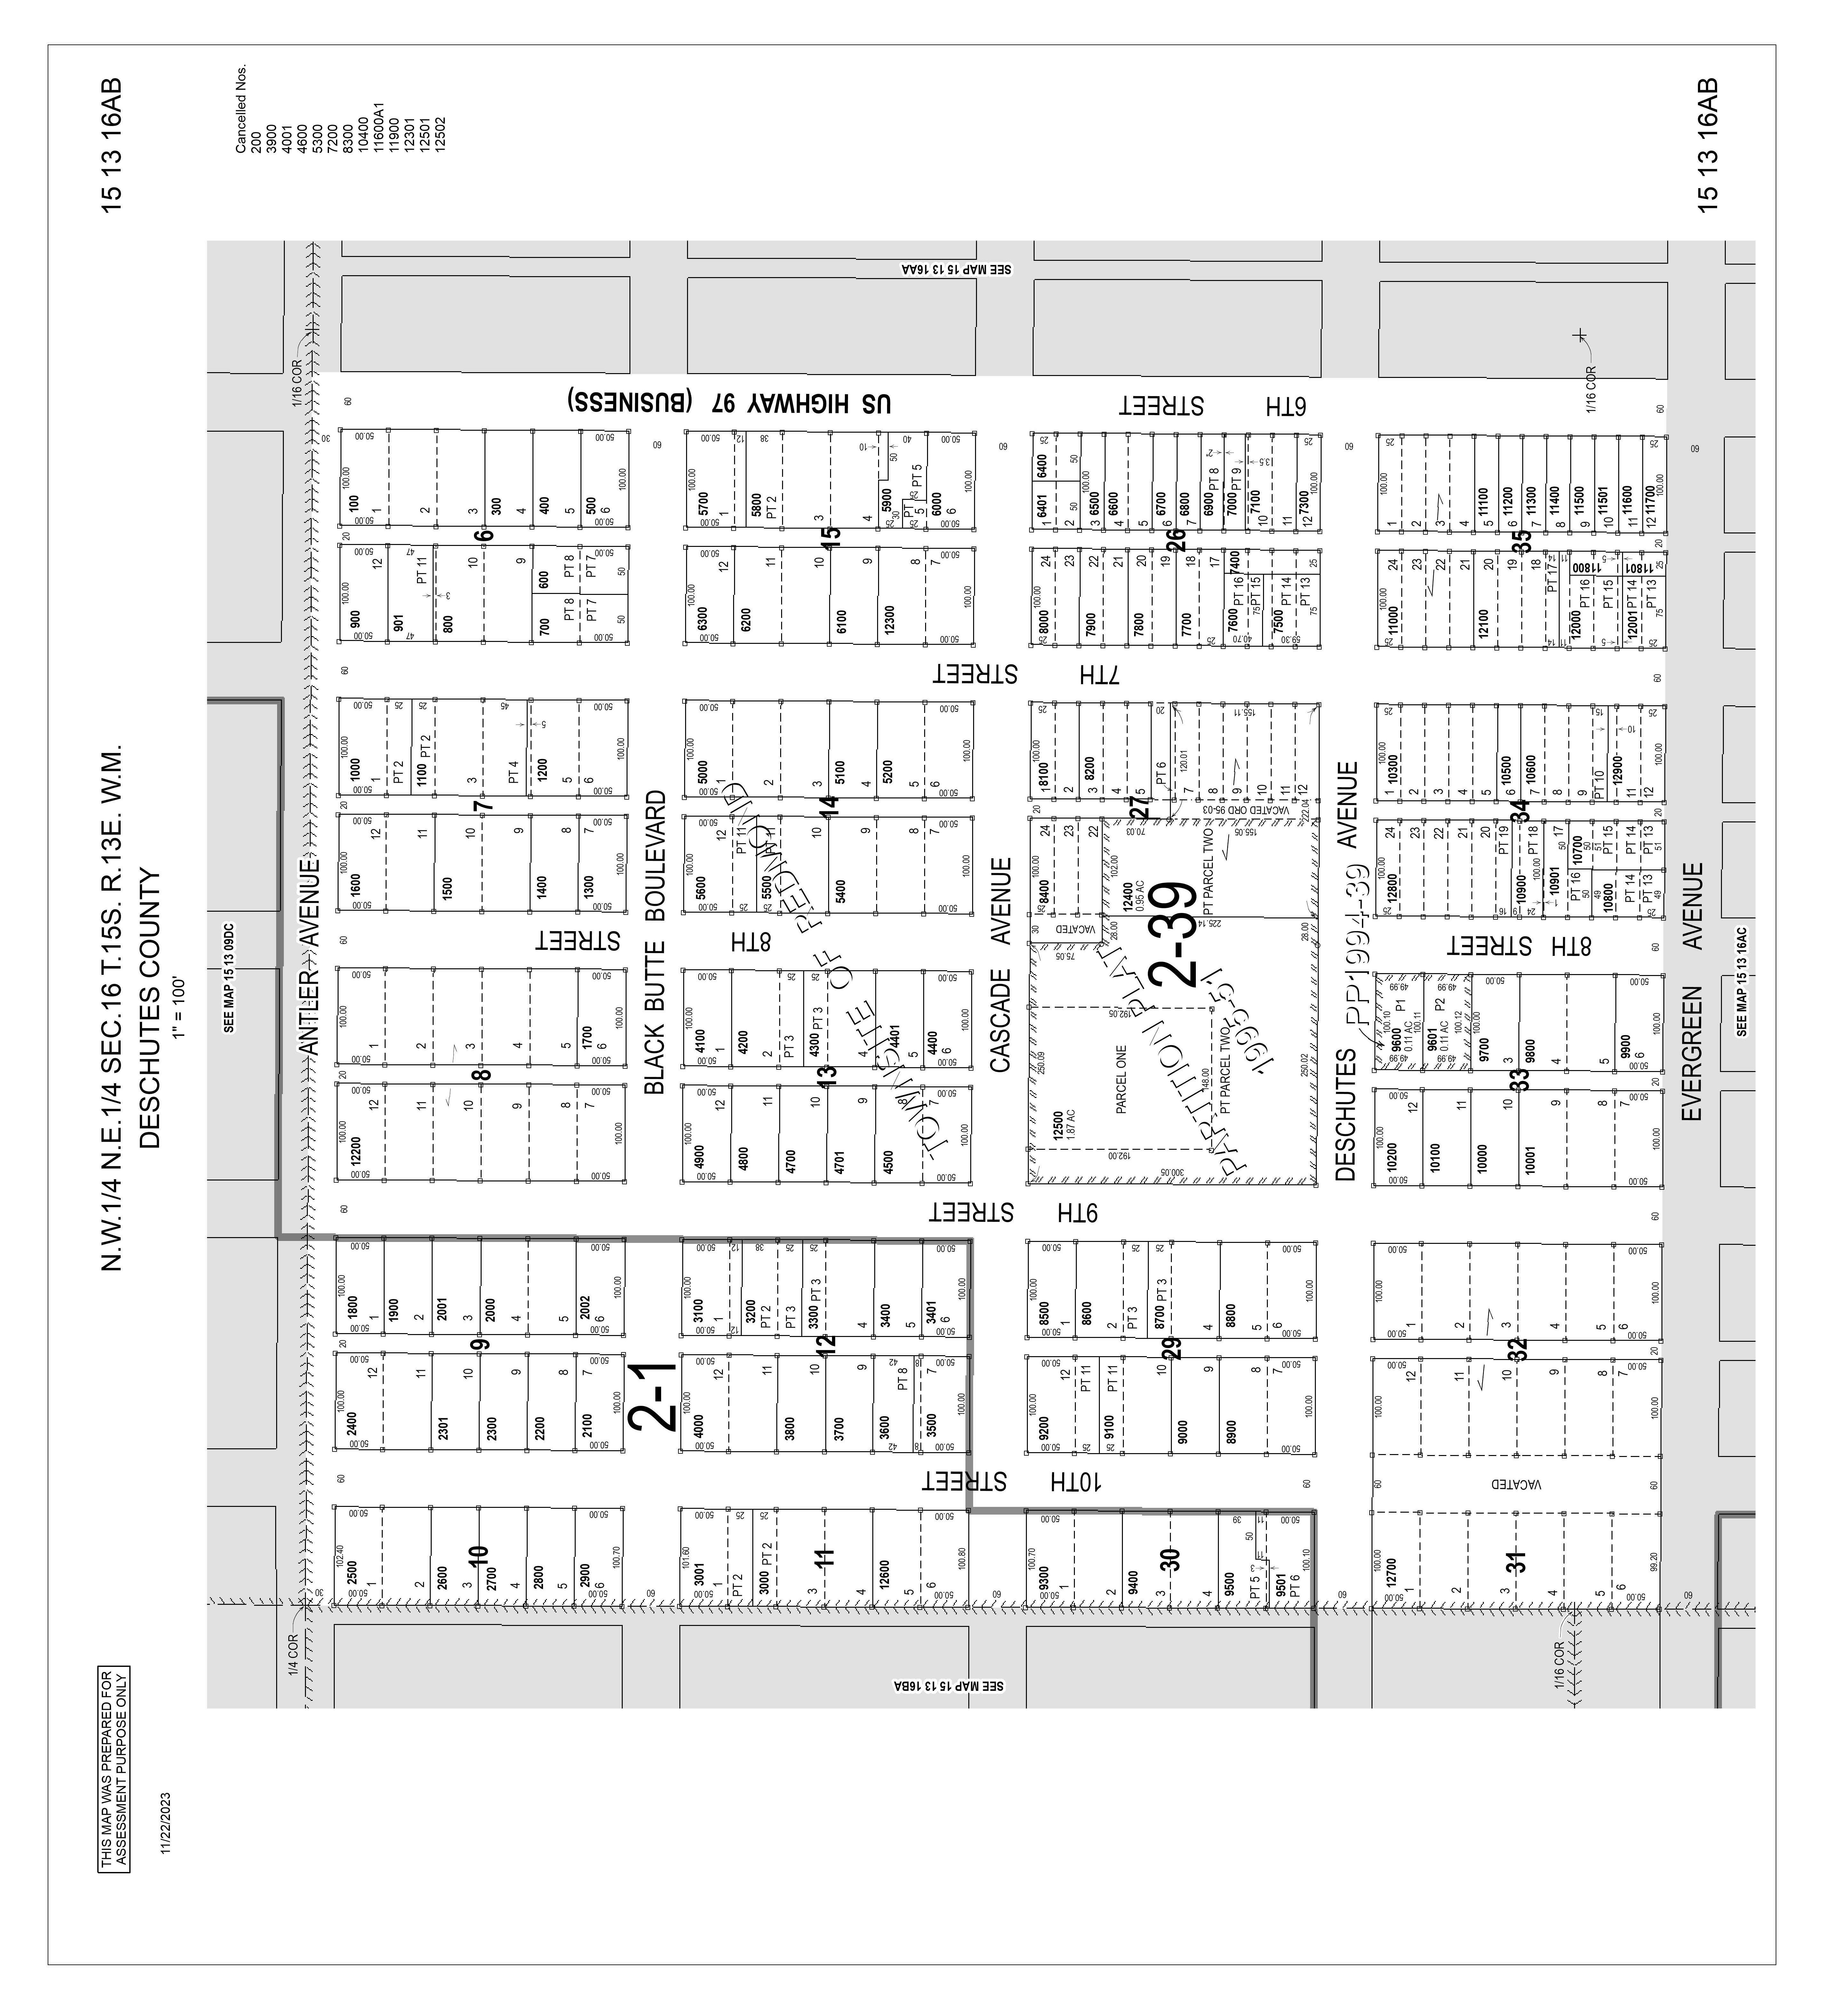
Legal Description:
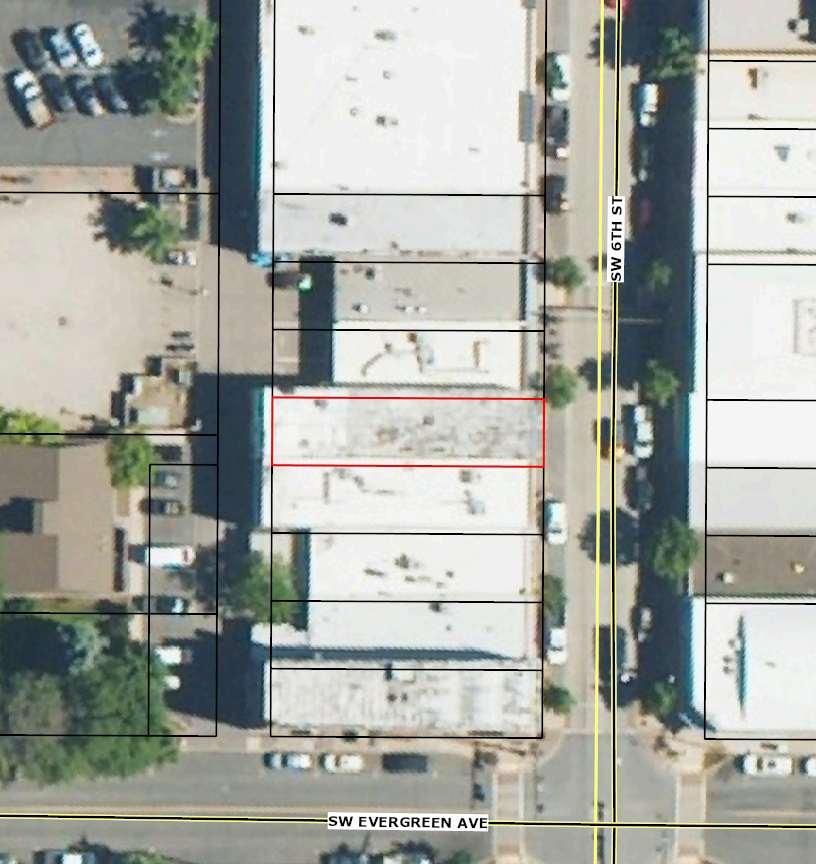
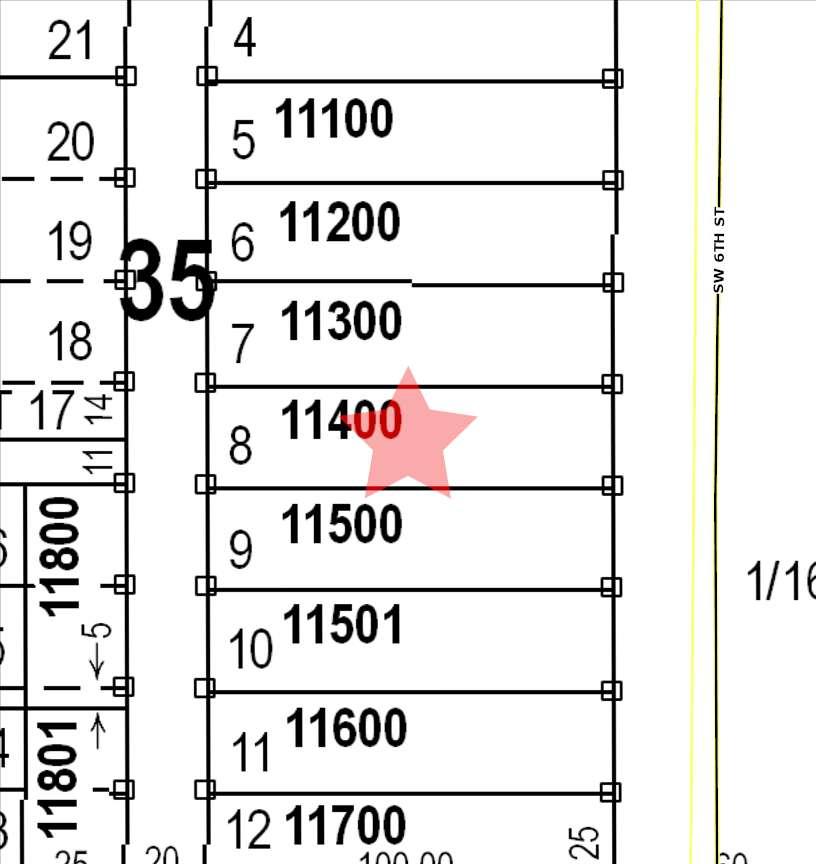
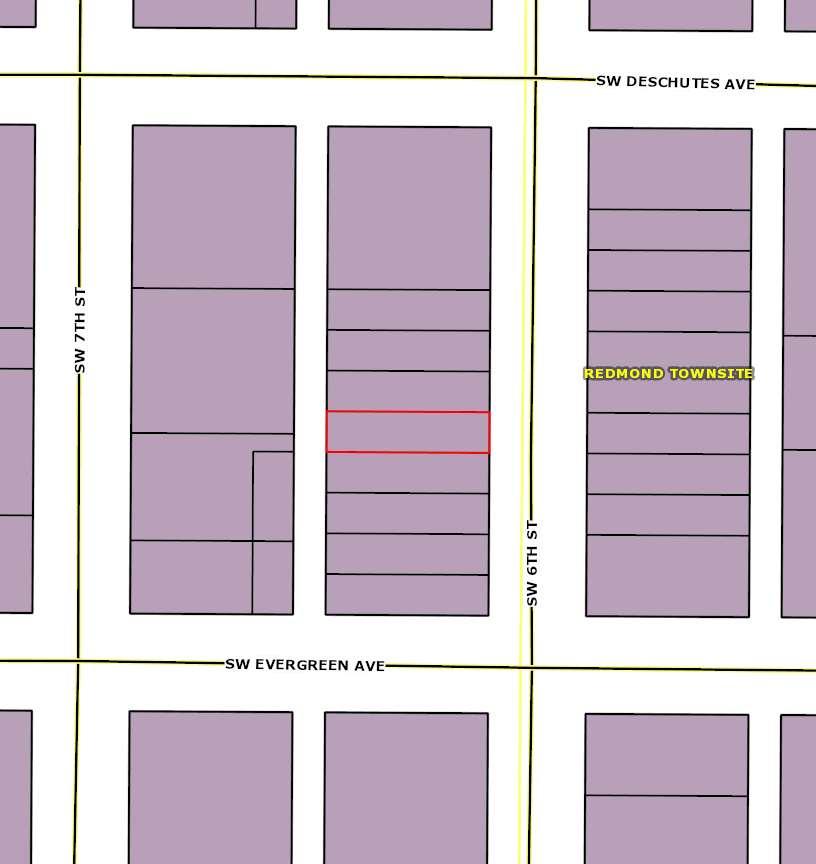
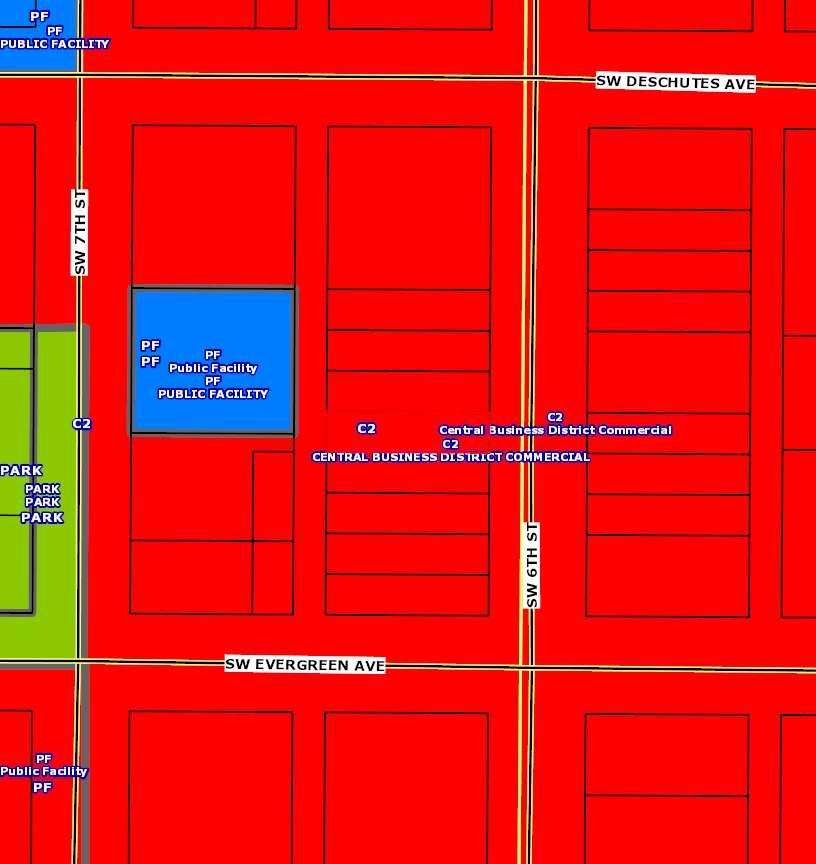
Subdivision: TOWNSITE OF REDMOND Lot: 8 Block: 35
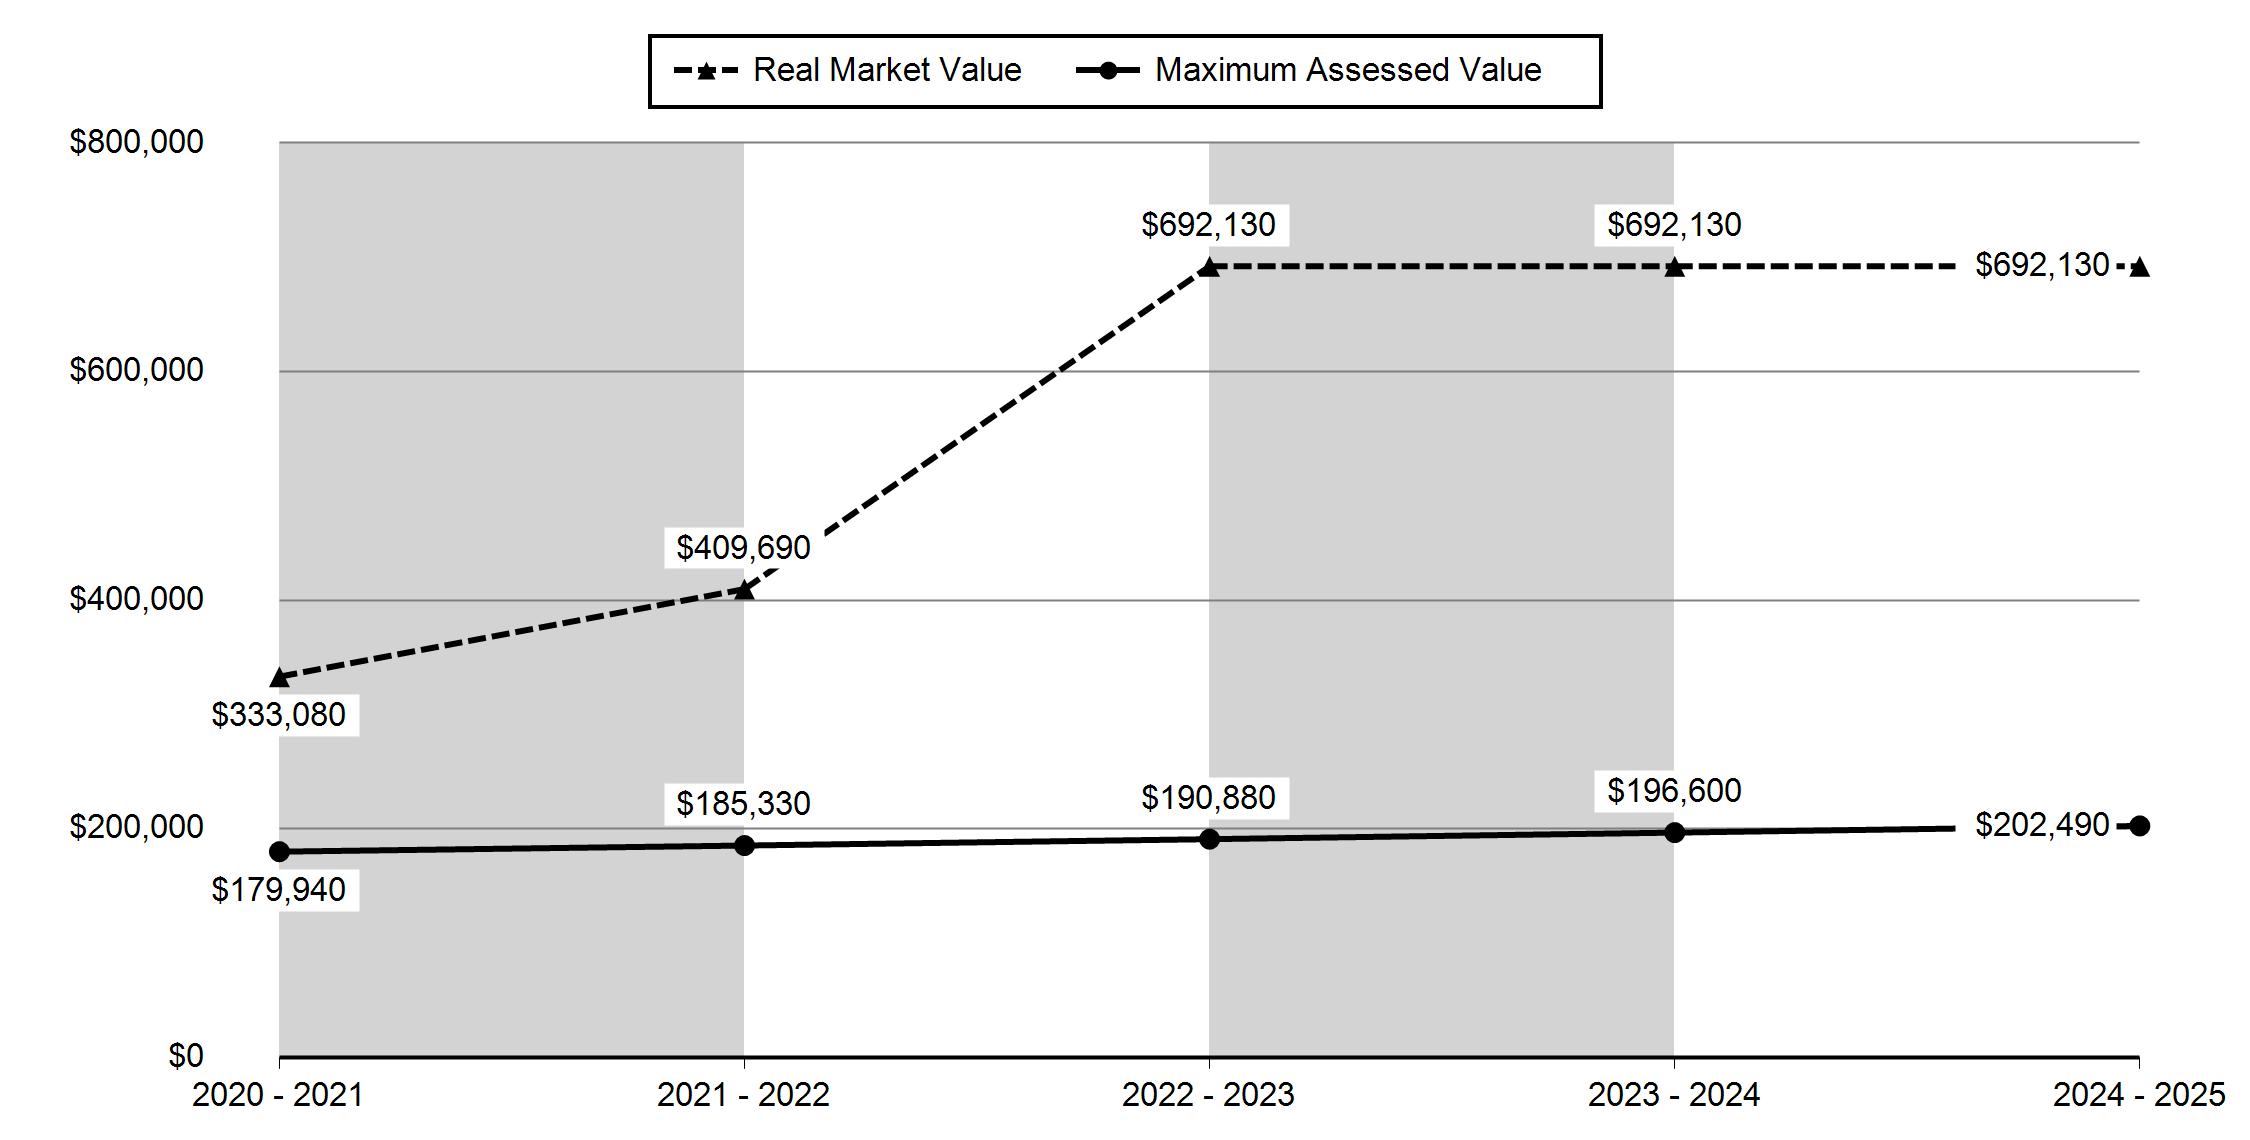
JULY 1, 2024 TO JUNE 30, 2025
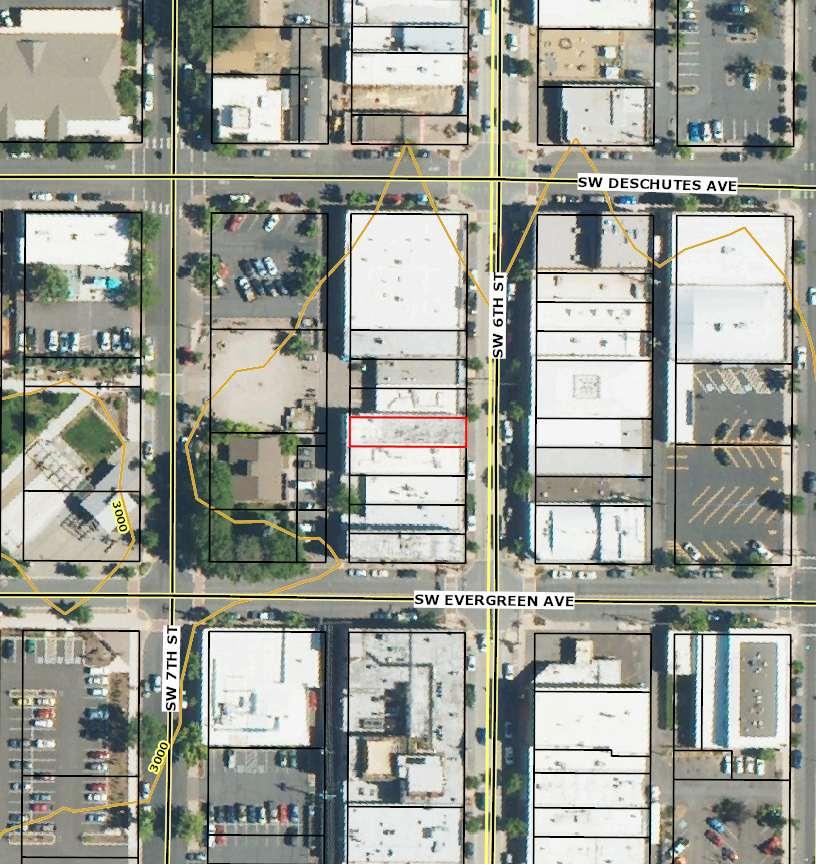
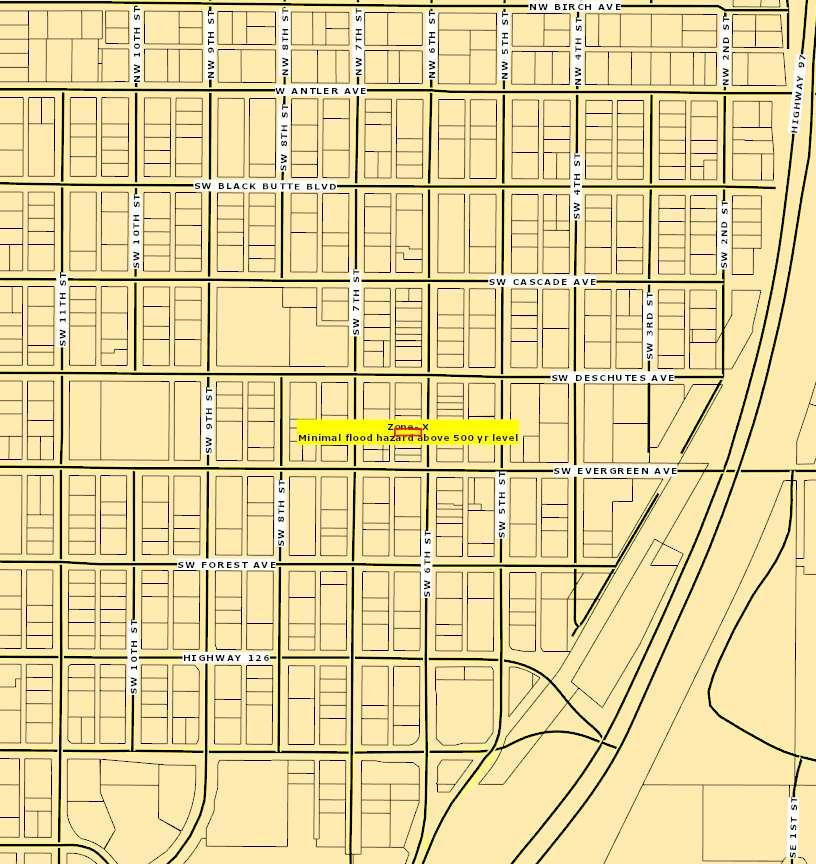
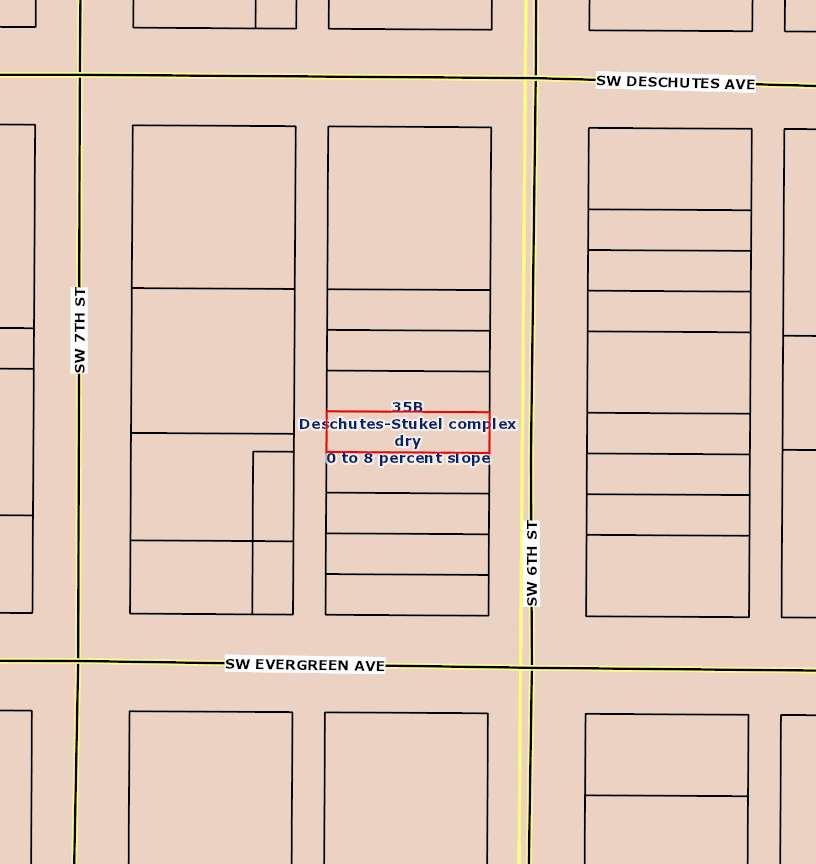
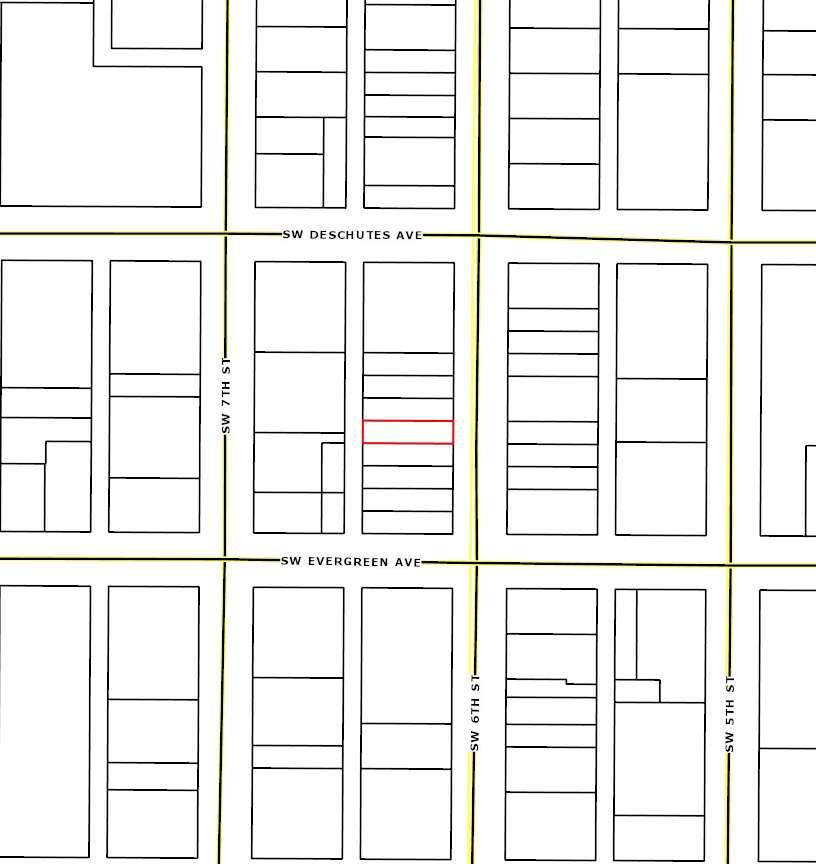
435 SW 6TH ST REDMOND SITUS ADDRESS:
Full Payment with 3% Discount Discount is lost after due date and interest may apply PAYMENT OPTIONS: * Online
$4,083.95
* By Mail to Deschutes County Tax, PO
Please include this coupon with payment. Please do not staple, paper clip or tape your payment.
Please select payment option
One-Third Payment (No Discount) Next Payment Due
Two-Thirds Payment (2% Discount) Next Payment Due
Payment Due November 15, 2024
address change form on reverse) Full Payment (3% Discount)
Please make checks payable to Deschutes County Tax Collector
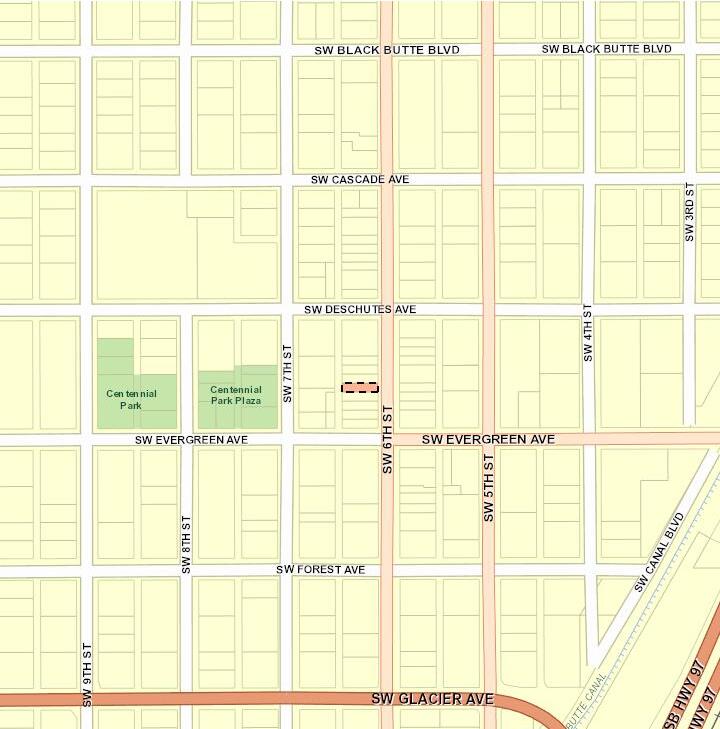
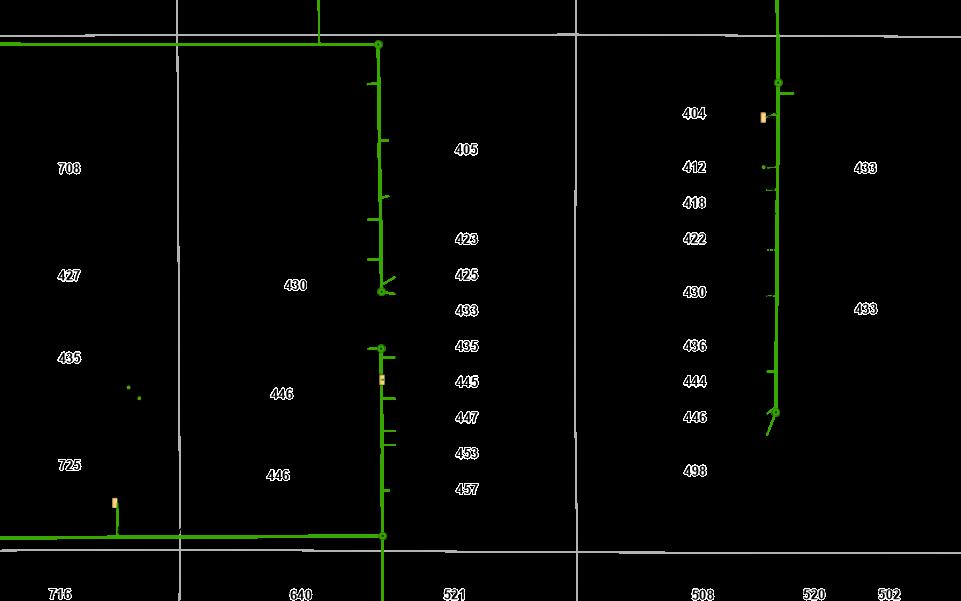
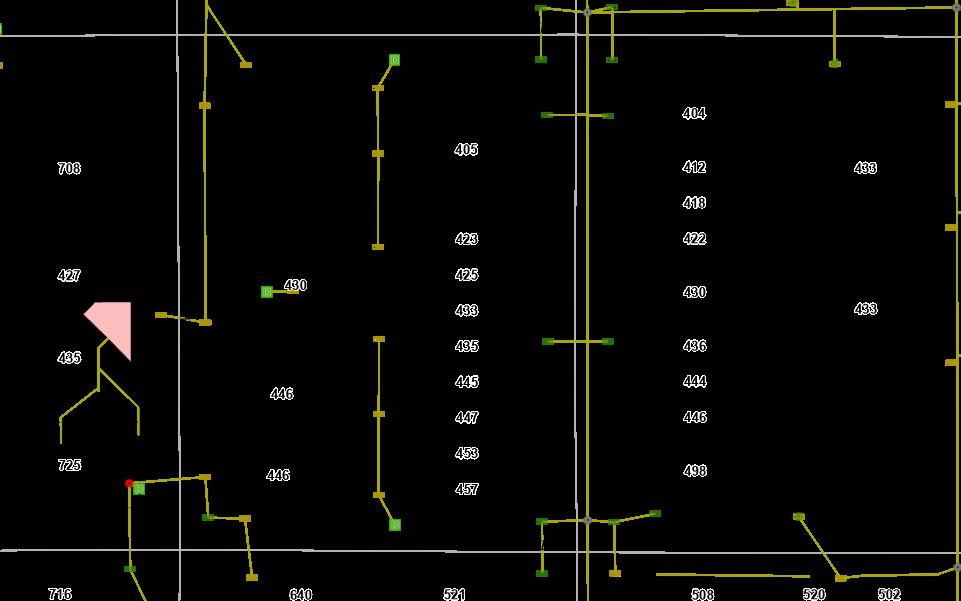
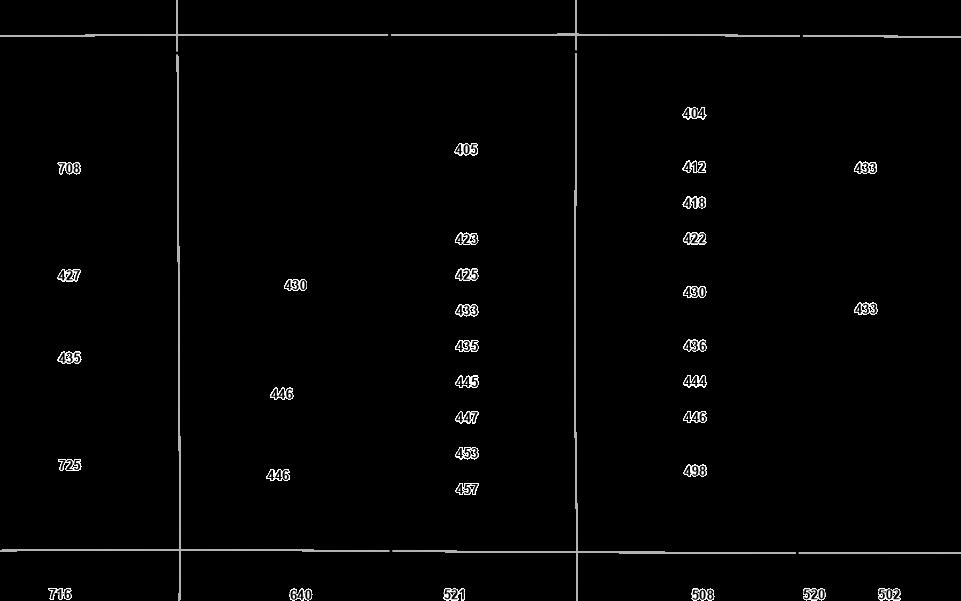
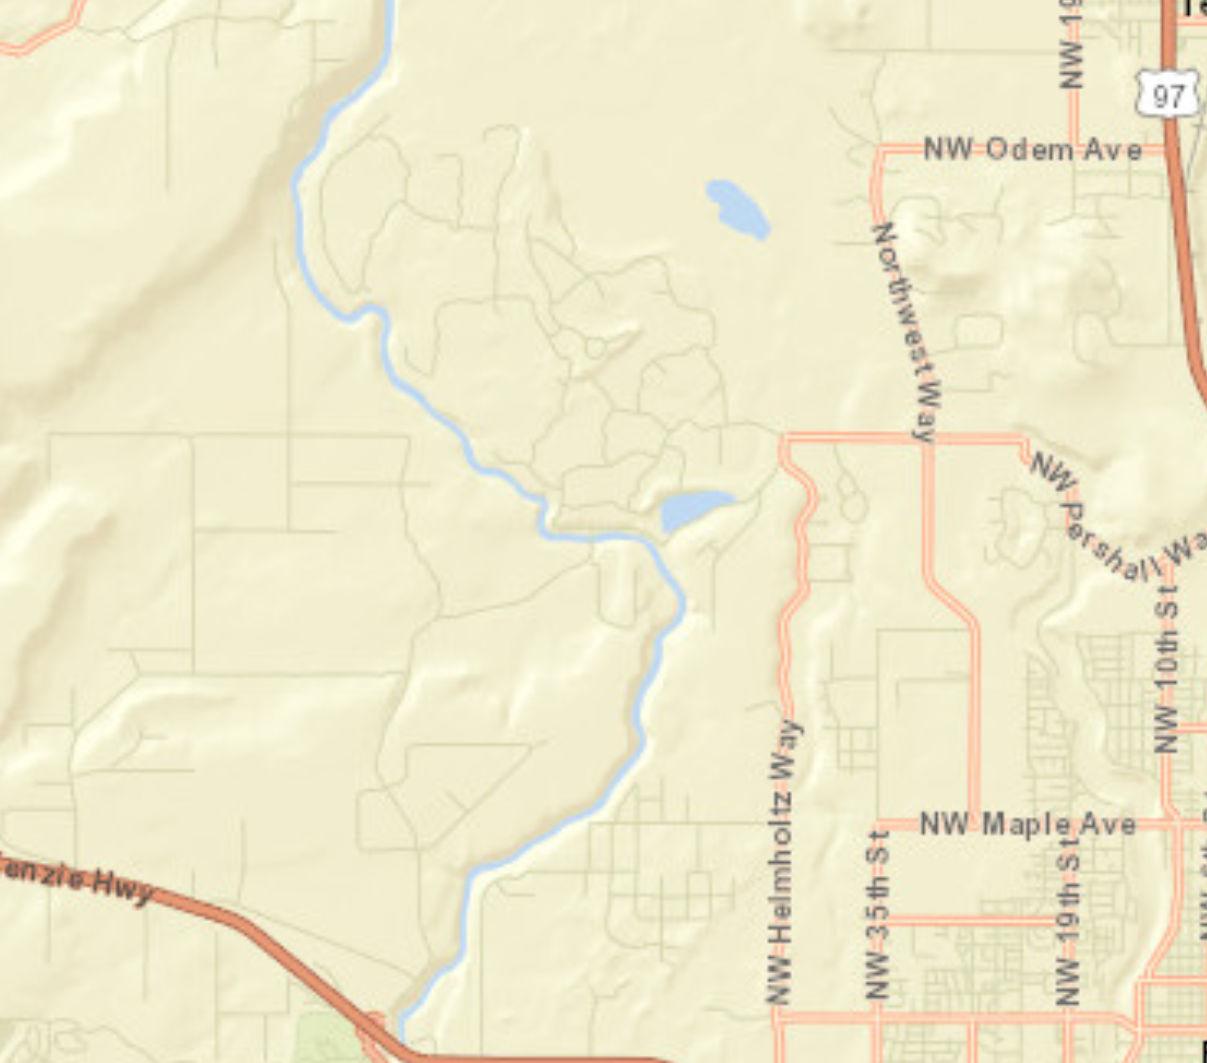
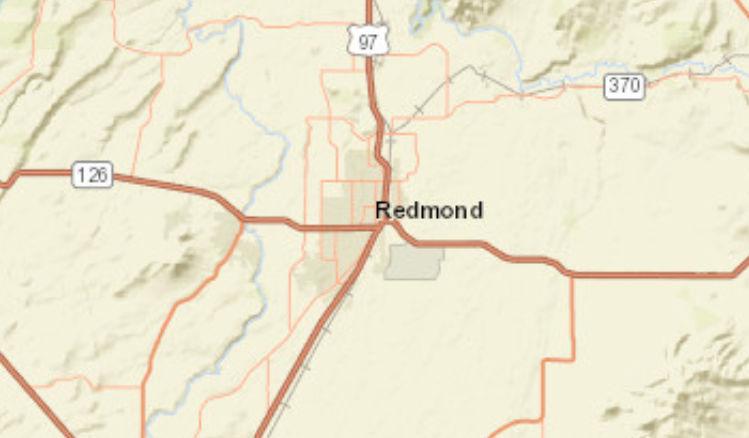
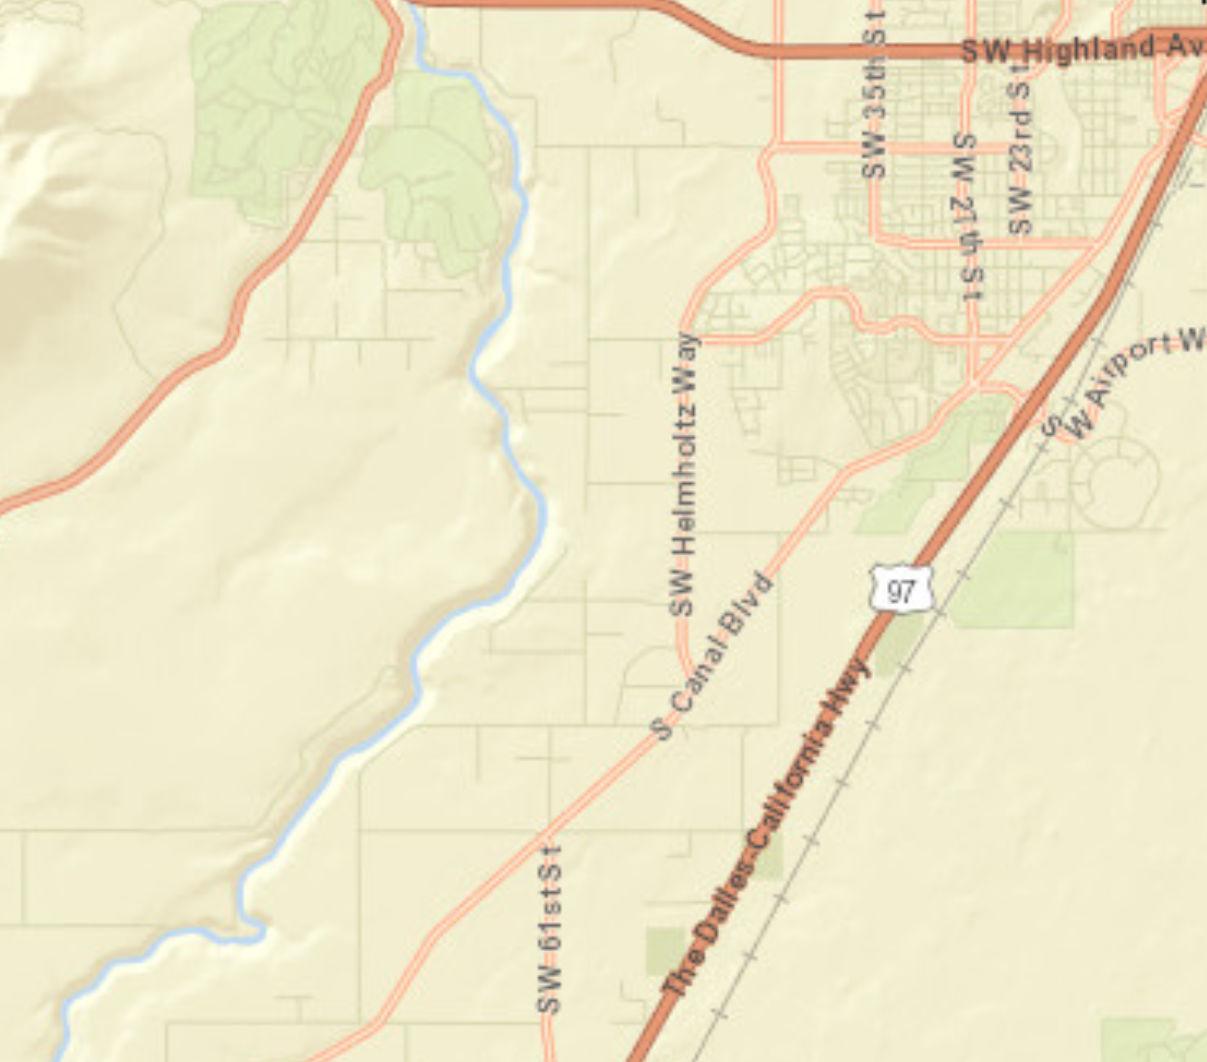
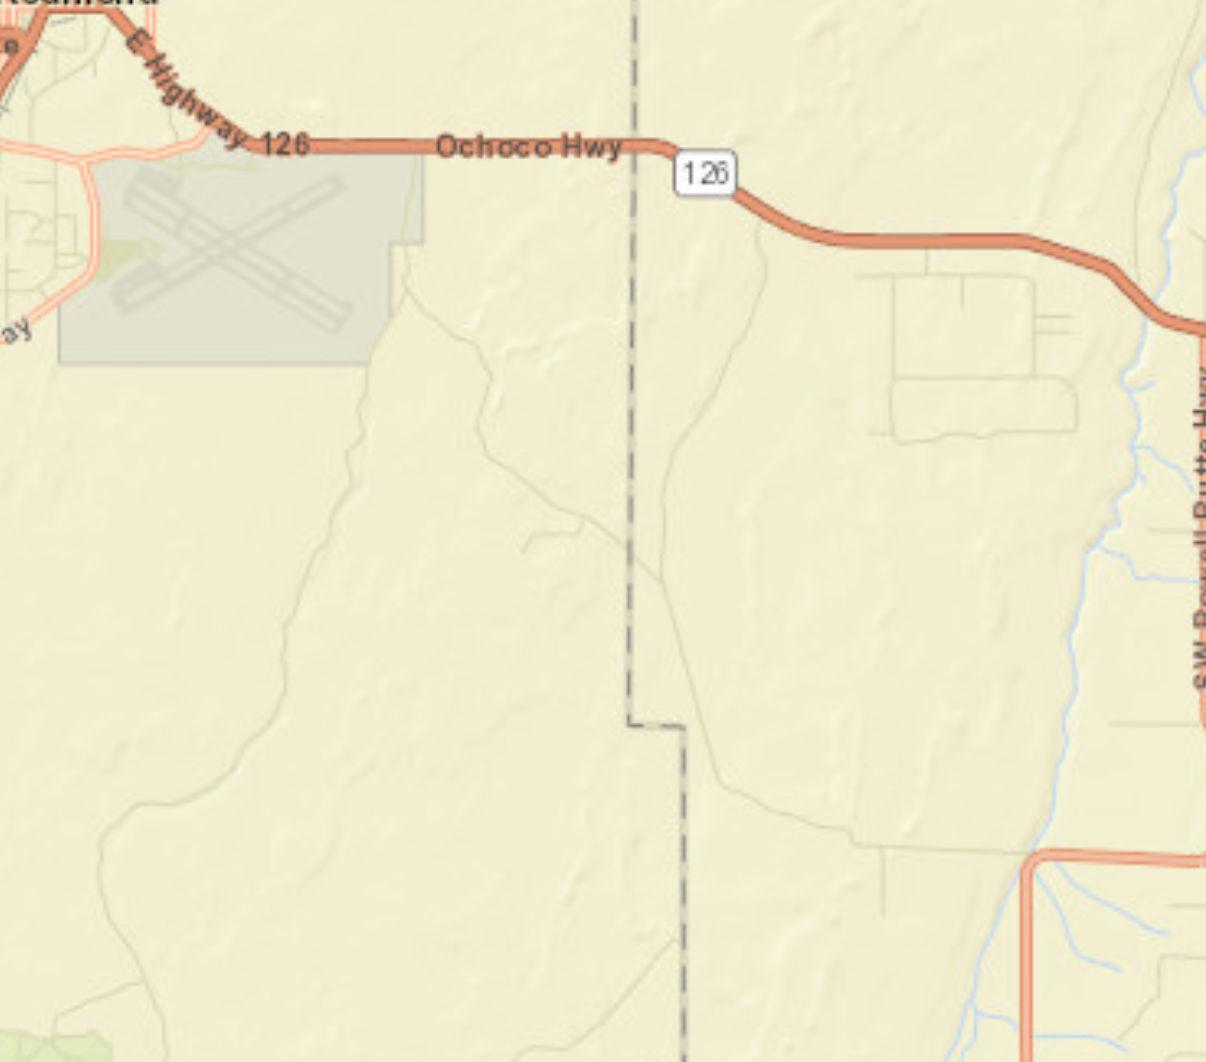
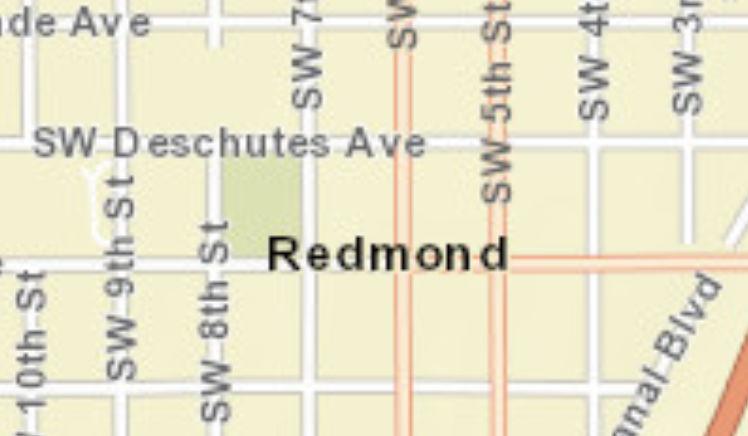
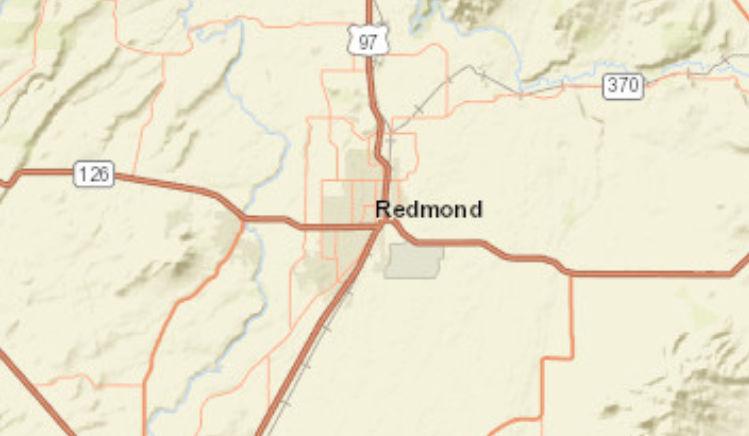
Roa d Map


The contents of Chapter Development Regulations can be found here:
https://www.redmondoregon.gov/home/showpublisheddocument/3426/638091
082331730000
https://deschutescounty.municipalcodeonline.com/book?type=ordinances#name =TITLE_18_COUNTY_ZONING
Subdivision and/or CC&R’s (Plat Map only)
https://issuu.com/infodeschutestitle/docs/townsite_of_redmond?fr=xKAE9_zMzMw


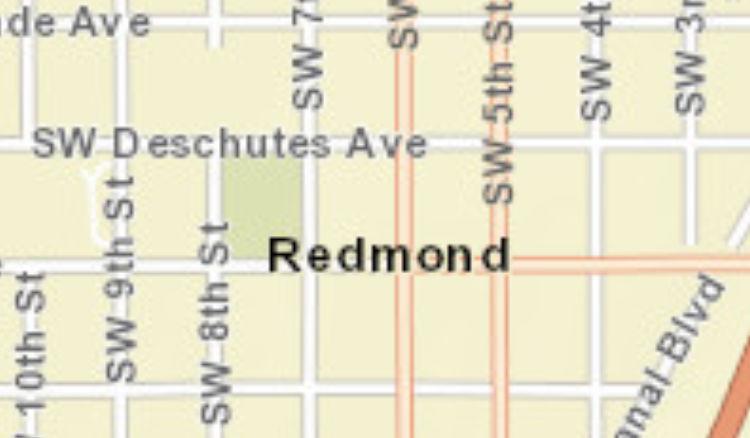


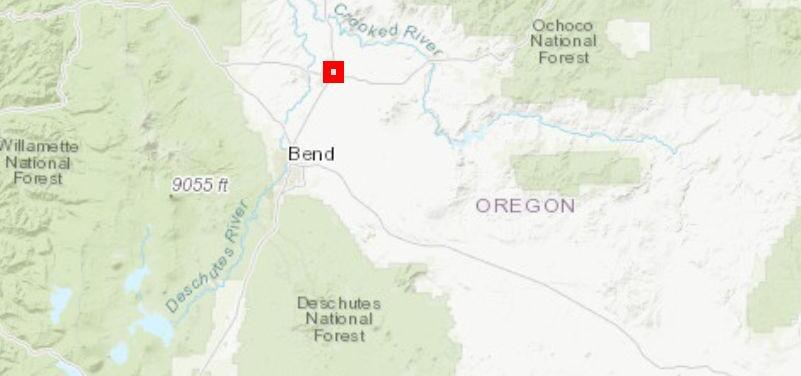
435 SW 6th St, Redmond, Oregon, 97756
Ring: 1 mile radius
435 SW 6th St, Redmond, Oregon, 97756
Ring: 1 mile radius
HOUSEHOLDS BY PRESENCE OF PEOPLE UNDER 18 YEARS BY HOUSEHOLD
HOUSEHOLDS BY PRESENCE OF PEOPLE 65 YEARS AND OVER,
AND
HOUSEHOLD TYPE BY RELATIVES AND NONRELATIVES FOR POPULATION IN HOUSEHOLDS
435 SW 6th St, Redmond, Oregon, 97756
Ring: 1 mile radius
POPULATION AGE 5+ YEARS BY LANGUAGE SPOKEN AT HOME AND ABILITY TO SPEAK ENGLISH
5 to 17 years
18 to 64 years
Source: ACS
435 SW 6th St, Redmond, Oregon, 97756
Ring: 1 mile radius
WORKERS AGE 16+ YEARS BY PLACE OF WORK
435 SW 6th St, Redmond, Oregon, 97756
Ring: 1 mile radius
WORKERS AGE 16+ YEARS BY MEANS OF TRANSPORTATION TO
WORKERS
435 SW 6th St, Redmond, Oregon, 97756
Ring: 1 mile radius
435 SW 6th St, Redmond, Oregon, 97756
Ring: 1 mile radius
BY RATIO OF INCOME TO POVERTY
CIVILIAN POPULATION AGE 18 OR OLDER BY VETERAN STATUS
CIVILIAN VETERANS AGE 18 OR OLDER BY PERIOD OF
HOUSEHOLDS BY POVERTY STATUS
435 SW 6th St, Redmond, Oregon, 97756
Ring: 1 mile radius
Data Note: N/A means not available. Population by Ratio of Income to Poverty Level represents persons for whom poverty status is determined. Household income represents income in 2023, adjusted for inflation.
2019-2023 ACS Estimate: The American Community Survey (ACS) replaces census sample data. Esri is releasing the 2019-2023 ACS estimates, five-year period data collected monthly from January 1, 2019 through December 31, 2023. Although the ACS includes many of the subjects previously covered by the decennial census sample, there are significant differences between the two surveys including fundamental differences in survey design and residency rules.
Margin of error (MOE): The MOE is a measure of the variability of the estimate due to sampling error. MOEs enable the data user to measure the range of uncertainty for each estimate with 90 percent confidence. The range of uncertainty is called the confidence interval, and it is calculated by taking the estimate +/- the MOE. For example, if the ACS reports an estimate of 100 with an MOE of +/- 20, then you can be 90 percent certain the value for the whole population falls between 80 and 120.
Reliability: These symbols represent threshold values that Esri has established from the Coefficients of Variation (CV) to designate the usability of the estimates. The CV measures the amount of sampling error relative to the size of the estimate, expressed as a percentage.
High Reliability: Small CVs (less than or equal to 12 percent) are flagged green to indicate that the sampling error is small relative to the estimate and the estimate is reasonably reliable.
Medium Reliability: Estimates with CVs between 12 and 40 are flagged yellow. Use with caution.
Low Reliability: Large CVs (over 40 percent) are flagged red to indicate that the sampling error is large relative to the estimate. The estimate is considered very unreliable.
Source: ACS Reliability: high medium low September 29, 2025
435 SW 6th St, Redmond, Oregon, 97756
Ring: 3 mile radius
AGE 3+ YEARS BY SCHOOL ENROLLMENT
HOUSEHOLDS BY TYPE AND SIZE
435 SW 6th St, Redmond, Oregon, 97756
Ring: 3 mile radius
HOUSEHOLDS BY PRESENCE OF PEOPLE UNDER 18 YEARS BY HOUSEHOLD TYPE
HOUSEHOLDS BY PRESENCE OF PEOPLE 65 YEARS AND OVER,
Source:
435 SW 6th St, Redmond, Oregon, 97756
Ring: 3 mile radius
POPULATION AGE 5+ YEARS BY LANGUAGE SPOKEN AT HOME AND ABILITY TO SPEAK ENGLISH
5 to 17 years
18 to 64 years
65 years and over
435 SW 6th St, Redmond, Oregon, 97756
Ring: 3 mile radius
WORKERS AGE 16+ YEARS BY PLACE OF WORK
POPULATION IN HOUSEHOLDS AND PRESENCE OF A COMPUTER
435 SW 6th St, Redmond, Oregon, 97756
Ring: 3 mile radius
WORKERS AGE 16+ YEARS BY MEANS OF TRANSPORTATION TO WORK
WORKERS AGE 16+ YEARS (WHO DID NOT WORK FROM HOME)
435 SW 6th St, Redmond, Oregon, 97756
Ring: 3 mile radius
435 SW 6th St, Redmond, Oregon, 97756
Ring: 3 mile radius
BY RATIO OF INCOME TO POVERTY
CIVILIAN POPULATION AGE 18 OR OLDER BY VETERAN STATUS
CIVILIAN VETERANS AGE 18 OR OLDER BY PERIOD OF
435 SW 6th St, Redmond, Oregon, 97756
Ring: 3 mile radius
Data Note: N/A means not available. Population by Ratio of Income to Poverty Level represents persons for whom poverty status is determined. Household income represents income in 2023, adjusted for inflation.
2019-2023 ACS Estimate: The American Community Survey (ACS) replaces census sample data. Esri is releasing the 2019-2023 ACS estimates, five-year period data collected monthly from January 1, 2019 through December 31, 2023. Although the ACS includes many of the subjects previously covered by the decennial census sample, there are significant differences between the two surveys including fundamental differences in survey design and residency rules.
Margin of error (MOE): The MOE is a measure of the variability of the estimate due to sampling error. MOEs enable the data user to measure the range of uncertainty for each estimate with 90 percent confidence. The range of uncertainty is called the confidence interval, and it is calculated by taking the estimate +/- the MOE. For example, if the ACS reports an estimate of 100 with an MOE of +/- 20, then you can be 90 percent certain the value for the whole population falls between 80 and 120.
Reliability: These symbols represent threshold values that Esri has established from the Coefficients of Variation (CV) to designate the usability of the estimates. The CV measures the amount of sampling error relative to the size of the estimate, expressed as a percentage.
High Reliability: Small CVs (less than or equal to 12 percent) are flagged green to indicate that the sampling error is small relative to the estimate and the estimate is reasonably reliable.
Medium Reliability: Estimates with CVs between 12 and 40 are flagged yellow. Use with caution.
Low Reliability: Large CVs (over 40 percent) are flagged red to indicate that the sampling error is large relative to the estimate. The estimate is considered very unreliable.
Source: ACS Reliability: high medium low September 29, 2025
435 SW 6th St, Redmond, Oregon, 97756
Ring: 5 mile radius
AGE 3+ YEARS BY SCHOOL ENROLLMENT
435 SW 6th St, Redmond, Oregon, 97756
Ring: 5 mile radius
HOUSEHOLDS BY PRESENCE OF PEOPLE UNDER 18 YEARS BY HOUSEHOLD TYPE
HOUSEHOLDS BY PRESENCE OF PEOPLE 65 YEARS AND OVER,
435 SW 6th St, Redmond, Oregon, 97756
Ring: 5 mile radius
POPULATION AGE 5+ YEARS BY LANGUAGE SPOKEN AT HOME AND ABILITY TO SPEAK ENGLISH
5 to 17 years
18 to 64 years
65 years and over
435 SW 6th St, Redmond, Oregon, 97756
Ring: 5 mile radius
WORKERS
POPULATION IN HOUSEHOLDS AND PRESENCE OF A COMPUTER
435 SW 6th St, Redmond, Oregon, 97756
Ring: 5 mile radius
WORKERS AGE 16+ YEARS BY MEANS OF TRANSPORTATION TO WORK
WORKERS AGE 16+ YEARS (WHO DID NOT WORK FROM HOME)
435 SW 6th St, Redmond, Oregon, 97756
Ring: 5 mile radius
435 SW 6th St, Redmond, Oregon, 97756
Ring: 5 mile radius
BY RATIO OF INCOME TO POVERTY
CIVILIAN POPULATION AGE 18 OR OLDER BY VETERAN STATUS
CIVILIAN VETERANS AGE 18 OR OLDER BY PERIOD OF MILITARY SERVICE
War (9/01
HOUSEHOLDS BY POVERTY STATUS
435 SW 6th St, Redmond, Oregon, 97756
Ring: 5 mile radius
Data Note: N/A means not available. Population by Ratio of Income to Poverty Level represents persons for whom poverty status is determined. Household income represents income in 2023, adjusted for inflation.
2019-2023 ACS Estimate: The American Community Survey (ACS) replaces census sample data. Esri is releasing the 2019-2023 ACS estimates, five-year period data collected monthly from January 1, 2019 through December 31, 2023. Although the ACS includes many of the subjects previously covered by the decennial census sample, there are significant differences between the two surveys including fundamental differences in survey design and residency rules.
Margin of error (MOE): The MOE is a measure of the variability of the estimate due to sampling error. MOEs enable the data user to measure the range of uncertainty for each estimate with 90 percent confidence. The range of uncertainty is called the confidence interval, and it is calculated by taking the estimate +/- the MOE. For example, if the ACS reports an estimate of 100 with an MOE of +/- 20, then you can be 90 percent certain the value for the whole population falls between 80 and 120.
Reliability: These symbols represent threshold values that Esri has established from the Coefficients of Variation (CV) to designate the usability of the estimates. The CV measures the amount of sampling error relative to the size of the estimate, expressed as a percentage.
High Reliability: Small CVs (less than or equal to 12 percent) are flagged green to indicate that the sampling error is small relative to the estimate and the estimate is reasonably reliable.
Medium Reliability: Estimates with CVs between 12 and 40 are flagged yellow. Use with caution.
Low Reliability: Large CVs (over 40 percent) are flagged red to indicate that the sampling error is large relative to the estimate. The estimate is considered very unreliable.
Source: ACS Reliability: high medium low September 29, 2025
Data Note: Household population includes persons not residing in group quarters. Average Household Size is the household population divided by total households. Persons in families include the householder and persons related to the householder by birth, marriage, or adoption. Per Capita Income represents the income received by all persons aged 15 years and over divided by the total population.
Source: Esri forecasts for 2025 and 2030. U.S. Census Bureau 2000 and 2010 decennial Census data converted by Esri into 2020 geography. September 29, 2025
435 SW 6th St, Redmond, Oregon, 97756
Rings: 1, 3, 5 mile radii
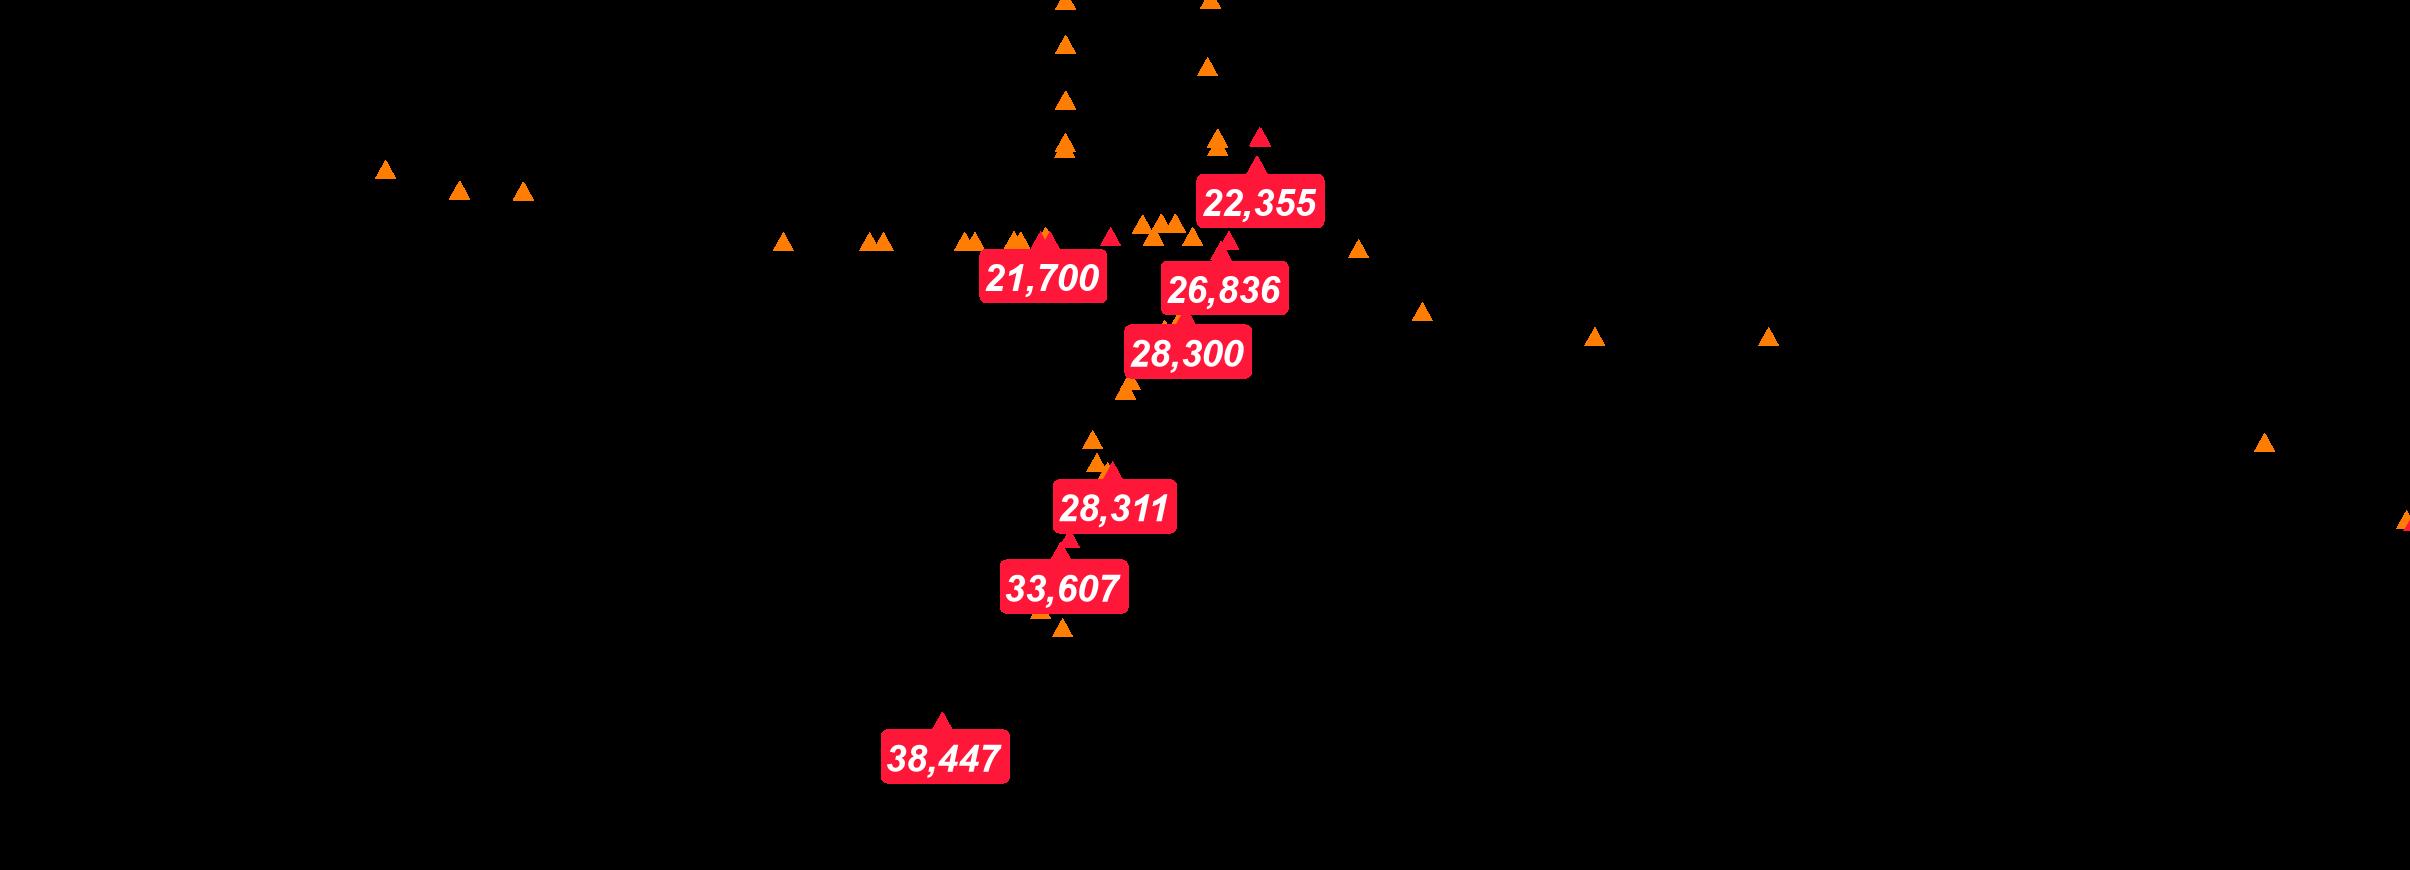
$1,000,000 - $1,499,999
Data Note: Income represents the preceding year, expressed in current dollars. Household income includes wage and salary earnings, interest dividends, net rents, pensions, SSI and welfare payments, child support, and alimony.
Source: Esri forecasts for 2025 and 2030. U.S. Census Bureau 2000 and 2010 decennial Census data converted by Esri into 2020 geography. September 29, 2025
Source: Esri forecasts for 2025 and 2030. U.S. Census Bureau 2000 and 2010 decennial Census data converted by Esri into 2020 geography. September
435 SW 6th St, Redmond, Oregon, 97756
Rings: 1, 3, 5 mile radii
Data Note: Persons of Hispanic Origin may be of any race. The Diversity Index measures the probability that two people from the same area will be from different race/ethnic groups.
Source: Esri forecasts for 2025 and 2030. U.S. Census Bureau 2000 and 2010 decennial Census data converted by Esri into 2020 geography. September 29, 2025
435 SW 6th St, Redmond, Oregon, 97756
Rings: 1, 3, 5 mile radii
2020 Population by Relationship and Household Type
Source: Esri forecasts for 2025 and 2030. U.S. Census Bureau 2000 and 2010 decennial
435 SW 6th St, Redmond, Oregon, 97756
Source: Esri forecasts for 2025 and 2030. U.S. Census Bureau 2000 and 2010 decennial
435 SW 6th St, Redmond, Oregon, 97756
Data Note: Households with children include any households with people under age 18, related or not. Multigenerational households are families with 3 or more parent-child relationships. Unmarried partner households are usually classified as nonfamily households unless there is another member of the household related to the householder. Multigenerational and unmarried partner households are reported only to the tract level. Esri estimated block group data, which is used to estimate polygons or non-standard geography.
Source: Esri forecasts for 2025 and 2030. U.S. Census Bureau 2000 and 2010 decennial Census data converted by Esri into 2020 geography. September 29, 2025
Data Note: Consumer spending shows the amount spent on a variety of goods and services by households that reside in the area. Expenditures are shown by broad budget categories that are not mutually exclusive. Consumer spending does not equal business revenue. Total and Average Amount Spent Per Household represent annual figures. The Spending Potential Index represents the amount spent in the area relative to a national average of 100.
Source: Consumer Spending data are derived from the 2022 and 2023 Consumer Expenditure Surveys, Bureau of Labor Statistics. Esri. Source: Esri forecasts for 2025 and 2030. U.S. Census Bureau 2000 and 2010 decennial Census data converted by Esri into 2020 geography. September 29, 2025
435 SW 6th St, Redmond, Oregon, 97756


Source: ©2025 Kalibrate Technologies (Q1 2025). September 29, 2025