


Subject Property: 1520 NW 6th Street|Redmond, Oregon | 97756 Tax Lot # 151309AA01100 Prepared By: Danetta Rider 845 SW Veterans Way Redmond, OR 97760 Office: 541-527-1274 Email: danettar@deschutestitle.com “Service is the Difference” Property Development Packet DISCLAIMER: Deschutes County Title has provided this information as a courtesy and assumes no liability for errors, omissions, or the accuracy of the data and does not warranty the fitness of this product for any particular purpose. Bend 397 SW Upper Terrace Dr Bend, Oregon 97702 Office: 541.389.2120 Fax: 541.389.2180 Redmond 845 SW Veterans Way Redmond, Oregon 97756 Office: 541.527.1274 Fax: 541.527.1281 La Pine 51515 Huntington Rd La Pine, Oregon 97739 Office: 541.876.6990 Fax: 541.876.2740 St Helens 240 South First Street St. Helens, Oregon 97051 Office: 503.397.2587 Fax: 503.366.1708 Prepared for Pete Rencher & Bruce Barrett pete@windermere.com (541) 923-4663 barrettrealestate@gmail.com (541)410-3484
DESCHUTESCOUNTYPROPERTYPROFILEINFORMATION

Parcel#:122332
TaxLot:151309AA01100
Owner:SantucciRentalsLLC
CoOwner:
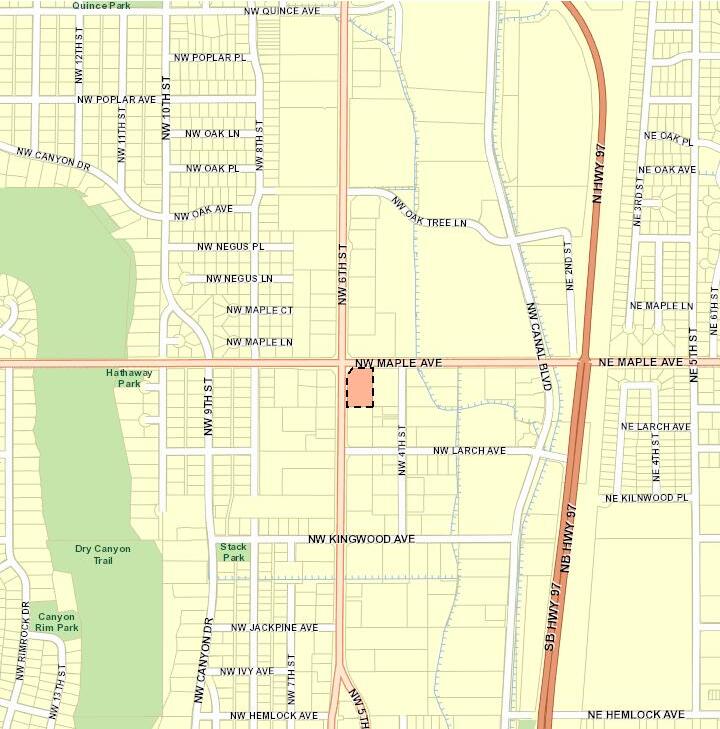
Site:1520NW6thSt
RedmondOR97756
Mail:960DryCreekRd
PrinevilleOR97754
LandUse:201-Commercial-Improved(typicalofclass)
StdLandUse:RMSC-ResidentialMiscellaneous
Legal:RENNOLDSACRESSUBDIVISIONLot:7&8Block:2
Twn/Rng/Sec:T:15SR:13ES:09Q:NEQQ:NE
ASSESSMENT&TAXINFORMATION
MarketTotal:$715,840.00
MarketLand:$433,340.00
MarketImpr:$282,500.00
AssessmentYear:2022
AssessedTotal:$448,180.00
Exemption:
Taxes:$8,586.29
LevyCode:2-039
LevyRate:19.1581
SALE&LOANINFORMATION
SaleDate:04/29/2021
SaleAmount:
Document#:26838
DeedType:Deed
LoanAmount:
Lender:
LoanType:
InterestType: TitleCo:
SentryDynamics,Inc
PROPERTYCHARACTERISTICS
YearBuilt:1954
EffYearBuilt:1992
Bedrooms:
Bathrooms:
#ofStories:
TotalSqFt:4,970SqFt
Floor1SqFt:
Floor2SqFt:
BasementSqFt:
Lotsize:1.25Acres(54,450SqFt)
GarageSqFt:
GarageType:
AC:
Pool:
HeatSource:
Fireplace:
BldgCondition:
Neighborhood:000
Lot:7&8
Block:2
Plat/Subdiv:RennoldsAcres
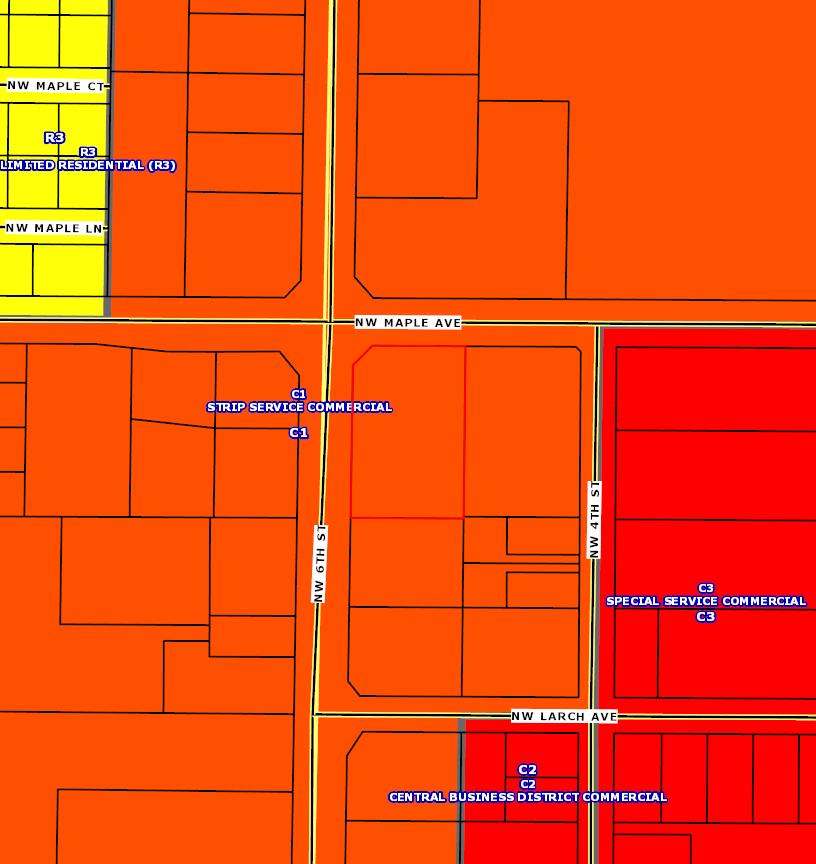
Zoning:C1-StripServiceCommercial
SchoolDist:2J-Redmond
Census:2005-000800
Recreation:
anditscustomersmakenorepresentations,warrantiesorconditions,expressorimplied,astotheaccuracyorcompletenessofinformationcontainedinthis report
Deschutes County Property Information

Disclaimer
The information and maps presented in this report are provided for your convenience. Every reasonable effort has been made to assure the accuracy of the data and associated maps. Deschutes County makes no warranty, representation or guarantee as to the content, sequence, accuracy, timeliness or completeness of any of the data provided herein. Deschutes County explicitly disclaims any representations and warranties, including, without limitation, the implied warranties of merchantability and fitness for a particular purpose. Deschutes County shall assume no liability for any errors, omissions, or inaccuracies in the information provided regardless of how caused. Deschutes County assumes no liability for any decisions made or actions taken or not taken by the user of this information or data furnished hereunder.
Account Summary
Report Date: 8/28/2023 9:43:19 AM SANTUCCI
Property Class: 201 -- COMMERCIAL
Warnings, Notations, and Special Assessments
Review of digital records maintained by the Deschutes County Assessor’s Office, Tax Office, Finance Office, and the Community Development Department indicates that there are no special tax, assessment or property development related notations associated with this account. However, independent verification of the presence of other Deschutes County tax, assessment, development, and additional property related considerations is recommended. Confirmation is commonly provided by title companies, real estate agents, developers, engineering and surveying firms, and other parties who are involved in property transactions or property development. In addition, County departments may be contacted directly to discuss the information.
RENTALS
LLC
Account Information Ownership Mailing Address: Map and Taxlot: Account: Situs Address: Mailing Name: Tax Status: 151309AA01100 122332 1520 NW 6TH ST, REDMOND, OR 97756 SANTUCCI RENTALS LLC Assessable RENNOLDS ACRES SUBDIVISION 2 Assessor Acres: Property Taxes Assessment Tax Code Area: Current Tax Year: 2039 $8,586.29 1.25 Valuation $433,340 $282,500 Land Structures Total $715,840 Real Market Values as of Jan. 1, 2022 $448,180 $448,180 Maximum Assessed Assessed Value Veterans Exemption Current Assessed Values:
960 DRY CREEK RD PRINEVILLE, OR 97754
Subdivision: Block:
Lot:
7.&.8
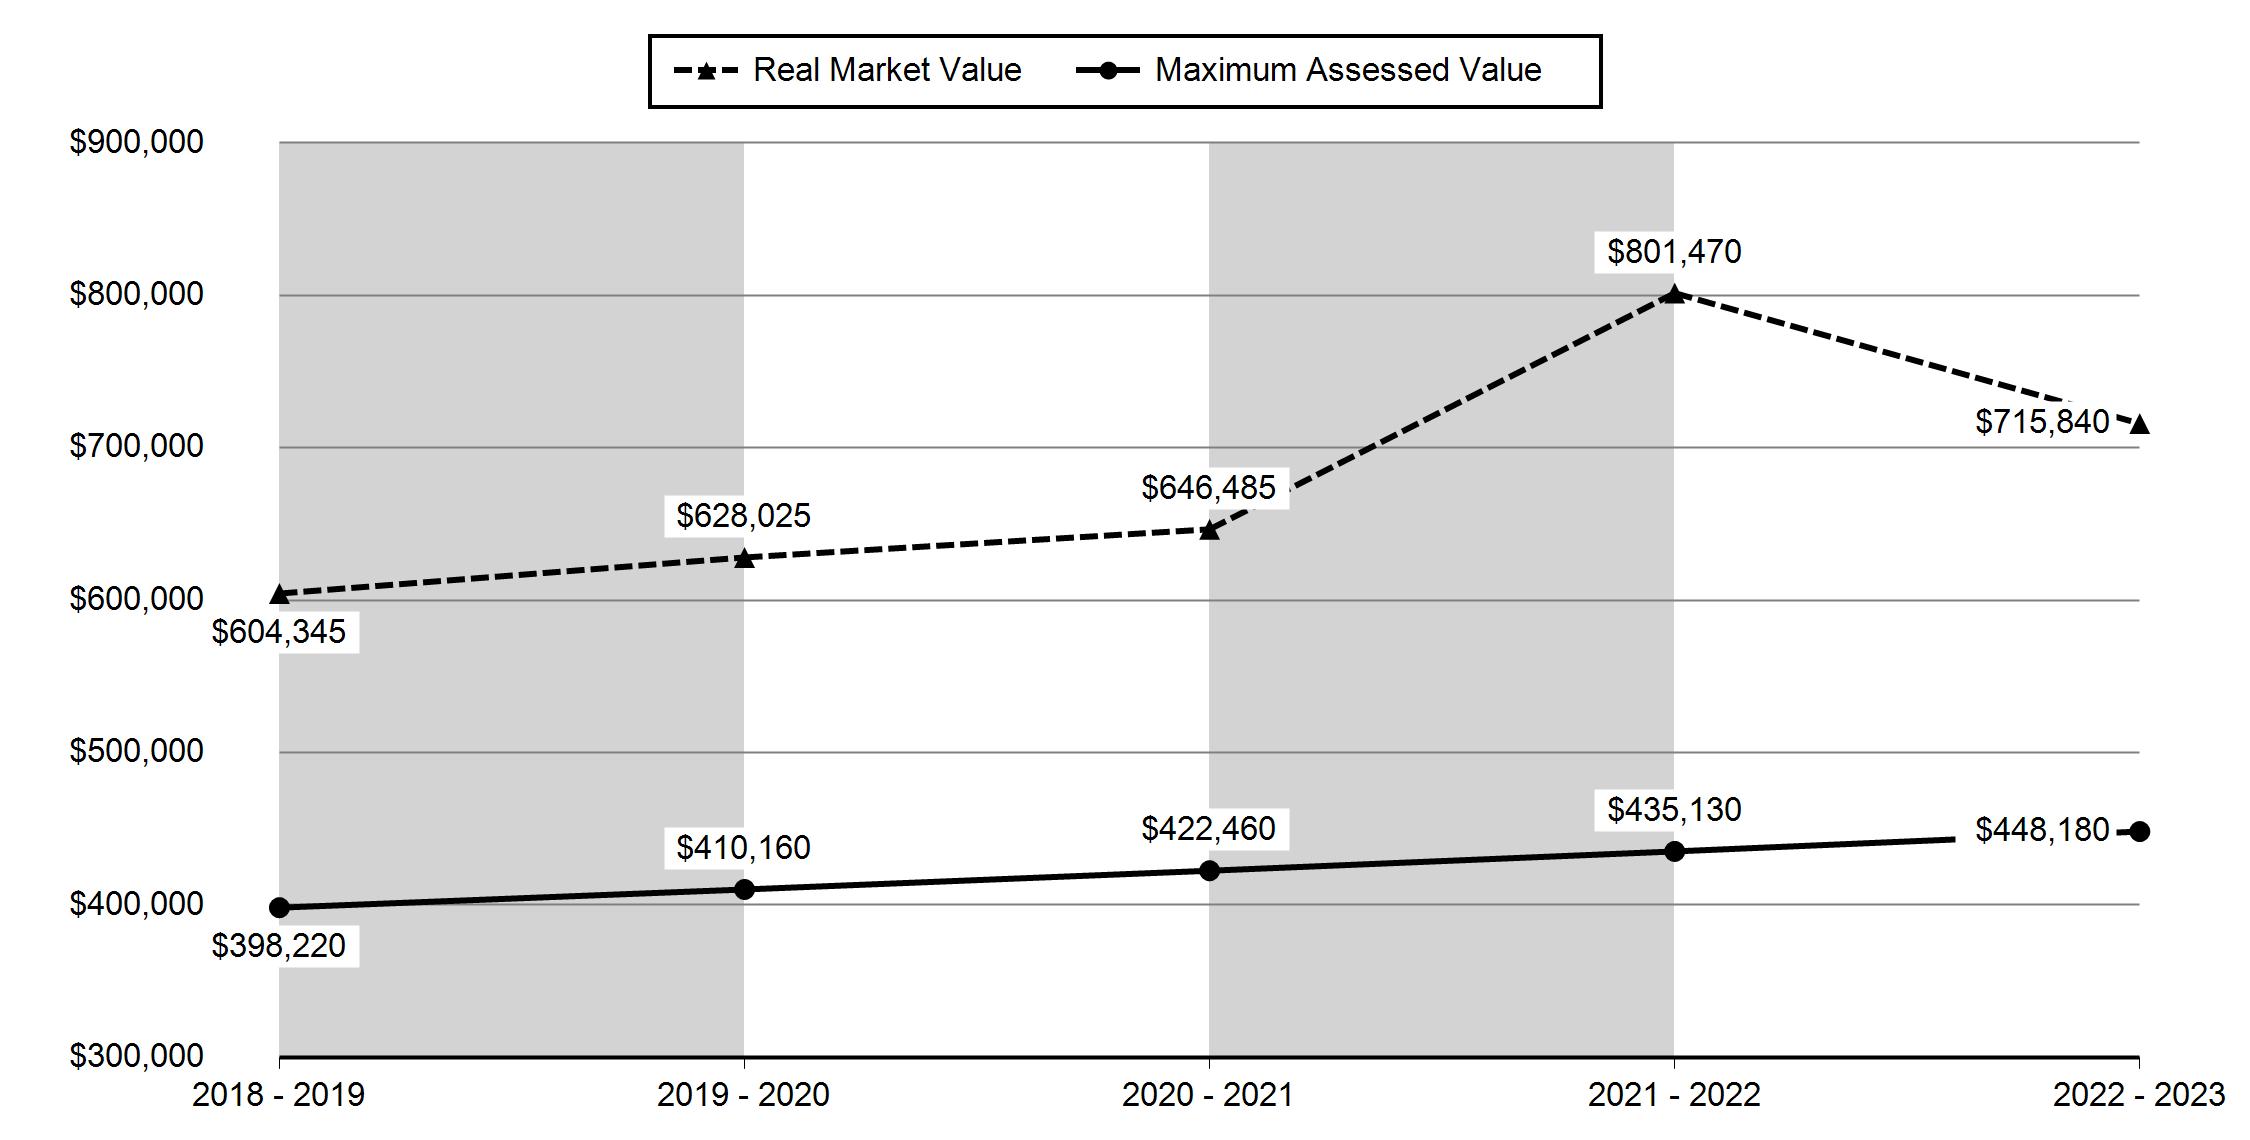
2018 - 2019 2019 - 2020 2020 - 2021 2021 - 2022 2022 - 2023 Real Market Value - Land $426,745 $443,665 $456,855 $570,190 $433,340 Real Market Value - Structures $177,600 $184,360 $189,630 $231,280 $282,500 Total Real Market Value $604,345 $628,025 $646,485 $801,470 $715,840 Maximum Assessed Value $398,220 $410,160 $422,460 $435,130 $448,180 Total Assessed Value $398,220 $410,160 $422,460 $435,130 $448,180 Veterans Exemption $0 $0 $0 $0 $0 Valuation History All values are as of January 1 of each year. Tax year is July 1st through June 30th of each year. Deschutes County Property Information Report, page 1
Tax Payment History
Year Date Due Transaction Type Transaction Date As Of Date Amount Received Tax Due Discount Amount Interest Charged Refund Interest 2022 11-15-2022 PAYMENT 11-10-2022 11-10-2022 $8,328.70 ($8,586.29) $257.59 $0.00 $0.00 2022 11-15-2022 IMPOSED 10-12-2022 11-15-2022 $0.00 $8,586.29 $0.00 $0.00 $0.00 Total: $0.00 2021 11-15-2021 PAYMENT 11-09-2021 11-09-2021 $7,811.70 ($8,053.30) $241.60 $0.00 $0.00 2021 11-15-2021 IMPOSED 10-11-2021 11-15-2021 $0.00 $8,053.30 $0.00 $0.00 $0.00 Total: $0.00 2020 11-15-2020 PAYMENT 10-29-2020 10-29-2020 $7,458.54 ($7,689.22) $230.68 $0.00 $0.00 2020 11-15-2020 IMPOSED 10-09-2020 11-15-2020 $0.00 $7,689.22 $0.00 $0.00 $0.00 Total: $0.00
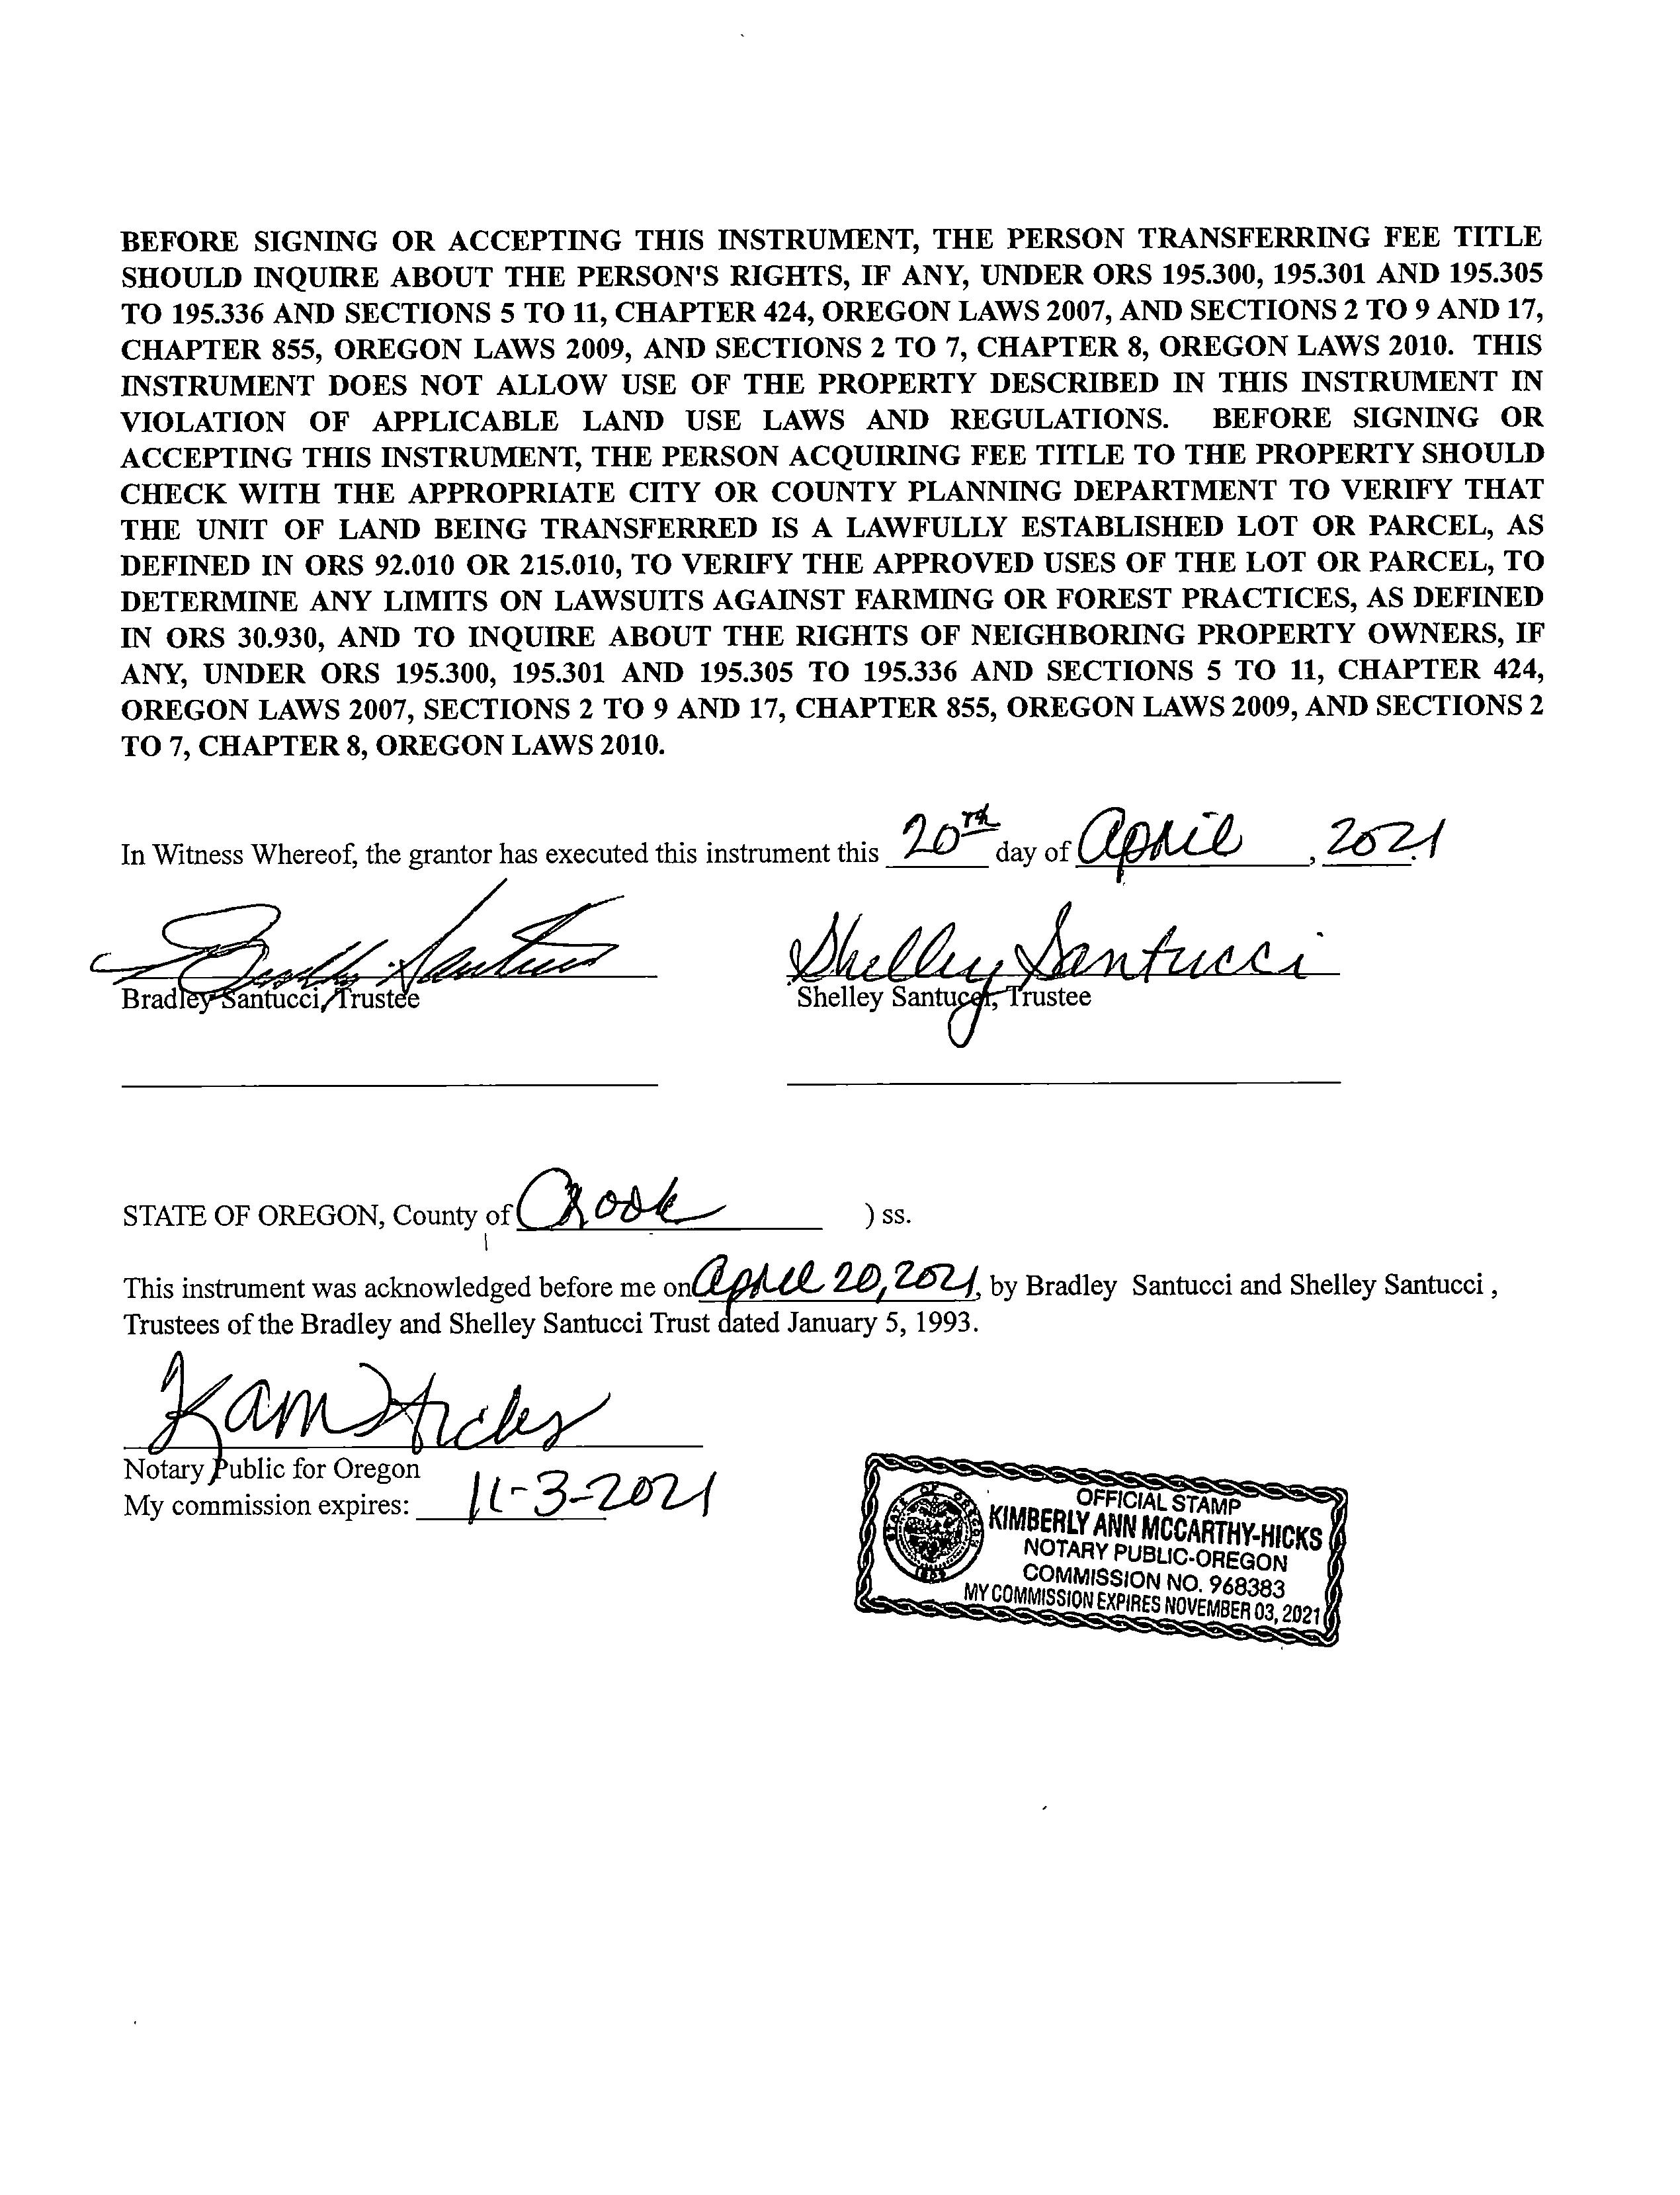
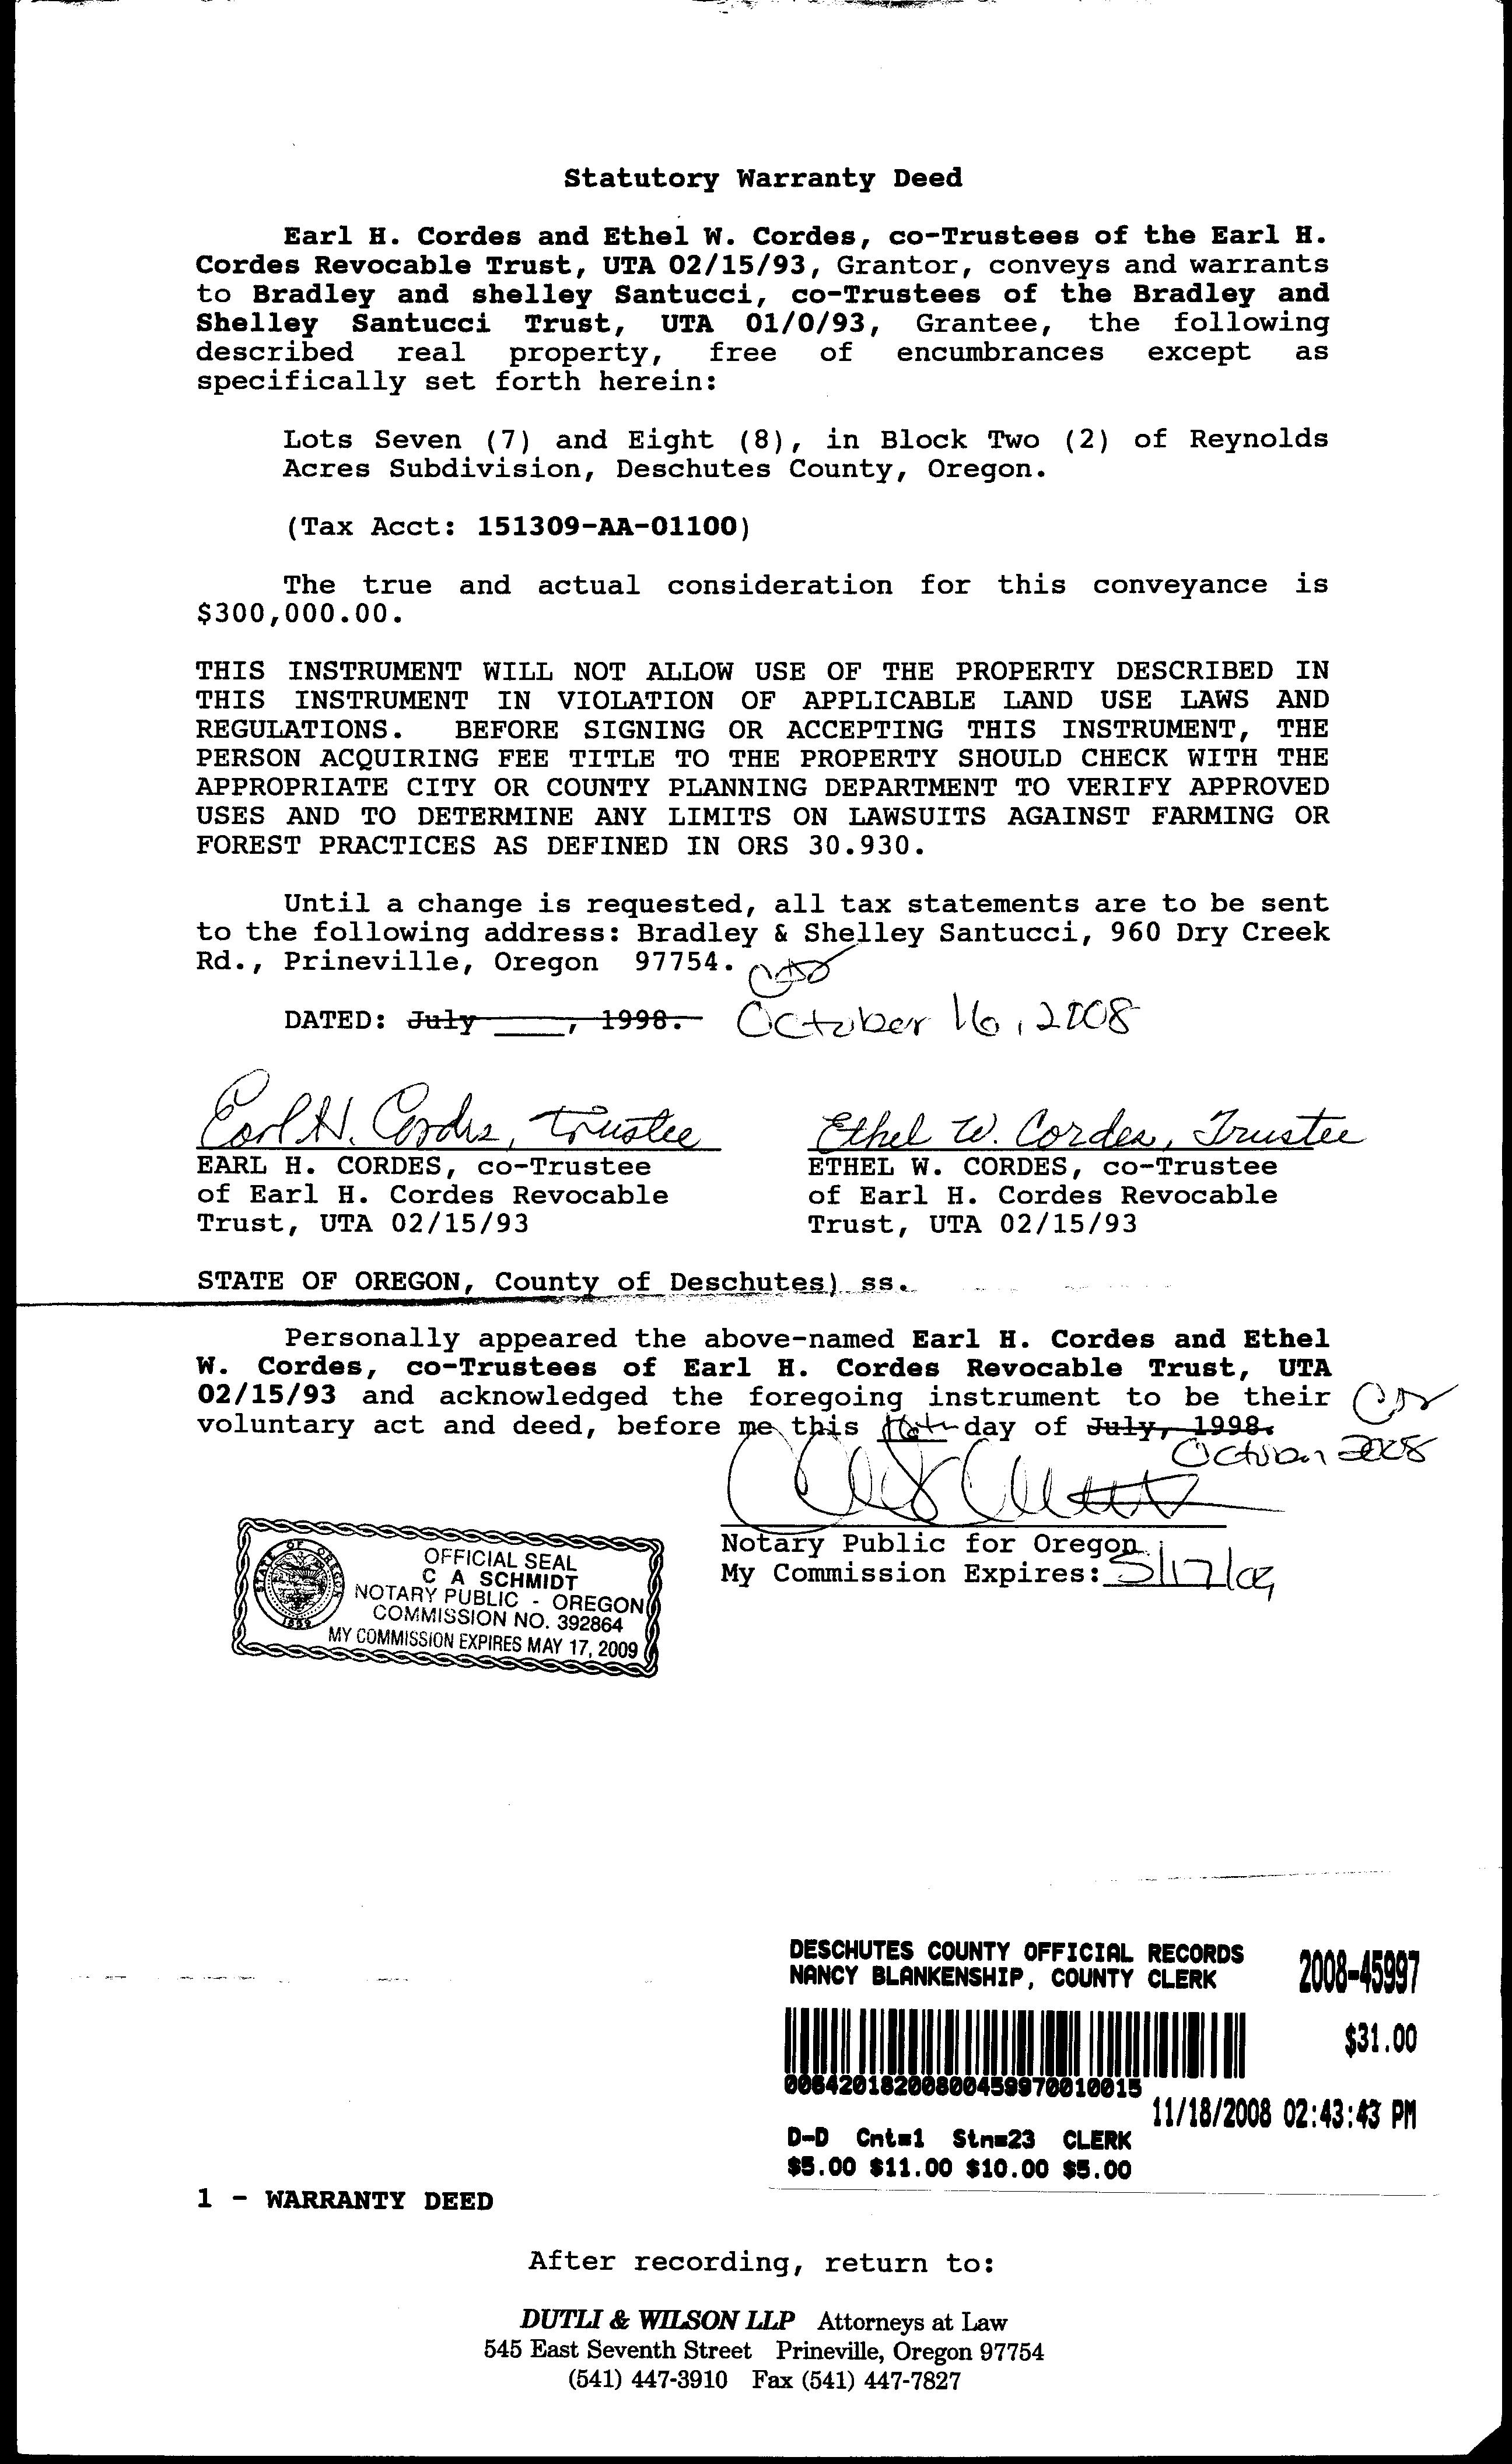
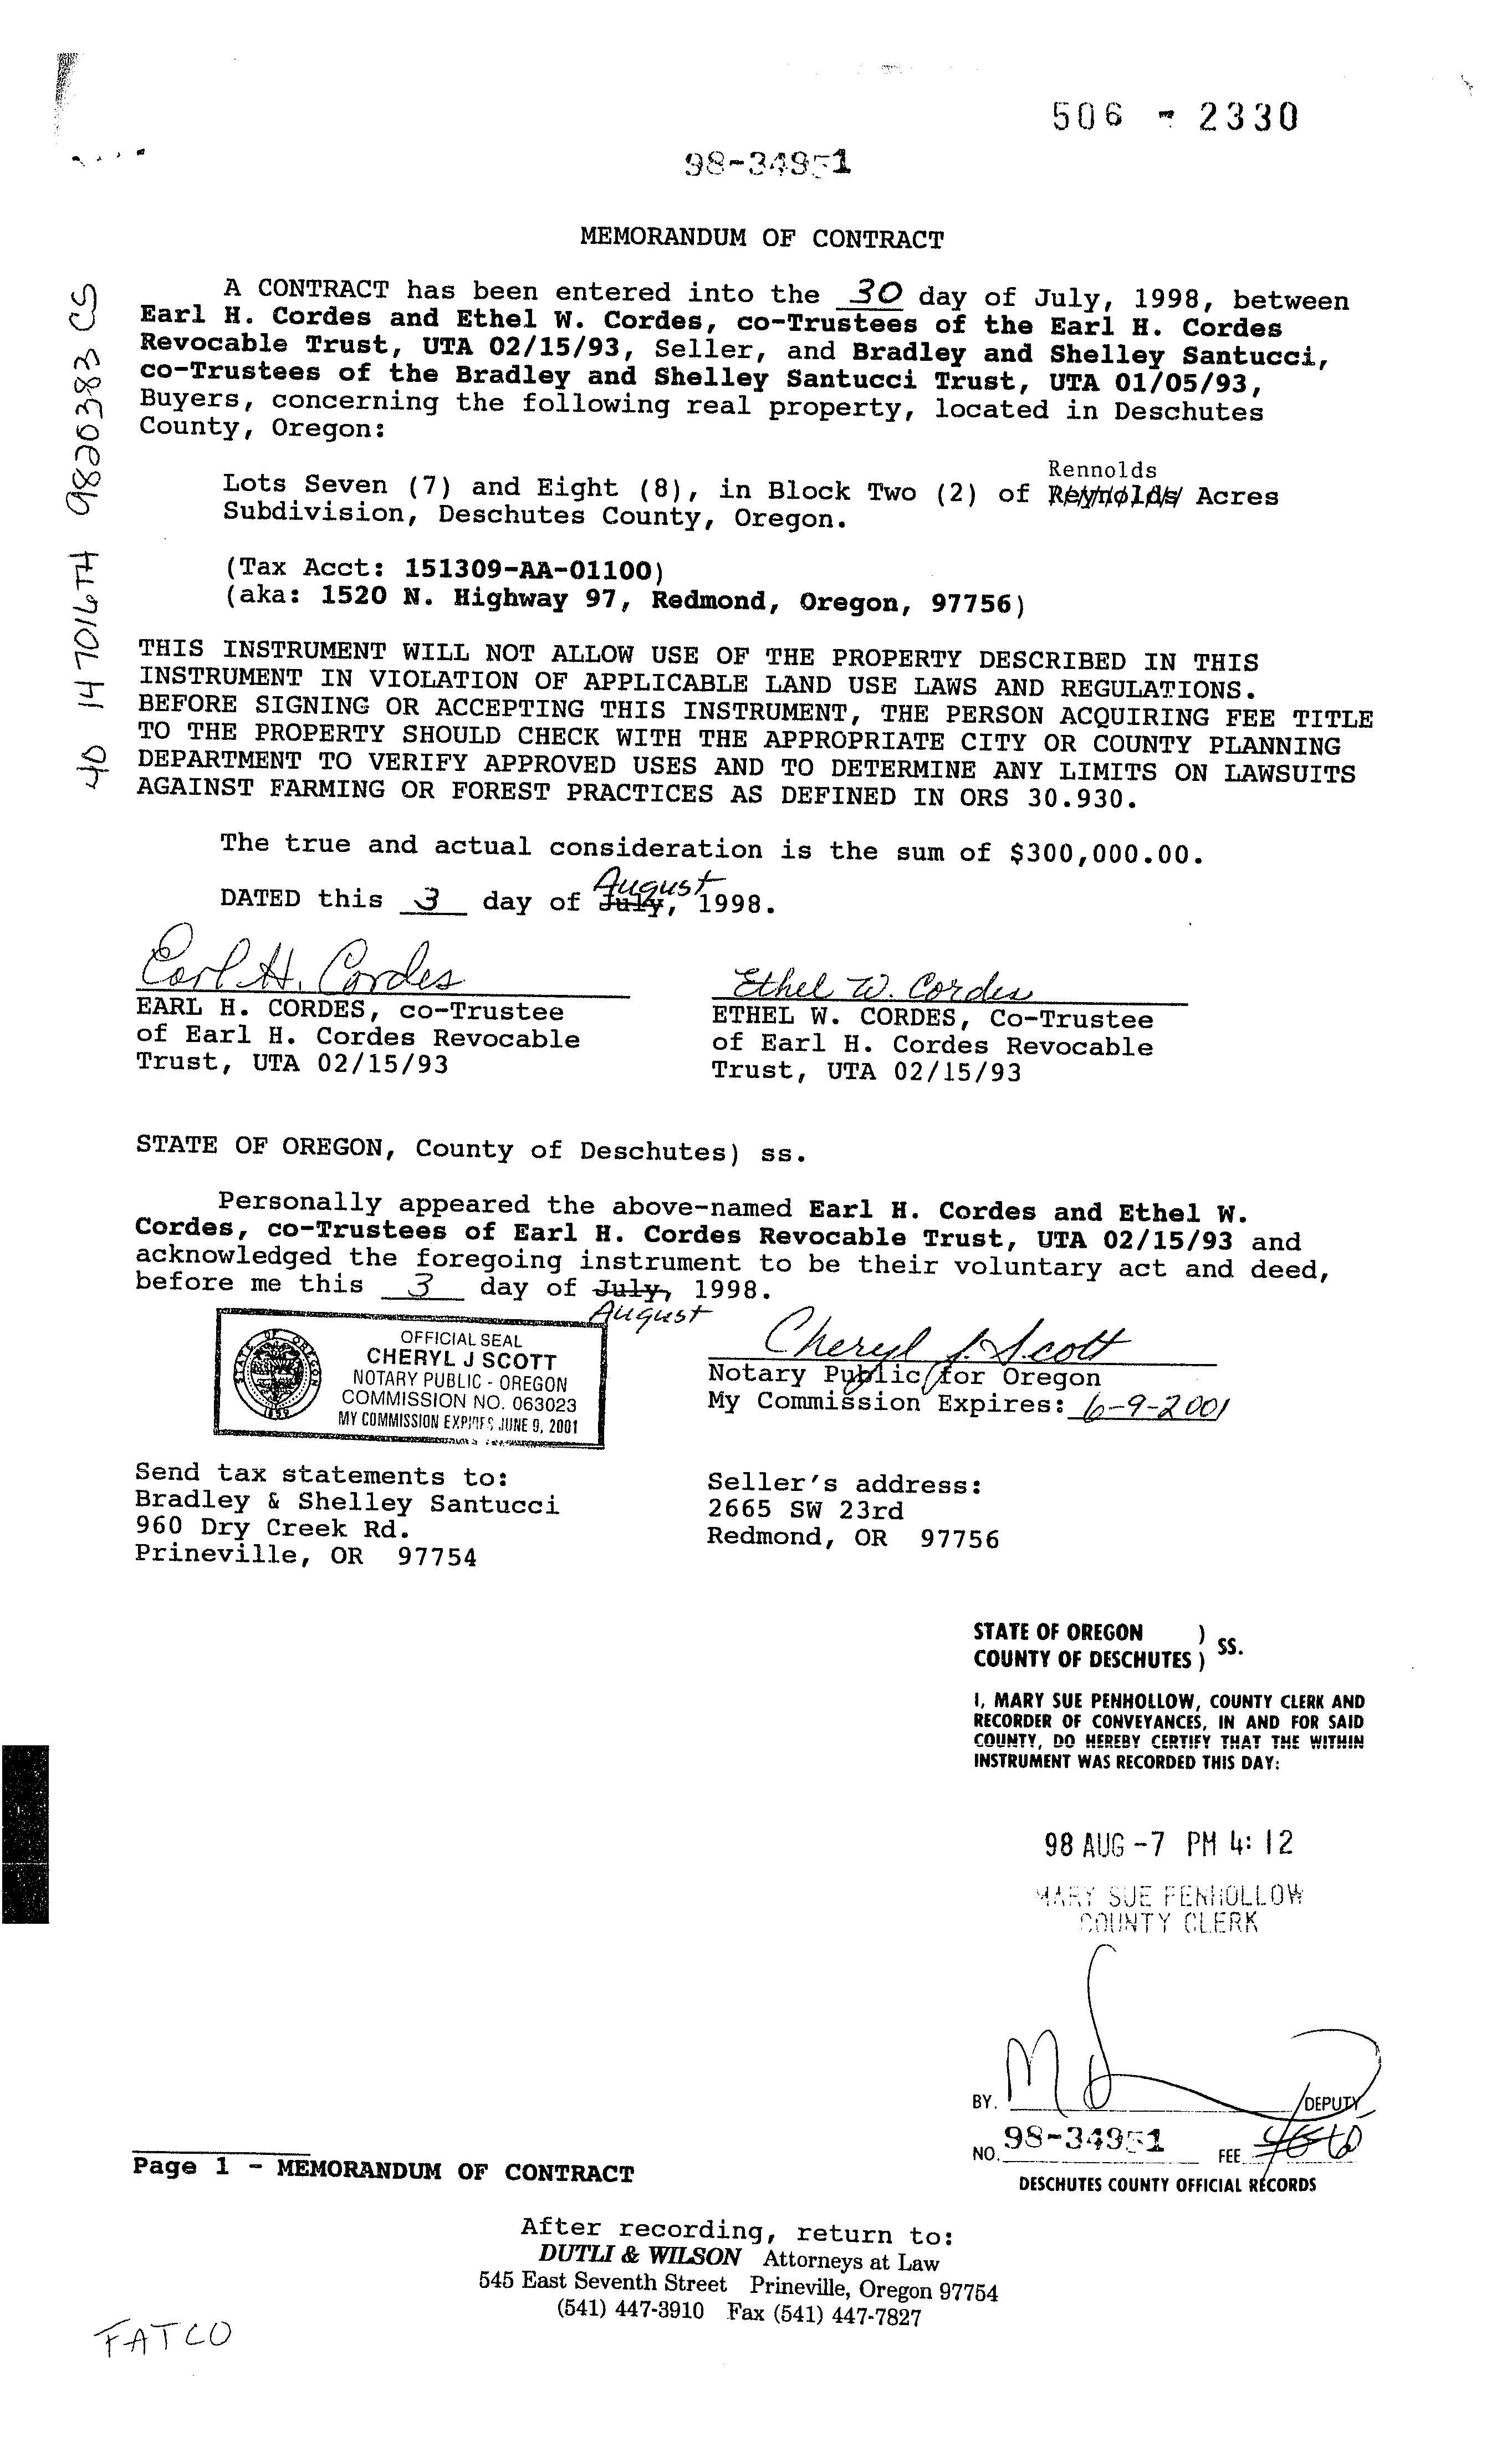
Sale Date Seller Buyer Sale Amount Sale Type Recording Instrument 04/20/2021 BRADLEY & SHELLEY SANTUCCI TRUST SANTUCCI RENTALS LLC 06-GRANTEE IS RELATED/FRIENDS/BUSINES S ASSOCIATES 2021-26838 10/16/2008 SANTUCCI, BRADLEY CO TTEE ET AL $300,000 07-INTEREST TRANSFERRED IS PARTIAL/UNDIVIDED/TIMESH ARE 2008-45997 08/03/1998 CORDES,EARL H COTRUSTEE EARL H CORDES RE SANTUCCI,BRADLEY COTRUSTEE BRADLEY & SH $300,000 30-UNCONFIRMED SALE 1998-5062330 02/15/1993 CORDES EARL H CORDES,EARL H COTRUSTEE EARL H CORDES RE $0 08-GRANTOR/GRANTEE ARE THE SAME 1993-2910380
Structures Stat Class/Description Improvement Description Code Area Year Built Total Sq Ft 501 - COMM ACCT: Yard Improvements 2039 0 Stat Class/Description Improvement Description Code Area Year Built Total Sq Ft 571 - COMM ACCT: Warehouse - warehouse 2039 1988 2,160 Deschutes County Property Information Report, page 2 (For Report Disclaimer see page 1)
Sales History
Related accounts apply to a property that may be on one map and tax lot but due to billing have more than one account. This occurs when a property is in multiple tax code areas. In other cases there may be business personal property or a manufactured home on this property that is not in the same ownership as the land.
No Related Accounts found.
Development Summary
Stat Class/Description Improvement Description Code Area Year Built Total Sq Ft 572 - COMM ACCT: Warehouse - Service Garage 2039 1954 4,970 Land Characteristics Land Description Acres Land Classification Commercial Lot 1.25 Ownership Name Type Name Ownership Type Ownership Percentage OWNER SANTUCCI RENTALS LLC, OWNER 100.00%
Accounts Category Name Phone Address COUNTY SERVICES DESCHUTES COUNTY (541) 388-6570 1300 NW WALL ST, BEND, OR 97703 FIRE DISTRICT REDMOND FIRE AND RESCUE (541) 504-5000 341 NW DOGWOOD AVE, REDMOND, OR 97756 SCHOOL DISTRICT REDMOND SCHOOL DISTRICT (541) 923-5437 145 SE SALMON AVE, REDMOND, OR 97756 ELEMENTARY SCHOOL ATTENDANCE AREA JOHN TUCK ELEMENTARY SCHOOL (541) 923-4884 209 N 10TH ST, REDMOND, OR 97756 MIDDLE SCHOOL ATTENDANCE AREA ELTON GREGORY MIDDLE SCHOOL (541) 526-6440 1220 NW UPAS AVE, REDMOND, OR 97756 HIGH SCHOOL ATTENDANCE AREA REDMOND HIGH SCHOOL (541) 923-4800 675 SW RIMROCK, REDMOND, OR 97756 EDUCATION SERVICE TAX DISTRICT HIGH DESERT EDUCATION SERVICE DISTRICT (541) 693-5600 145 SE SALMON AVE, REDMOND, OR 97756 COLLEGE TAX DISTRICT CENTRAL OREGON COMMUNITY COLLEGE (541) 383-7700 2600 NW COLLEGE WAY, BEND, OR 97703 PARK & RECREATION DISTRICT REDMOND AREA PARK & RECREATION DISTRICT (541) 548-7275 465 SW RIMROCK DR, REDMOND, OR 97756 LIBRARY DISTRICT DESCHUTES PUBLIC LIBRARY (541) 617-7050 601 NW WALL ST, BEND, OR 97703 WATER SERVICE PROVIDER REDMOND WATER DEPARTMENT (541) 504-2000 423 E ANTLER AVE #100, REDMOND, OR 97756 IRRIGATION DISTRICT CENTRAL OREGON IRRIGATION DISTRICT (541) 548-6047 1055 SW LAKE CT, REDMOND, OR 97756 GARBAGE & RECYCLING SERVICE HIGH COUNTRY DISPOSAL (541) 548-4984 1090 NE HEMLOCK AVE, REDMOND, OR 97756 Service Providers
districts to
Jurisdiction City Zoning Description Redmond C1 STRIP SERVICE COMMERICALREDMOND UGB
Related
Please contact
confirm.
Planning Jursidiction: Urban Reserve Area: Urban Growth Boundary: Redmond No Redmond No permit records found. Permit Detail 000 04 2 201 -- COMMERCIAL Neighborhood: Study Area: Maintenance Area: Property Class: Subdivision: RENNOLDS ACRES SUBDIVISION Lot: 7.&.8 Block: 2 Legal Description: Assessor's Office Supplemental Information Deschutes County Property Information Report, page 3 (For Report Disclaimer see page 1)
STATEMENT OF TAX ACCOUNT
2022 ADVALOREM $0.00 $0.00 $0.00 $0.00 $8,586.29 Nov 15, 2022 2021 ADVALOREM $0.00 $0.00 $0.00 $0.00 $8,053.30 Nov 15, 2021 2020 ADVALOREM $0.00 $0.00 $0.00 $0.00 $7,689.22 Nov 15, 2020 2019 ADVALOREM $0.00 $0.00 $0.00 $0.00 $7,353.28 Nov 15, 2019 2018 ADVALOREM $0.00 $0.00 $0.00 $0.00 $7,170.22 Nov 15, 2018 2017 ADVALOREM $0.00 $0.00 $0.00 $0.00 $6,999.82 Nov 15, 2017 2016 ADVALOREM $0.00 $0.00 $0.00 $0.00 $6,903.10 Nov 15, 2016 2015 ADVALOREM $0.00 $0.00 $0.00 $0.00 $6,692.14 Nov 15, 2015 2014 ADVALOREM $0.00 $0.00 $0.00 $0.00 $6,490.28 Nov 15, 2014 2013 ADVALOREM $0.00 $0.00 $0.00 $0.00 $6,333.45 Nov 15, 2013 2012 ADVALOREM $0.00 $0.00 $0.00 $0.00 $6,289.22 Nov 15, 2012 2011 ADVALOREM $0.00 $0.00 $0.00 $0.00 $5,993.02 Nov 15, 2011 2010 ADVALOREM $0.00 $0.00 $0.00 $0.00 $5,773.84 Nov 15, 2010 2009 ADVALOREM $0.00 $0.00 $0.00 $0.00 $5,684.55 Nov 15, 2009 2008 ADVALOREM $0.00 $0.00 $0.00 $0.00 $5,072.39 Nov 15, 2008 2007 ADVALOREM $0.00 $0.00 $0.00 $0.00 $4,892.13 Nov 15, 2007 2006 ADVALOREM $0.00 $0.00 $0.00 $0.00 $4,839.45 Nov 15, 2006 2005 ADVALOREM $0.00 $0.00 $0.00 $0.00 $4,839.06 Nov 15, 2005 2004 ADVALOREM $0.00 $0.00 $0.00 $0.00 $4,727.04 Nov 15, 2004 2003 ADVALOREM $0.00 $0.00 $0.00 $0.00 $4,690.12 Nov 15, 2003 2002 ADVALOREM $0.00 $0.00 $0.00 $0.00 $4,682.35 Nov 15, 2002 2001 ADVALOREM $0.00 $0.00 $0.00 $0.00 $4,511.00 Nov 15, 2001 2000 ADVALOREM $0.00 $0.00 $0.00 $0.00 $4,412.71 Nov 15, 2000 1999 ADVALOREM $0.00 $0.00 $0.00 $0.00 $4,337.93 Nov 15, 1999 1998 ADVALOREM $0.00 $0.00 $0.00 $0.00 $4,214.00 Nov 15, 1998 1997 ADVALOREM $0.00 $0.00 $0.00 $0.00 $4,102.46 Dec 15, 1997 1996 ADVALOREM $0.00 $0.00 $0.00 $0.00 $4,400.18 Nov 15, 1996 1995 ADVALOREM $0.00 $0.00 $0.00 $0.00 $3,945.34 Nov 15, 1995 1994 ADVALOREM $0.00 $0.00 $0.00 $0.00 $4,455.47 Nov 15, 1994 1993 ADVALOREM $0.00 $0.00 $0.00 $0.00 $4,796.63 Nov 15, 1993
DESCHUTES COUNTY TAX COLLECTOR DESCHUTES SERVICES BUILDING BEND OR 97703 (541) 388-6540 SANTUCCI RENTALS LLC 960 DRY CREEK RD PRINEVILLE OR 97754 28-Aug-2023 122332 Tax Account # Account Status Roll Type Situs Address A Real 1520 NW 6TH ST REDMOND OR 97756 Tax Summary Tax Year Tax Type Total Due Current Due Interest Due Discount Available Original Due Due Date 2039 Aug 28, 2023 Lender Name Loan Number Property ID Interest To $0.00 $0.00 $0.00 $0.00 Total Deschutes County Property Information Report, page 4 (For Report Disclaimer see page 1)
REAL PROPERTY TAX STATEMENT
JULY 1, 2022 TO JUNE 30, 2023
DESCHUTES COUNTY, OREGON - 1300 NW WALL ST STE 203, BEND, OR 97703
TAX BY DISTRICT
TAX ACCOUNT: 122332
PROPERTY DESCRIPTION
CODE: 2039
SITUS ADDRESS: MAP: 201 CLASS: 151309-AA-01100
LEGAL:
VALUES:
1520 NW 6TH ST REDMOND
RENNOLDS ACRES SUBDIVISIO 2 7.&.8
(RMV)
Full Payment with 3% Discount
Discount is lost after due date and interest may apply PAYMENT OPTIONS:
* Online
* By Mail to Deschutes County Tax, PO Box 7559 Bend OR 97708-7559
* Drop Box located at 1300 NW Wall Street, Bend or 411 SW 9th Street, Redmond
* In Person 1300 NW Wall Street, Ste 203, Bend (2nd Floor) For Property Information: dial.deschutes.org
Please include this coupon with payment. Please do not staple, paper clip or tape your payment.
Please select payment option
Full Payment (3% Discount)
Two-Thirds Payment (2% Discount)
Next Payment Due
One-Third Payment (No Discount)
Next Payment Due
Payment Due November 15, 2022
TAX ACCOUNT: 122332
(Mailing address change form on reverse)
$
Please make checks payable to Deschutes County Tax Collector
NET TAXABLE: TOTAL PROPERTY TAX: LAST YEAR THIS YEAR 570,190 231,280 801,470 433,340 282,500 715,840 435,130 0 435,130 8,053.30 448,180 0 448,180 8,586.29 TAX QUESTIONS ASSESSMENT QUESTIONS (541) 388-6540 (541) 388-6508 $8,328.70
05/15/23 02/15/23 $2,862.10 $5,609.71 $8,328.70
PRINEVILLE
Deschutes
Box
09100001223320000286210000056097100008328703 448,180 435,130 MAXIMUM ASSESSED VALUE
LLC
DRY CREEK
PRINEVILLE
REAL MARKET
LAND STRUCTURES TOTAL RMV TOTAL ASSESSED VALUE VETERAN'S EXEMPTION
No Additional Payment Due
Change my Mailing Address SANTUCCI RENTALS LLC 960 DRY CREEK RD
OR 97754
County Tax Collector PO
7559 Bend OR 97708-7559
AMOUNT ENCLOSED
SANTUCCI RENTALS
960
RD
OR 97754
SCHOOL DISTRICT #2J 2,088.25 C O C C 257.84 HIGH DESERT ESD 40.11 EDUCATION TOTAL: 2,386.20 DESCHUTES COUNTY 506.31 COUNTY LIBRARY 228.62 COUNTYWIDE LAW ENFORCEMENT 436.39 COUNTY EXTENSION/4H 9.37 9-1-1 150.36 CITY OF REDMOND 1,832.65 REDMOND DWNTWN URBAN RENEWAL 429.76 REDMOND SOUTH 97 URBAN RENEWAL 74.85 REDMOND FIRE & RESCUE 729.01 REDMOND FIRE & RESCUE LOCAL OPTION 121.01 REDMOND AREA PARK & REC DISTRICT 154.49 GENERAL GOVT TOTAL: 4,672.82 COUNTY LIBRARY BOND 151.22 CITY OF REDMOND BOND 2022 324.12 SCHOOL #2J BOND 2004 336.22 SCHOOL #2J BOND 2008 576.81 SCHOOL #2J BOND 2021 104.52 C O C C BOND 34.38 BONDS - OTHER TOTAL: 1,527.27 Deschutes County Property Information Report, page 5 (For Report Disclaimer see page 1)
www.deschutes.org/tax
Deschutes County Property Information Report, page 6 (For Report Disclaimer see page 1)

De sc h u te s C o u n ty GIS De sc hu t es Cou nt y P rop er t y I nf orm at i on - Di al
Map and Ta x l ot: 151 30 9A A 01100 Deschutes County Property Information Report, page 7 (For Report Disclaimer see page 1)
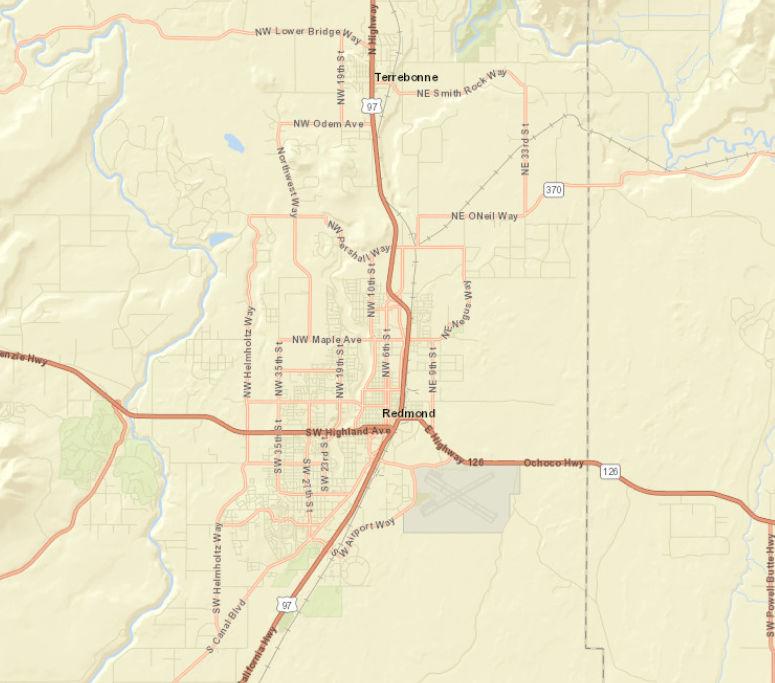
Roa d Map

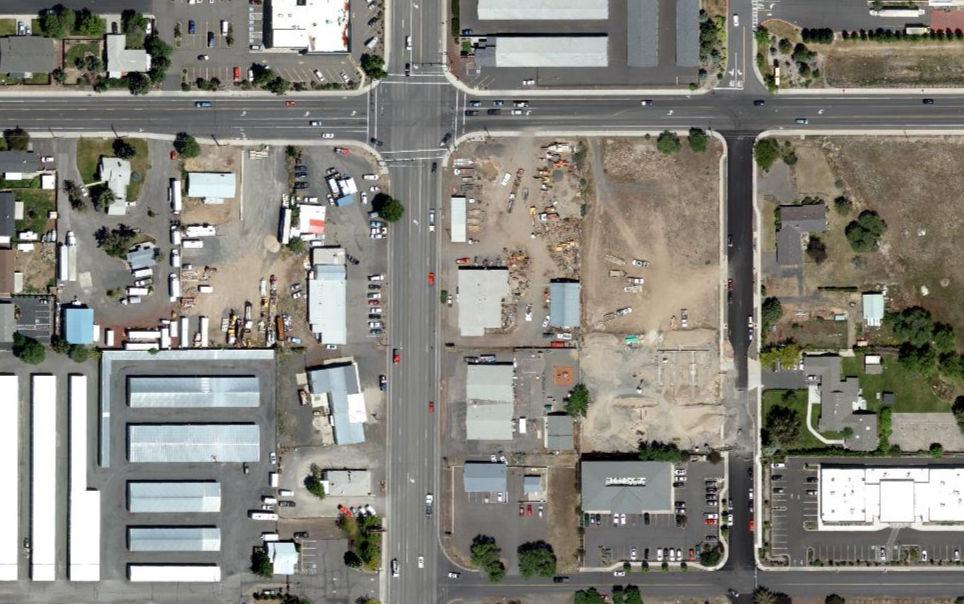
AerialMap
ParcelID:122332
TaxAccount#:151309AA01100
1520NW6thSt, RedmondOR97756
Thismap/plat isbeingfurnishedasanaidinlocatingtheherein describedlandinrelationtoadjoiningstreets,natural boundariesandotherland,andisnot asurveyoftheland depicted Except totheextent apolicyoftitleinsuranceis expresslymodifiedbyendorsement,ifany,thecompanydoes not insuredimensions,distances,locationofeasements, acreageorothermattersshownthereon
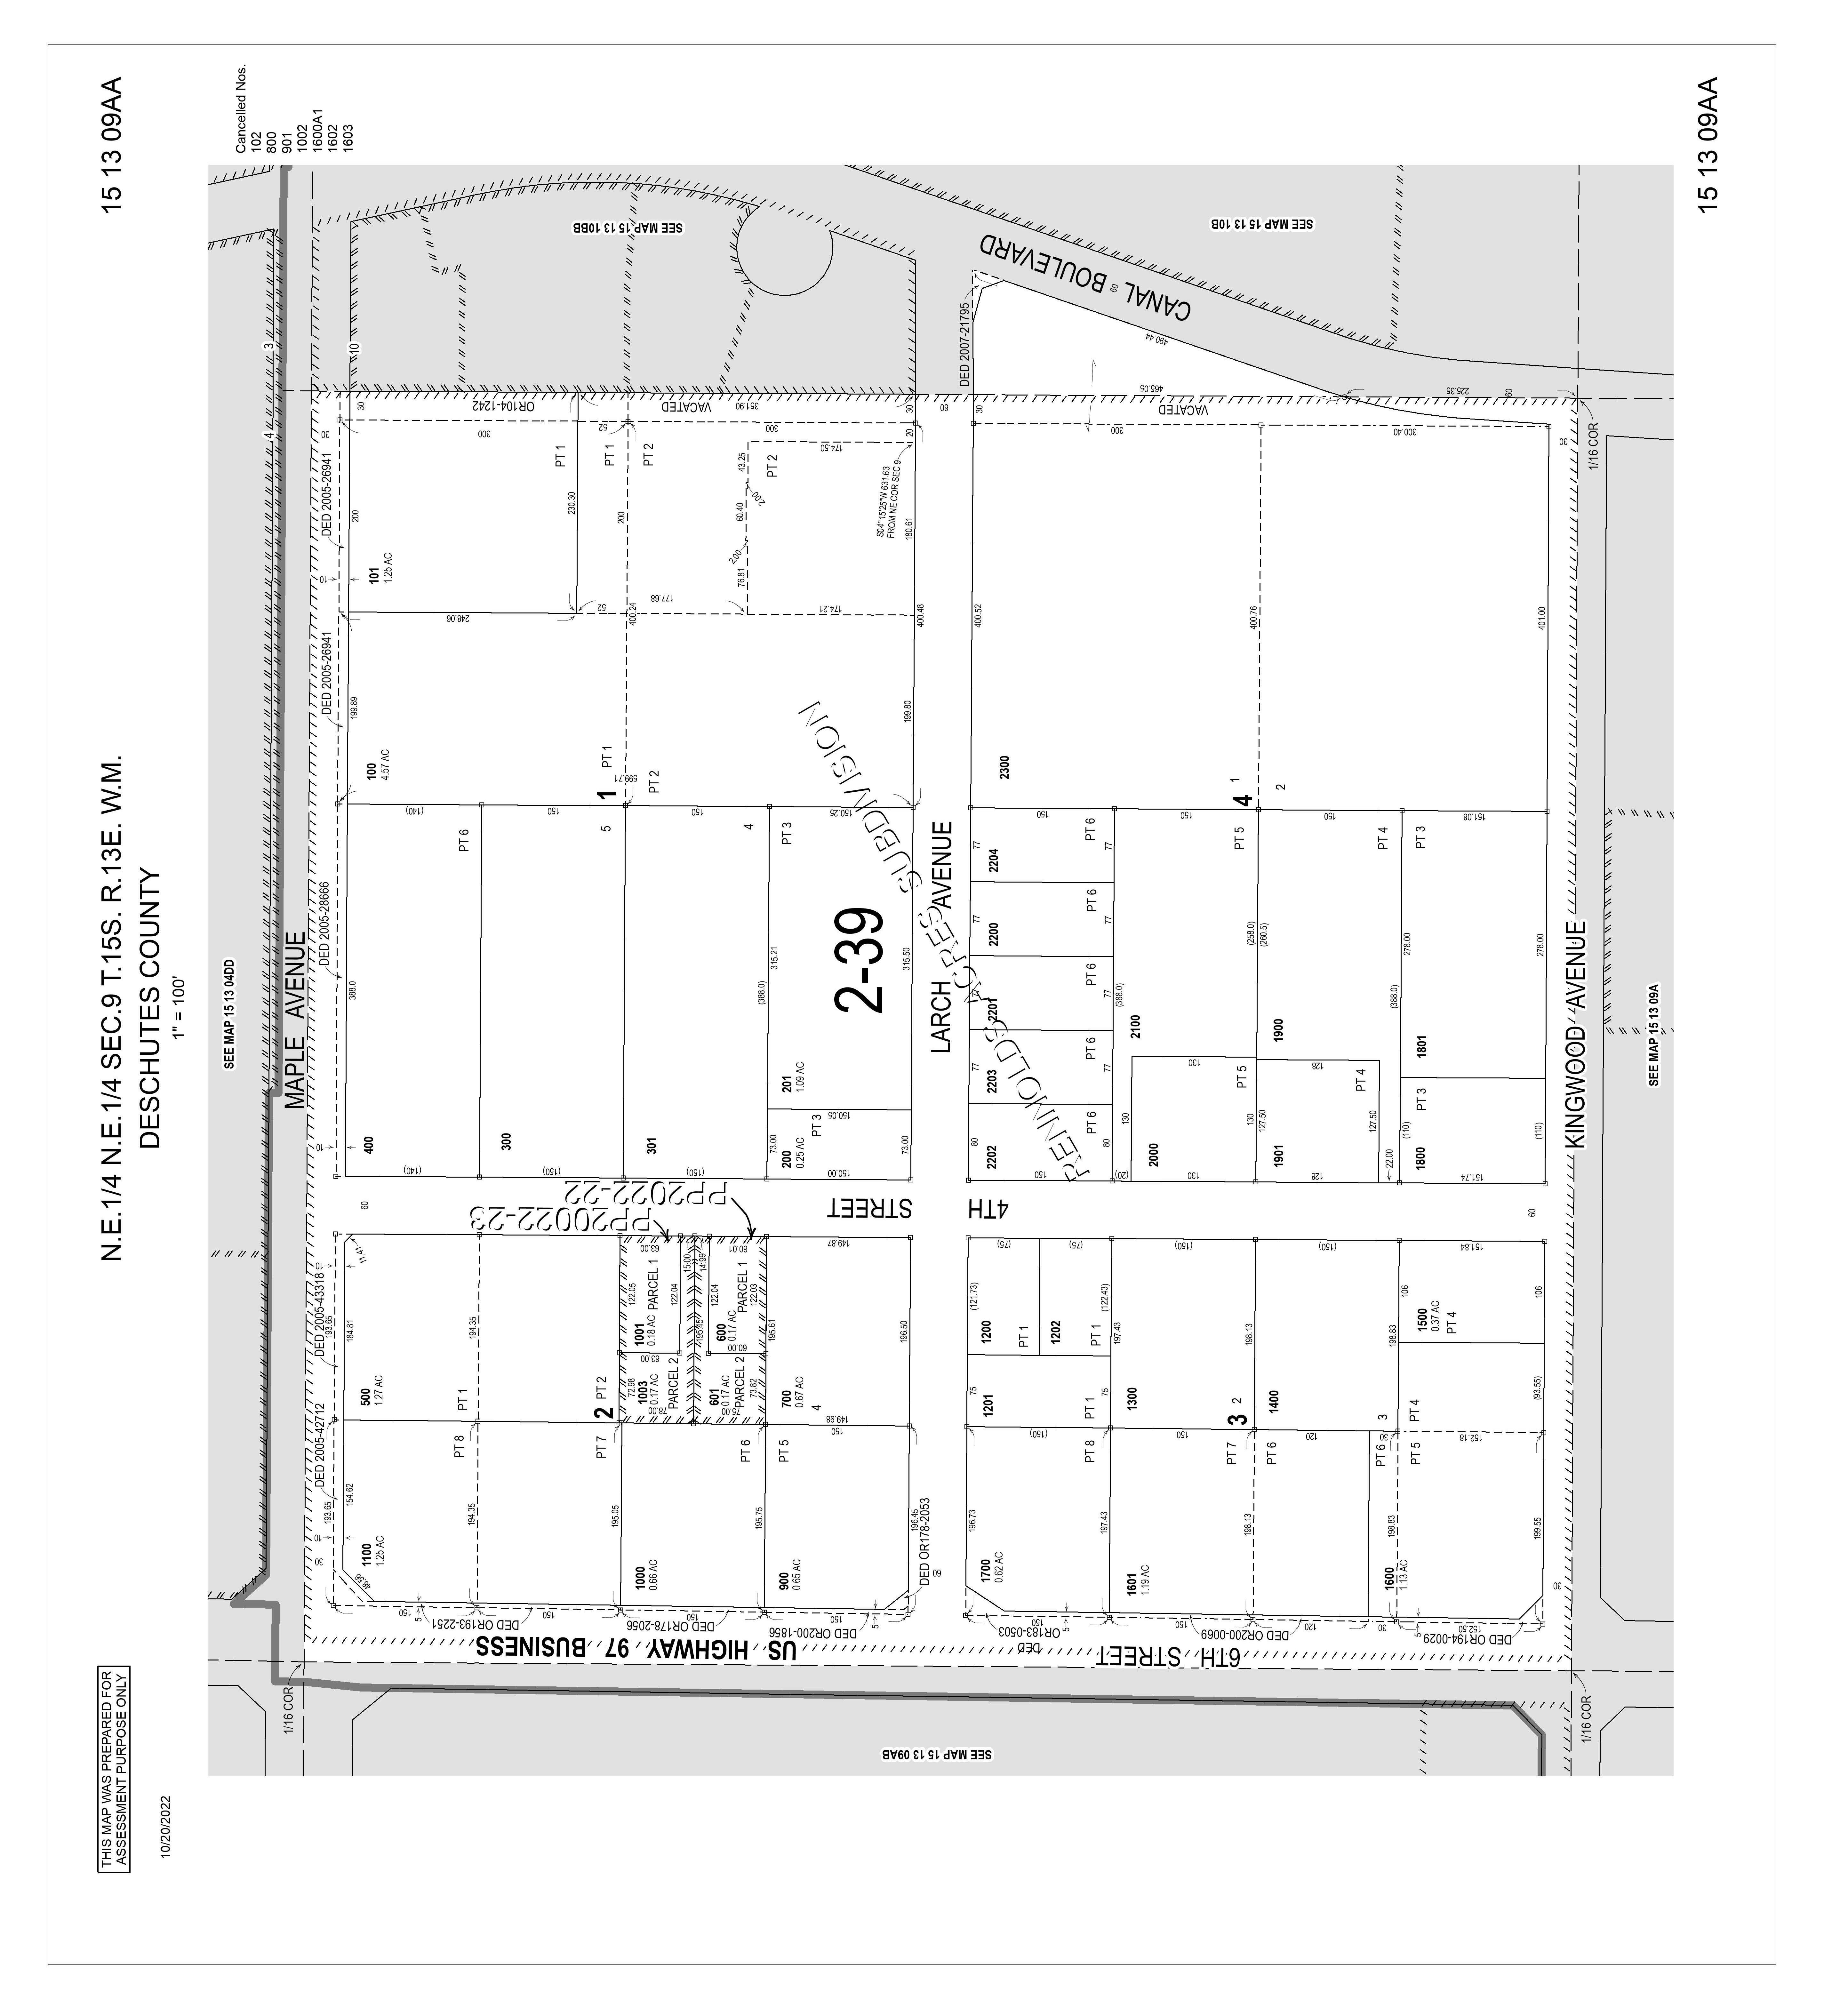
AssessorMap
ParcelID:122332
TaxAccount#:151309AA01100
1520NW6thSt, RedmondOR97756
Thismap/plat isbeingfurnishedasanaidinlocatingtheherein describedlandinrelationtoadjoiningstreets,natural boundariesandotherland,andisnot asurveyoftheland depicted Except totheextent apolicyoftitleinsuranceis expresslymodifiedbyendorsement,ifany,thecompanydoes not insuredimensions,distances,locationofeasements, acreageorothermattersshownthereon

3000 3000 2900 3 0 0 0 Contours Map 15 20 NW 6th St BEND LA PIN E SISTERS REDMOND SUNR IVER 20 97 126 20 20 97 Map Data is deemed reliable but not guaranteed Deschutes County Tit e accepts no respons bility for accuracy 0 1,250 2,500 625 Feet 151309AA01100
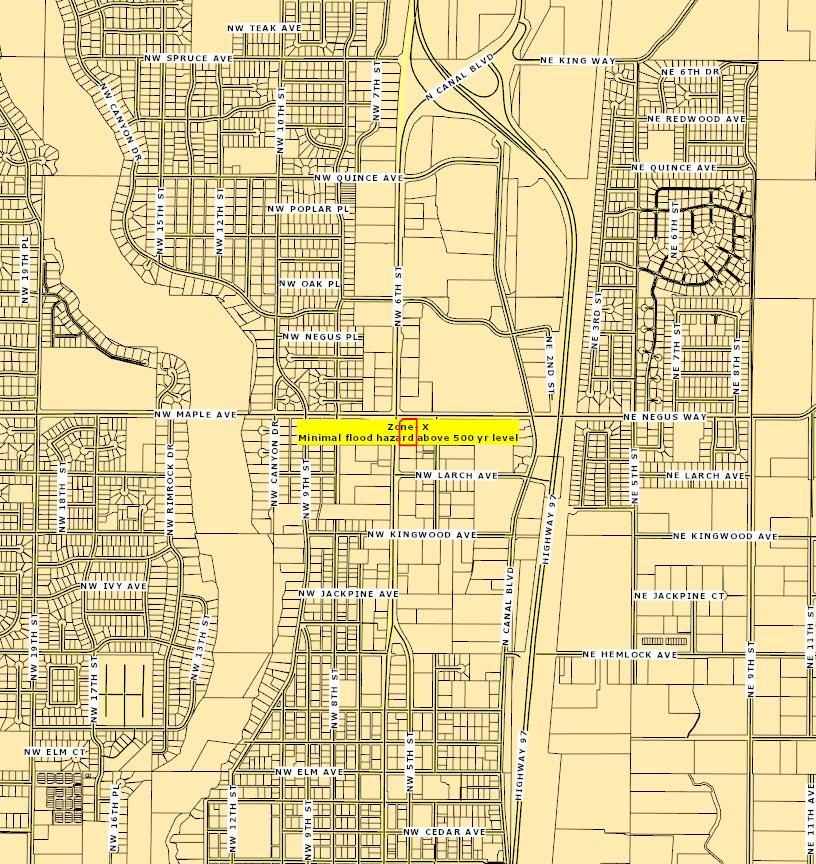
FloodMap
ParcelID:122332
TaxAccount#:151309AA01100
1520NW6thSt, RedmondOR97756
Thismap/plat isbeingfurnishedasanaidinlocatingtheherein describedlandinrelationtoadjoiningstreets,natural boundariesandotherland,andisnot asurveyoftheland depicted Except totheextent apolicyoftitleinsuranceis expresslymodifiedbyendorsement,ifany,thecompanydoes not insuredimensions,distances,locationofeasements, acreageorothermattersshownthereon
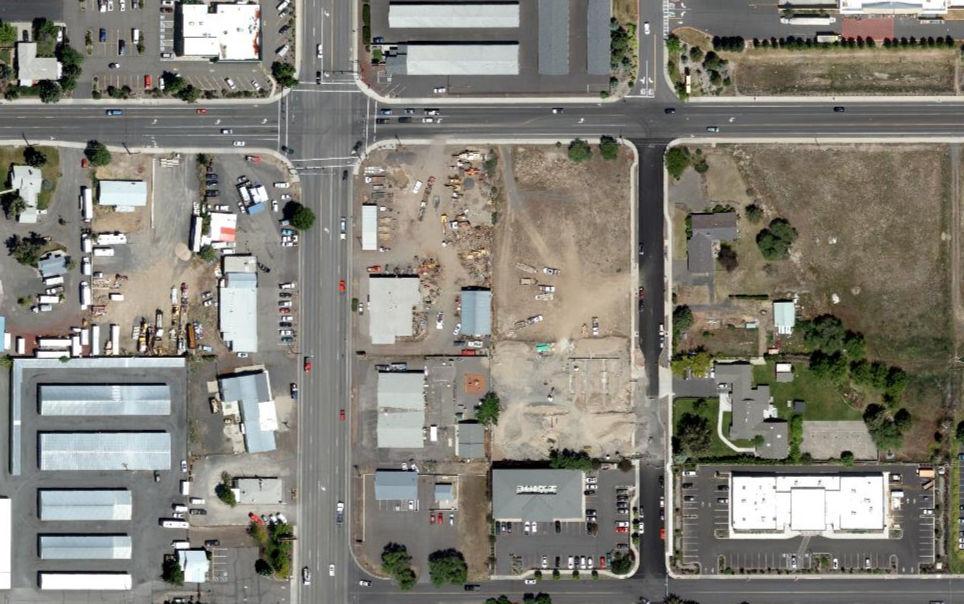
AerialMap
ParcelID:122332
TaxAccount#:151309AA01100
1520NW6thSt, RedmondOR97756
Thismap/plat isbeingfurnishedasanaidinlocatingtheherein describedlandinrelationtoadjoiningstreets,natural boundariesandotherland,andisnot asurveyoftheland depicted Except totheextent apolicyoftitleinsuranceis expresslymodifiedbyendorsement,ifany,thecompanydoes not insuredimensions,distances,locationofeasements, acreageorothermattersshownthereon
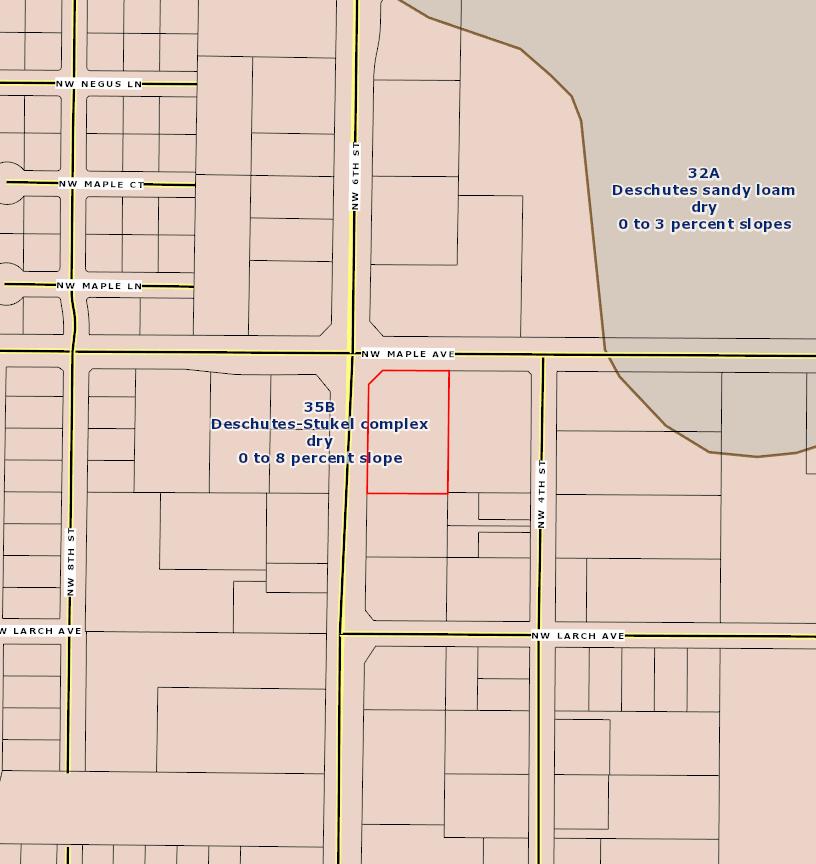
SoilMap
ParcelID:122332
TaxAccount#:151309AA01100
1520NW6thSt, RedmondOR97756
Thismap/plat isbeingfurnishedasanaidinlocatingtheherein describedlandinrelationtoadjoiningstreets,natural boundariesandotherland,andisnot asurveyoftheland depicted Except totheextent apolicyoftitleinsuranceis expresslymodifiedbyendorsement,ifany,thecompanydoes not insuredimensions,distances,locationofeasements, acreageorothermattersshownthereon
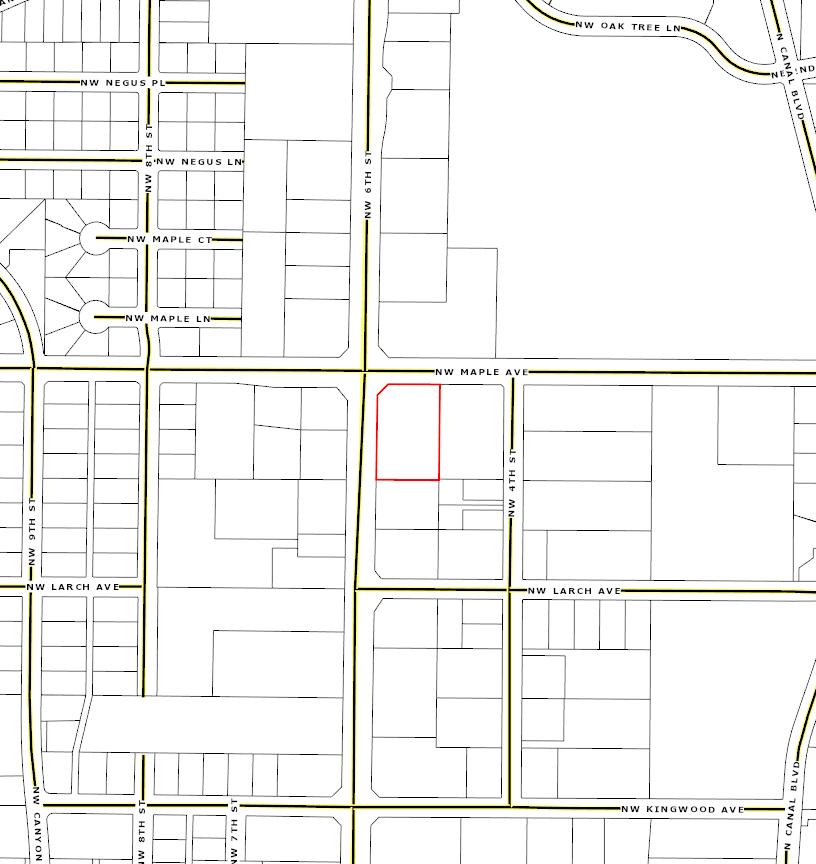
StreetMap
ParcelID:122332
TaxAccount#:151309AA01100
1520NW6thSt, RedmondOR97756
Thismap/plat isbeingfurnishedasanaidinlocatingtheherein describedlandinrelationtoadjoiningstreets,natural boundariesandotherland,andisnot asurveyoftheland depicted Except totheextent apolicyoftitleinsuranceis expresslymodifiedbyendorsement,ifany,thecompanydoes not insuredimensions,distances,locationofeasements, acreageorothermattersshownthereon
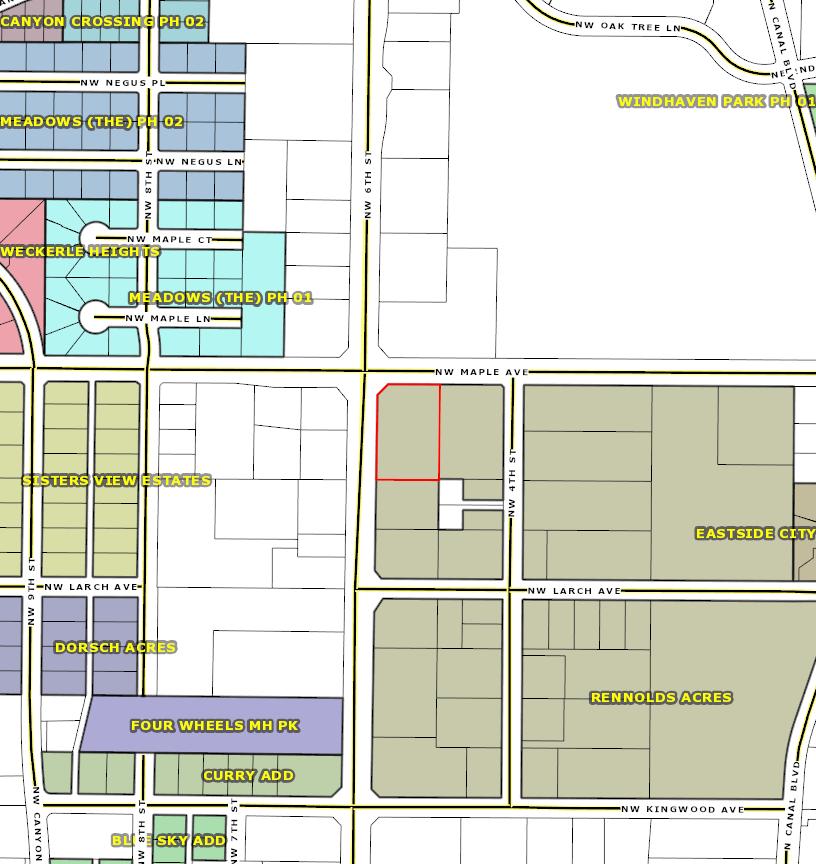
SubdivisionMap
ParcelID:122332
TaxAccount#:151309AA01100
1520NW6thSt, RedmondOR97756
Thismap/plat isbeingfurnishedasanaidinlocatingtheherein describedlandinrelationtoadjoiningstreets,natural boundariesandotherland,andisnot asurveyoftheland depicted Except totheextent apolicyoftitleinsuranceis expresslymodifiedbyendorsement,ifany,thecompanydoes not insuredimensions,distances,locationofeasements, acreageorothermattersshownthereon
TransportationMap
ZoningMap
ParcelID:122332
TaxAccount#:151309AA01100
1520NW6thSt, RedmondOR97756
Thismap/plat isbeingfurnishedasanaidinlocatingtheherein describedlandinrelationtoadjoiningstreets,natural boundariesandotherland,andisnot asurveyoftheland depicted Except totheextent apolicyoftitleinsuranceis expresslymodifiedbyendorsement,ifany,thecompanydoes not insuredimensions,distances,locationofeasements, acreageorothermattersshownthereon
CHAPTER 8
REDMOND CODE
The contents of Chapter Development Regulations can be found here: https://www.redmondoregon.gov/home/showpublisheddocument/3426/638091 082331730000
DEVELOPMENT REGULATIONS
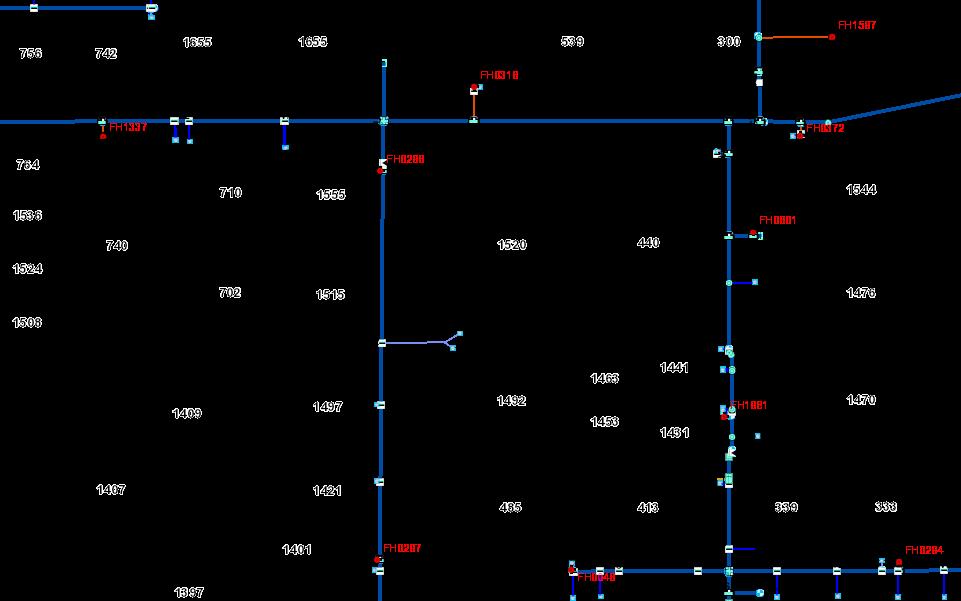
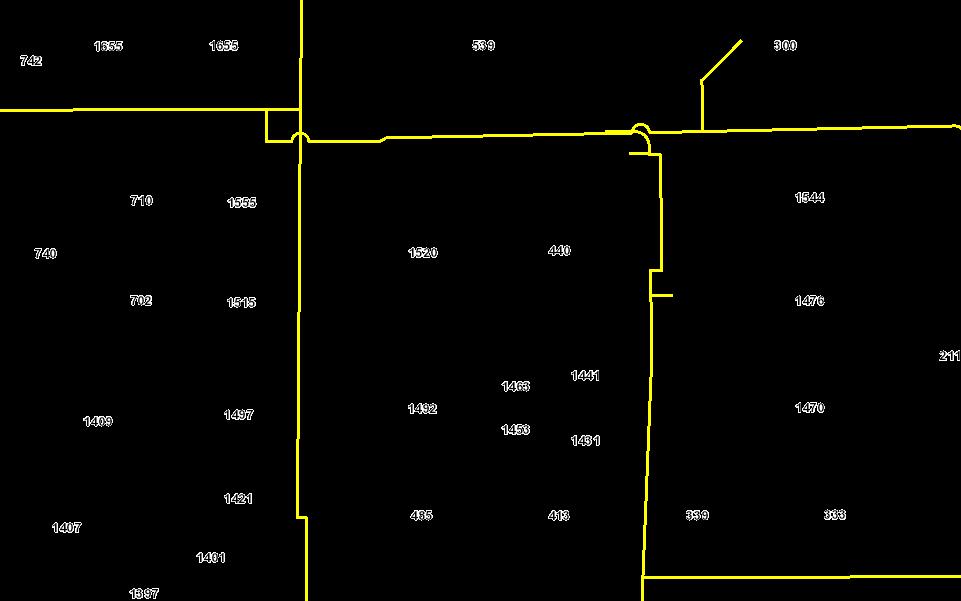
Water Distribution Map - 1520 NW 6th St Redmond Esri Community Maps Contributors, Oregon State Parks, State of Oregon GEO, © OpenStreetMap, Microsoft, Esri, HERE, Garmin, SafeGraph, REDMOND TAXLOTS WATER LATERAL Commercial Domestic Fire HydrantLaterals Industrial Irrigation System Commercial/Fire GRAVITY MAIN SYSTEM VALVE FITTINGS Bend Cap Coupling Cross ExpansionJoint 8/28/2023, 9:29:06 AM 0 0.03 0.05 0.01 mi 0 0.04 0.08 0.02 km 1:2,257 Web AppBuilder for ArcGIS Esri Community Maps Contributors, Oregon State Parks, State of Oregon GEO, © OpenStreetMap, Microsoft, Esri, HERE, Garmin, SafeGraph, GeoTechnologies, Inc, METI/NASA, USGS, Bureau of Land Management, EPA, NPS, US Census Bureau, USDA | Esri
NW M l L 97
1520 NW 6th St Redmond Esri Community Maps Contributors, Oregon State Parks, State of Oregon GEO, © OpenStreetMap, Microsoft, Esri, HERE, Garmin, SafeGraph, REDMOND TAXLOTS WATER LATERAL Commercial Domestic Fire HydrantLaterals Industrial Irrigation System Commercial/Fire GRAVITY MAIN SYSTEM VALVE FITTINGS Bend Cap Coupling Cross ExpansionJoint 8/28/2023, 9:30:17 AM 0 0.03 0.05 0.01 mi 0 0.04 0.08 0.02 km 1:2,257 Web AppBuilder for ArcGIS Esri Community Maps Contributors, Oregon State Parks, State of Oregon GEO, © OpenStreetMap, Microsoft, Esri, HERE, Garmin, SafeGraph, GeoTechnologies, Inc, METI/NASA, USGS, Bureau of Land Management, EPA, NPS, US Census Bureau, USDA | Esri
Water Distribution Map -
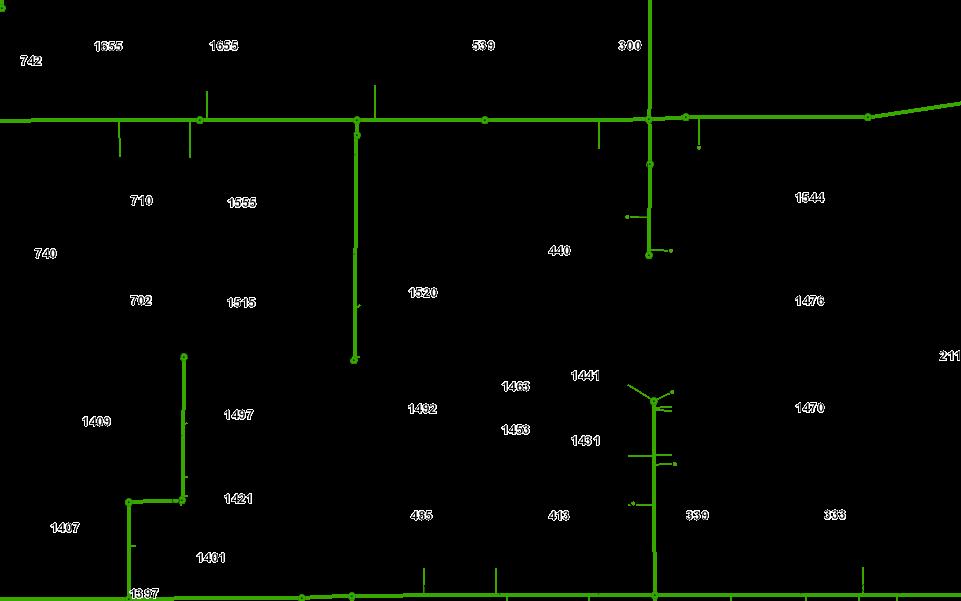
Waste Water Collection Map - 1520 NW 6th St Redmond Esri Community Maps Contributors, Oregon State Parks, State of Oregon GEO, © OpenStreetMap, Microsoft, Esri, HERE, Garmin, SafeGraph, COLLECTION MAIN SERVICE LATERAL CLEAN OUT MANHOLE PRESSURE MAIN PUMP STATION REDMOND TAXLOTS 8/28/2023, 9:31:48 AM 0 0.03 0.05 0.01 mi 0 0.04 0.08 0.02 km 1:2,257 Web AppBuilder for ArcGIS Esri Community Maps Contributors, Oregon State Parks, State of Oregon GEO, © OpenStreetMap, Microsoft, Esri, HERE, Garmin, SafeGraph, GeoTechnologies, Inc, METI/NASA, USGS, Bureau of Land Management, EPA, NPS, US Census Bureau, USDA | Esri
Waste Water Collection Map - 1520 NW 6th St Redmond Esri Community Maps Contributors, Oregon State Parks, State of Oregon GEO, © OpenStreetMap, Microsoft, Esri, HERE, Garmin, SafeGraph, COLLECTION MAIN SERVICE LATERAL CLEAN OUT MANHOLE PRESSURE MAIN PUMP STATION REDMOND TAXLOTS 8/28/2023, 9:31:17 AM 0 0.03 0.05 0.01 mi 0 0.04 0.08 0.02 km 1:2,257 Web AppBuilder for ArcGIS Esri Community Maps Contributors, Oregon State Parks, State of Oregon GEO, © OpenStreetMap, Microsoft, Esri, HERE, Garmin, SafeGraph, GeoTechnologies, Inc, METI/NASA, USGS, Bureau of Land Management, EPA, NPS, US Census Bureau, USDA | Esri
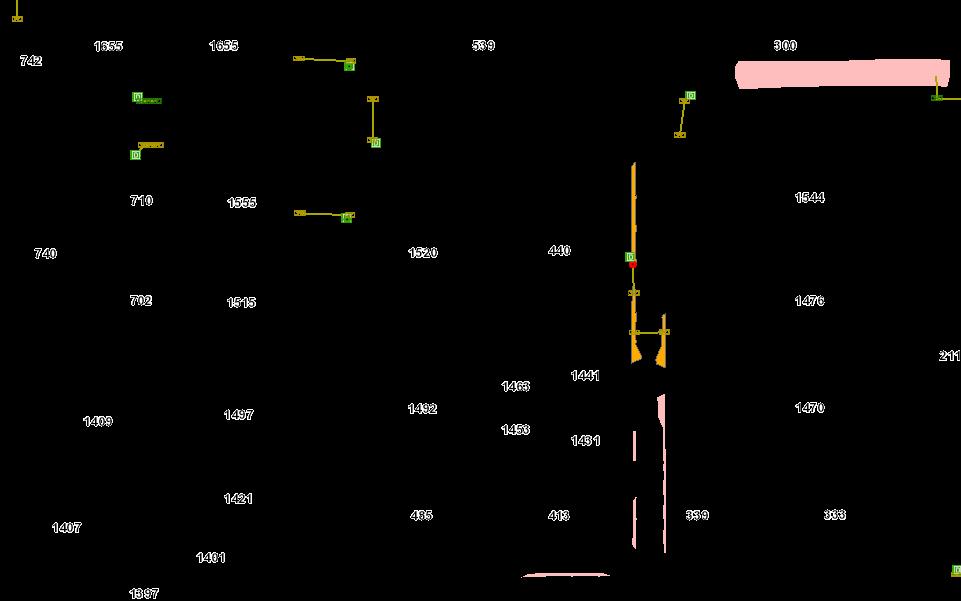
Stormwater Map - 1520 NW 6th St Redmond Esri Community Maps Contributors, Oregon State Parks, State of Oregon GEO, © OpenStreetMap, Microsoft, Esri, HERE, Garmin, SafeGraph, DETENTION BASINS INFILTRATION BASIN POND SWALE STORM PIPE ACCESS POINTS CLEANOUT MANHOLE OTHER SEDIMENTATION MANHOLE VAULT STORM UIC FACILITIES DRILL HOLE DRYWELL FRENCH DRAIN 8/28/2023, 9:33:02 AM 0 0.03 0.05 0.01 mi 0 0.04 0.08 0.02 km 1:2,257 Web AppBuilder for ArcGIS Esri Community Maps Contributors, Oregon State Parks, State of Oregon GEO, © OpenStreetMap, Microsoft, Esri, HERE, Garmin, SafeGraph, GeoTechnologies, Inc, METI/NASA, USGS, Bureau of Land Management, EPA, NPS, US Census Bureau, USDA | Esri
Map - 1520 NW 6th St Redmond Esri Community Maps Contributors, Oregon State Parks, State of Oregon GEO, © OpenStreetMap, Microsoft, Esri, HERE, Garmin, SafeGraph, DETENTION BASINS INFILTRATION BASIN POND SWALE STORM PIPE ACCESS POINTS CLEANOUT MANHOLE OTHER SEDIMENTATION MANHOLE VAULT STORM UIC FACILITIES DRILL HOLE DRYWELL FRENCH DRAIN 8/28/2023, 9:33:43 AM 0 0.03 0.05 0.01 mi 0 0.04 0.08 0.02 km 1:2,257 Web AppBuilder for ArcGIS Esri Community Maps Contributors, Oregon State Parks, State of Oregon GEO, © OpenStreetMap, Microsoft, Esri, HERE, Garmin, SafeGraph, GeoTechnologies, Inc, METI/NASA, USGS, Bureau of Land Management, EPA, NPS, US Census Bureau, USDA | Esri
Stormwater
Natural Gas Map - 1520 NW 6th St Redmond Esri Community Maps Contributors, Oregon State Parks, State of Oregon GEO, © OpenStreetMap, Microsoft, Esri, HERE, Garmin, SafeGraph, NATURAL GAS REDMOND TAXLOTS 8/28/2023, 9:35:40 AM 0 0.03 0.05 0.01 mi 0 0.04 0.08 0.02 km 1:2,257 Web AppBuilder for ArcGIS Esri Community Maps Contributors, Oregon State Parks, State of Oregon GEO, © OpenStreetMap, Microsoft, Esri, HERE, Garmin, SafeGraph, GeoTechnologies, Inc, METI/NASA, USGS, Bureau of Land Management, EPA, NPS, US Census Bureau, USDA | Esri
Natural Gas Map - 1520 NW 6th St Redmond Esri Community Maps Contributors, Oregon State Parks, State of Oregon GEO, © OpenStreetMap, Microsoft, Esri, HERE, Garmin, SafeGraph, NATURAL GAS REDMOND TAXLOTS 8/28/2023, 9:35:11 AM 0 0.03 0.05 0.01 mi 0 0.04 0.08 0.02 km 1:2,257 Web AppBuilder for ArcGIS Esri Community Maps Contributors, Oregon State Parks, State of Oregon GEO, © OpenStreetMap, Microsoft, Esri, HERE, Garmin, SafeGraph, GeoTechnologies, Inc, METI/NASA, USGS, Bureau of Land Management, EPA, NPS, US Census Bureau, USDA | Esri
Site Details Map
City: Redmond County: Deschutes County
State: Oregon
ZIP Code: 97756
Census Tract: 41017000800
Census Block Group: 410170008001
CBSA: Bend, OR Metropolitan Statistical Area

of Land Management, State of Oregon GEO, State of Oregon, Esri, HERE, Garmin, INCREMENT P, NGA, USGS, U.S. Forest Service 0 0.8 1.6 mi
Bureau
6th St, Redmond, Oregon,
Prepared by Esri Rings: 1, 3, 5 mile radii Latitude: 44.29027 Longitude: -121.17359
1520 NW
97756
This site is located in:
August 28, 2023 ©2023 Esri Page 1 of 1
ACS Population Summary

1520 NW 6th St, Redmond, Oregon, 97756 Prepared by Esri Ring: 1 mile radius Latitude: 44.29027 Longitude: -121.17359 2017-2021 ACS Estimate Percent MOE(±) Reliability TOTALS Total Population 7,878 665 Total Households 3,150 228 Total Housing Units 3,321 232 POPULATION AGE 3+ YEARS BY SCHOOL ENROLLMENT Total 7,695 100.0% 642 Enrolled in school 1,669 21 7% 265 Enrolled in nursery school, preschool 109 1 4% 36 Public school 71 0.9% 43 Private school 38 0.5% 41 Enrolled in kindergarten 9 0.1% 16 Public school 9 0.1% 16 Private school 0 0.0% 0 Enrolled in grade 1 to grade 4 387 5.0% 101 Public school 379 4.9% 101 Private school 8 0 1% 23 Enrolled in grade 5 to grade 8 398 5.2% 108 Public school 315 4 1% 103 Private school 83 1.1% 45 Enrolled in grade 9 to grade 12 392 5 1% 138 Public school 349 4.5% 138 Private school 43 0.6% 23 Enrolled in college undergraduate years 305 4.0% 121 Public school 279 3.6% 125 Private school 26 0.3% 64 Enrolled in graduate or professional school 70 0 9% 56 Public school 41 0.5% 45 Private school 29 0.4% 33 Not enrolled in school 6,026 78.3% 421 POPULATION AGE 65+ BY RELATIONSHIP AND HOUSEHOLD TYPE Total 1,396 100.0% 128 Living in Households 1,388 99 4% 124 Living in Family Households 1,009 72 3% 113 Householder 481 34 5% 64 Spouse 425 30 4% 60 Parent 12 0.9% 27 Parent-in-law 31 2.2% 99 Other Relative 37 2.7% 28 Nonrelative 24 1.7% 47 Living in Nonfamily Households 378 27 1% 73 Householder 368 26.4% 71 Nonrelative 10 0.7% 28 Living in Group Quarters 8 0 6% 27 Source: U.S. Census Bureau, 2017-2021 American Community Survey Reliability: high medium low August 28, 2023 ©2023 Esri Page 1 of 24
ACS Population Summary
1520 NW 6th St, Redmond, Oregon, 97756 Prepared by Esri Ring: 1 mile radius Latitude: 44.29027 Longitude: -121.17359 2017-2021 ACS Estimate Percent MOE(±) Reliability HOUSEHOLDS BY TYPE AND SIZE Family Households 2,105 66 8% 236 2-Person 960 30.5% 128 3-Person 503 16 0% 184 4-Person 368 11 7% 124 5-Person 214 6 8% 78 6-Person 32 1.0% 26 7+ Person 27 0.9% 63 Nonfamily Households 1,045 33 2% 127 1-Person 857 27 2% 113 2-Person 172 5.5% 63 3-Person 16 0.5% 94 4-Person 0 0.0% 0 5-Person 0 0.0% 0 6-Person 0 0.0% 0 7+ Person 0 0.0% 0 HOUSEHOLDS BY PRESENCE OF PEOPLE UNDER 18 YEARS BY HOUSEHOLD TYPE Households with one or more people under 18 years 776 24.6% 121 Family households 776 24.6% 121 Married-couple family 583 18.5% 110 Male householder, no wife present 93 3.0% 58 Female householder, no husband present 100 3.2% 49 Nonfamily households 0 0.0% 0 Households with no people under 18 years 2,374 75.4% 217 Married-couple family 1,075 34.1% 208 Other family 255 8.1% 95 Nonfamily households 1,045 33.2% 127 HOUSEHOLDS BY PRESENCE OF PEOPLE 65 YEARS AND OVER, HOUSEHOLD SIZE AND HOUSEHOLD TYPE Households with Pop 65+ 974 30.9% 94 1-Person 339 10.8% 69 2+ Person Family 608 19.3% 72 2+ Person Nonfamily 27 0.9% 18 Households with No Pop 65+ 2,176 69.1% 247 1-Person 517 16.4% 111 2+ Person Family 1,498 47.6% 230 2+ Person Nonfamily 161 5.1% 62 HOUSEHOLD TYPE BY RELATIVES AND NONRELATIVES FOR POPULATION IN HOUSEHOLDS POPULATION IN HOUSEHOLDS Total 7,842 100.0% 661 In Family Households 6,583 83 9% 688 In Married-Couple Family 4,904 62 5% 659 Relatives 4,808 61 3% 629 Nonrelatives 96 1.2% 78 In Male Householder-No Spouse Present-Family 443 5.6% 212 Relatives 361 4 6% 152 Nonrelatives 82 1.0% 72 In Female Householder-No Spouse Present-Family 1,235 15 7% 354 Relatives 1,155 14.7% 337 Nonrelatives 80 1.0% 65 In Nonfamily Households 1,260 16 1% 171 Source: U.S. Census Bureau, 2017-2021 American Community Survey Reliability: high medium low August 28, 2023 ©2023 Esri Page 2 of 24
ACS Population Summary
1520 NW 6th St, Redmond, Oregon, 97756 Prepared by Esri Ring: 1 mile radius Latitude: 44.29027 Longitude: -121.17359 2017-2021 ACS Estimate Percent MOE(±) Reliability POPULATION AGE 5+ YEARS BY LANGUAGE SPOKEN AT HOME AND ABILITY TO SPEAK ENGLISH Total 7,520 100.0% 628 5 to 17 years Speak only English 1,045 13 9% 188 Speak Spanish 126 1.7% 85 Speak English "very well" or "well" 74 1.0% 52 Speak English "not well" 52 0.7% 62 Speak English "not at all" 0 0 0% 0 Speak other Indo-European languages 0 0.0% 0 Speak English "very well" or "well" 0 0.0% 0 Speak English "not well" 0 0.0% 0 Speak English "not at all" 0 0 0% 0 Speak Asian and Pacific Island languages 0 0.0% 0 Speak English "very well" or "well" 0 0.0% 0 Speak English "not well" 0 0.0% 0 Speak English "not at all" 0 0 0% 0 Speak other languages 0 0.0% 0 Speak English "very well" or "well" 0 0.0% 0 Speak English "not well" 0 0.0% 0 Speak English "not at all" 0 0 0% 0 18 to 64 years Speak only English 4,463 59.3% 579 Speak Spanish 324 4.3% 93 Speak English "very well" or "well" 259 3 4% 113 Speak English "not well" 65 0.9% 54 Speak English "not at all" 0 0 0% 0 Speak other Indo-European languages 156 2.1% 77 Speak English "very well" or "well" 156 2 1% 77 Speak English "not well" 0 0.0% 0 Speak English "not at all" 0 0 0% 0 Speak Asian and Pacific Island languages 11 0.1% 19 Speak English "very well" or "well" 11 0.1% 19 Speak English "not well" 0 0.0% 0 Speak English "not at all" 0 0 0% 0 Speak other languages 0 0.0% 0 Speak English "very well" or "well" 0 0.0% 0 Speak English "not well" 0 0.0% 0 Speak English "not at all" 0 0 0% 0 65 years and over Speak only English 1,298 17 3% 122 Speak Spanish 81 1.1% 37 Speak English "very well" or "well" 31 0.4% 64 Speak English "not well" 24 0.3% 47 Speak English "not at all" 26 0 3% 75 Speak other Indo-European languages 17 0.2% 34 Speak English "very well" or "well" 17 0.2% 34 Speak English "not well" 0 0.0% 0 Speak English "not at all" 0 0 0% 0 Speak Asian and Pacific Island languages 0 0.0% 0 Speak English "very well" or "well" 0 0.0% 0 Speak English "not well" 0 0.0% 0 Speak English "not at all" 0 0 0% 0 Speak other languages 0 0.0% 0 Speak English "very well" or "well" 0 0.0% 0 Speak English "not well" 0 0.0% 0 Speak English "not at all" 0 0 0% 0 Source: U.S. Census Bureau, 2017-2021 American Community Survey Reliability: high medium low August 28, 2023 ©2023 Esri Page 3 of 24
1520 NW 6th St, Redmond, Oregon, 97756 Prepared by Esri Ring: 1 mile radius Latitude: 44.29027 Longitude: -121.17359 2017-2021 ACS Estimate Percent MOE(±) Reliability WORKERS AGE 16+ YEARS BY PLACE OF WORK Total 3,645 100.0% 369 Worked in state and in county of residence 3,467 95.1% 361 Worked in state and outside county of residence 149 4 1% 58 Worked outside state of residence 29 0.8% 14 SEX BY CLASS OF WORKER FOR THE CIVILIAN EMPLOYED POPULATION 16 YEARS AND OVER Total: 3,785 100.0% 435 Male: 1,807 47 7% 299 Employee of private company workers 1,292 34 1% 231 Self-employed in own incorporated business workers 213 5.6% 70 Private not-for-profit wage and salary workers 48 1.3% 34 Local government workers 125 3.3% 93 State government workers 31 0.8% 28 Federal government workers 50 1.3% 49 Self-employed in own not incorporated business workers 47 1.2% 26 Unpaid family workers 0 0.0% 0 Female: 1,978 52 3% 225 Employee of private company workers 1,154 30 5% 205 Self-employed in own incorporated business workers 117 3 1% 46 Private not-for-profit wage and salary workers 387 10 2% 149 Local government workers 139 3.7% 48 State government workers 46 1.2% 14 Federal government workers 25 0.7% 27 Self-employed in own not incorporated business workers 102 2.7% 53 Unpaid family workers 8 0 2% 22 POPULATION IN HOUSEHOLDS AND PRESENCE OF A COMPUTER Total 7,842 100.0% 661 Population <18 in Households 1,529 19 5% 225 Have a Computer 1,529 19 5% 228 Have NO Computer 0 0.0% 0 Population 18-64 in Households 4,926 62 8% 581 Have a Computer 4,890 62 4% 581 Have NO Computer 36 0 5% 86 Population 65+ in Households 1,388 17 7% 124 Have a Computer 1,344 17.1% 123 Have NO Computer 44 0 6% 38 HOUSEHOLDS AND INTERNET SUBSCRIPTIONS Total 3,150 100.0% 228 With an Internet Subscription 2,861 90.8% 232 Dial-Up Alone 9 0 3% 27 Broadband 2,222 70 5% 219 Satellite Service 199 6.3% 55 Other Service 8 0 3% 27 Internet Access with no Subscription 68 2.2% 36 With No Internet Access 221 7 0% 81 Source: U.S. Census Bureau, 2017-2021 American Community Survey Reliability: high medium low August 28, 2023 ©2023 Esri Page 4 of 24
ACS Population Summary
ACS Population Summary
1520 NW 6th St, Redmond, Oregon, 97756 Prepared by Esri Ring: 1 mile radius Latitude: 44.29027 Longitude: -121.17359 2017-2021 ACS Estimate Percent MOE(±) Reliability WORKERS AGE 16+ YEARS BY MEANS OF TRANSPORTATION TO WORK Total 3,645 100.0% 369 Drove alone 2,390 65 6% 276 Carpooled 652 17 9% 177 Public transportation (excluding taxicab) 39 1.1% 98 Bus or trolley bus 39 1.1% 98 Light rail, streetcar or trolley 0 0.0% 0 Subway or elevated 0 0.0% 0 Long-distance/Commuter Train 0 0.0% 0 Ferryboat 0 0.0% 0 Taxicab 18 0.5% 30 Motorcycle 12 0.3% 24 Bicycle 7 0.2% 23 Walked 88 2.4% 55 Other means 16 0.4% 30 Worked at home 423 11 6% 185
AGE
BY TRAVEL TIME TO WORK Total 3,221 100.0% 349 Less than 5 minutes 145 4.5% 56 5 to 9 minutes 609 18.9% 206 10 to 14 minutes 567 17 6% 93 15 to 19 minutes 362 11 2% 103 20 to 24 minutes 275 8.5% 115 25 to 29 minutes 230 7 1% 61 30 to 34 minutes 689 21.4% 151 35 to 39 minutes 70 2 2% 46 40 to 44 minutes 123 3.8% 65 45 to 59 minutes 51 1 6% 45 60 to 89 minutes 76 2.4% 82 90 or more minutes 25 0 8% 29 Average Travel Time to Work (in minutes) N/A N/A
WORKERS
16+ YEARS (WHO DID NOT WORK FROM HOME)
CHILDREN AND EMPLOYMENT STATUS Total 2,699 100.0% 345 Own children under 6 years only 209 7.7% 106 In labor force 150 5 6% 95 Not in labor force 59 2.2% 78 Own children under 6 years and 6 to 17 years 95 3 5% 50 In labor force 50 1.9% 49 Not in labor force 45 1.7% 43 Own children 6 to 17 years only 458 17.0% 90 In labor force 377 14 0% 84 Not in labor force 81 3.0% 44 No own children under 18 years 1,937 71 8% 333 In labor force 1,412 52.3% 290 Not in labor force 526 19 5% 141 Source: U.S. Census Bureau, 2017-2021 American Community Survey Reliability: high medium low August 28, 2023 ©2023 Esri Page 5 of 24
FEMALES AGE 20-64 YEARS BY AGE OF OWN
1520 NW 6th St, Redmond, Oregon, 97756 Prepared by Esri Ring: 1 mile radius Latitude: 44.29027 Longitude: -121.17359 2017-2021 ACS Estimate Percent MOE(±) Reliability CIVILIAN NONINSTITUTIONALIZED POPULATION BY AGE & TYPES OHEALINSURANCE COVERAGE OF HEALTH INSURANCE COVERAGE Total 7,874 100.0% 663 Under 19 years: 1,646 20 9% 235 One Type of Health Insurance: 1,492 18 9% 240 Employer-Based Health Ins Only 711 9.0% 178 Direct-Purchase Health Ins Only 40 0 5% 42 Medicare Coverage Only 0 0.0% 0 Medicaid Coverage Only 578 7 3% 170 TRICARE/Military Hlth Cov Only 162 2.1% 160 VA Health Care Only 0 0.0% 0 2+ Types of Health Insurance 84 1.1% 42 No Health Insurance Coverage 71 0.9% 77 19 to 34 years: 1,528 19.4% 289 One Type of Health Insurance: 1,280 16.3% 245 Employer-Based Health Ins Only 982 12 5% 238 Direct-Purchase Health Ins Only 37 0.5% 31 Medicare Coverage Only 0 0.0% 0 Medicaid Coverage Only 209 2 7% 109 TRICARE/Military Hlth Cov Only 51 0.6% 50 VA Health Care Only 0 0 0% 0 2+ Types of Health Insurance 187 2.4% 135 No Health Insurance Coverage 61 0 8% 46 35 to 64 years: 3,304 42 0% 424 One Type of Health Insurance: 2,438 31 0% 385 Employer-Based Health Ins Only 1,696 21 5% 371 Direct-Purchase Health Ins Only 279 3 5% 87 Medicare Coverage Only 55 0.7% 43 Medicaid Coverage Only 376 4 8% 113 TRICARE/Military Hlth Cov Only 27 0.3% 18 VA Health Care Only 3 0 0% 8 2+ Types of Health Insurance 473 6.0% 124 No Health Insurance Coverage 394 5.0% 126 65+ years: 1,395 17.7% 124 One Type of Health Insurance: 439 5.6% 90 Employer-Based Health Ins Only 8 0.1% 26 Direct-Purchase Health Ins Only 0 0.0% 0 Medicare Coverage Only 431 5.5% 90 TRICARE/Military Hlth Cov Only 0 0 0% 0 VA Health Care Only 0 0.0% 0 2+ Types of Health Insurance: 956 12 1% 101 Employer-Based & Direct-Purchase Health Insurance 0 0.0% 0 Employer-Based Health & Medicare Insurance 176 2 2% 68 Direct-Purchase Health & Medicare Insurance 391 5.0% 67 Medicare & Medicaid Coverage 86 1.1% 38 Other Private Health Insurance Combos 0 0.0% 0 Other Public Health Insurance Combos 18 0.2% 16 Other Health Insurance Combinations 286 3.6% 63 No Health Insurance Coverage 0 0.0% 0 Source: U.S. Census Bureau, 2017-2021 American Community Survey Reliability: high medium low August 28, 2023 ©2023 Esri Page 6 of 24
ACS Population Summary
ACS Population Summary
CIVILIAN POPULATION AGE 18 OR OLDER BY VETERAN STATUS
CIVILIAN VETERANS AGE 18 OR OLDER BY PERIOD OF
HOUSEHOLDS BY POVERTY
1520 NW 6th St, Redmond, Oregon, 97756 Prepared by Esri Ring: 1 mile radius Latitude: 44.29027 Longitude: -121.17359 2017-2021 ACS Estimate Percent MOE(±) Reliability POPULATION
Total 7,839 100.0% 657 Under 50 363 4.6% 142 50 to 99 441 5 6% 257 1 00 to 1 24 285 3.6% 96 1 25 to 1 49 769 9 8% 284 1 50 to 1 84 138 1.8% 73 1 85 to 1 99 108 1 4% 95 2 00 and over 5,736 73 2% 645
BY RATIO OF INCOME TO POVERTY LEVEL
Total 6,349 100.0% 569 Veteran 666 10.5% 136 Nonveteran 5,683 89.5% 522 Male 2,754 43 4% 318 Veteran 586 9 2% 125 Nonveteran 2,168 34 1% 269 Female 3,595 56 6% 335 Veteran 80 1.3% 114 Nonveteran 3,515 55 4% 331
Total 666 100.0% 136 Gulf War (9/01 or later), no Gulf War (8/90 to 8/01), no Vietnam Era 169 25 4% 132 Gulf War (9/01 or later) and Gulf War (8/90 to 8/01), no Vietnam Era 0 0.0% 4 Gulf War (9/01 or later), and Gulf War (8/90 to 8/01), and Vietnam Era 0 0.0% 0 Gulf War (8/90 to 8/01), no Vietnam Era 74 11.1% 73 Gulf War (8/90 to 8/01) and Vietnam Era 0 0.0% 0 Vietnam Era, no Korean War, no World War II 168 25 2% 50 Vietnam Era and Korean War, no World War II 0 0.0% 0 Vietnam Era and Korean War and World War II 0 0.0% 0 Korean War, no Vietnam Era, no World War II 38 5.7% 32 Korean War and World War II, no Vietnam Era 0 0 0% 0 World War II, no Korean War, no Vietnam Era 0 0.0% 0 Between Gulf War and Vietnam Era only 179 26 9% 80 Between Vietnam Era and Korean War only 38 5.7% 17 Between Korean War and World War II only 0 0.0% 0 Pre-World War II only 0 0.0% 0
STATUS Total 3,150 100.0% 228 Income in the past 12 months below poverty level 375 11.9% 91 Married-couple family 60 1.9% 90 Other family - male householder (no wife present) 0 0.0% 0 Other family - female householder (no husband present) 66 2.1% 43 Nonfamily household - male householder 106 3.4% 79 Nonfamily household - female householder 143 4.5% 56 Income in the past 12 months at or above poverty level 2,775 88 1% 218 Married-couple family 1,597 50 7% 227 Other family - male householder (no wife present) 133 4.2% 66 Other family - female householder (no husband present) 249 7.9% 88 Nonfamily household - male householder 246 7.8% 63 Nonfamily household - female householder 550 17 5% 100 Poverty Index 96 Source: U.S. Census Bureau, 2017-2021 American Community Survey Reliability: high medium low August 28, 2023 ©2023 Esri Page 7 of 24
MILITARY SERVICE
ACS Population Summary
Data Note: N/A means not available Population by Ratio of Income to Poverty Level represents persons for whom poverty status is determined. Household income represents income in 2021, adjusted for inflation
2017-2021 ACS Estimate: The American Community Survey (ACS) replaces census sample data. Esri is releasing the 2017-2021 ACS estimates, five-year period data collected monthly from January 1, 2017 through December 31, 2021. Although the ACS includes many of the subjects previously covered by the decennial census sample, there are significant differences between the two surveys including fundamental differences in survey design and residency rules
Margin of error (MOE): The MOE is a measure of the variability of the estimate due to sampling error. MOEs enable the data user to measure the range of uncertainty for each estimate with 90 percent confidence. The range of uncertainty is called the confidence interval, and it is calculated by taking the estimate +/- the MOE. For example, if the ACS reports an estimate of 100 with an MOE of +/- 20, then you can be 90 percent certain the value for the whole population falls between 80 and 120.
Reliability: These symbols represent threshold values that Esri has established from the Coefficients of Variation (CV) to designate the usability of the estimates. The CV measures the amount of sampling error relative to the size of the estimate, expressed as a percentage
High Reliability: Small CVs (less than or equal to 12 percent) are flagged green to indicate that the sampling error is small relative to the estimate and the estimate is reasonably reliable.
Medium Reliability: Estimates with CVs between 12 and 40 are flagged yellow-use with caution.
Low Reliability: Large CVs (over 40 percent) are flagged red to indicate that the sampling error is large relative to the estimate. The estimate is considered very unreliable.
Source: U.S. Census Bureau, 2017-2021 American Community Survey
Reliability: high medium low
1520 NW 6th St, Redmond, Oregon, 97756 Prepared by Esri Ring: 1 mile radius Latitude: 44.29027 Longitude: -121.17359 2017-2021 ACS Estimate Percent MOE(±) Reliability HOUSEHOLDS BY OTHER INCOME Social Security Income 1,151 36 5% 136 No Social Security Income 1,999 63.5% 237 Retirement Income 847 26 9% 126 No Retirement Income 2,303 73 1% 225 GROSS RENT AS A PERCENTAGE OF HOUSEHOLD INCOME IN THE PAST 12 MONTHS <10% of Income 29 3.2% 47 10-14 9% of Income 87 9.6% 85 15-19 9% of Income 60 6 6% 17 20-24 9% of Income 55 6.1% 49 25-29.9% of Income 108 12.0% 60 30-34 9% of Income 105 11 6% 50 35-39 9% of Income 25 2 8% 27 40-49 9% of Income 72 8.0% 95 50+% of Income 362 40 1% 71 Gross Rent % Inc Not Computed 0 0.0% 0 HOUSEHOLDS BY PUBLIC ASSISTANCE INCOME IN THE PAST 12 MONTHS Total 3,150 100.0% 228 With public assistance income 120 3.8% 79 No public assistance income 3,030 96.2% 220 HOUSEHOLDS BY FOOD STAMPS/SNAP STATUS Total 3,150 100.0% 228 With Food Stamps/SNAP 398 12.6% 71 With No Food Stamps/SNAP 2,752 87.4% 230 HOUSEHOLDS BY DISABILITY STATUS Total 3,150 100.0% 228 With 1+ Persons w/Disability 1,101 35.0% 155 With No Person w/Disability 2,049 65.0% 236
August 28, 2023 ©2023 Esri Page 8 of 24
ACS Population Summary
1520 NW 6th St, Redmond, Oregon, 97756 Prepared by Esri Ring: 3 mile radius Latitude: 44.29027 Longitude: -121.17359 2017-2021 ACS Estimate Percent MOE(±) Reliability TOTALS Total Population 29,169 1,618 Total Households 11,113 579 Total Housing Units 11,481 598 POPULATION AGE 3+ YEARS BY SCHOOL ENROLLMENT Total 28,119 100.0% 1,592 Enrolled in school 6,312 22 4% 660 Enrolled in nursery school, preschool 438 1 6% 183 Public school 273 1.0% 180 Private school 166 0 6% 63 Enrolled in kindergarten 228 0.8% 107 Public school 225 0 8% 108 Private school 3 0.0% 7 Enrolled in grade 1 to grade 4 1,550 5.5% 319 Public school 1,221 4.3% 300 Private school 329 1 2% 182 Enrolled in grade 5 to grade 8 1,622 5.8% 346 Public school 1,403 5 0% 325 Private school 219 0.8% 117 Enrolled in grade 9 to grade 12 1,531 5 4% 330 Public school 1,390 4.9% 318 Private school 141 0 5% 93 Enrolled in college undergraduate years 809 2.9% 222 Public school 701 2.5% 200 Private school 108 0.4% 100 Enrolled in graduate or professional school 134 0 5% 79 Public school 55 0.2% 50 Private school 79 0.3% 61 Not enrolled in school 21,807 77.6% 1,009 POPULATION AGE 65+ BY RELATIONSHIP AND HOUSEHOLD TYPE Total 4,099 100.0% 472 Living in Households 4,044 98 7% 470 Living in Family Households 2,636 64 3% 408 Householder 1,317 32 1% 229 Spouse 993 24 2% 183 Parent 33 0.8% 36 Parent-in-law 126 3 1% 129 Other Relative 103 2.5% 55 Nonrelative 63 1.5% 59 Living in Nonfamily Households 1,408 34 3% 318 Householder 1,323 32.3% 298 Nonrelative 85 2.1% 83 Living in Group Quarters 55 1 3% 44 Source: U.S. Census Bureau, 2017-2021 American Community Survey Reliability: high medium low August 28, 2023 ©2023 Esri Page 9 of 24
ACS Population Summary
1520 NW 6th St, Redmond, Oregon, 97756 Prepared by Esri Ring: 3 mile radius Latitude: 44.29027 Longitude: -121.17359 2017-2021 ACS Estimate Percent MOE(±) Reliability HOUSEHOLDS BY TYPE AND SIZE Family Households 7,054 63 5% 488 2-Person 2,613 23.5% 341 3-Person 1,906 17 2% 389 4-Person 1,348 12 1% 245 5-Person 763 6 9% 220 6-Person 334 3.0% 146 7+ Person 91 0.8% 48 Nonfamily Households 4,059 36 5% 516 1-Person 2,904 26 1% 435 2-Person 907 8.2% 300 3-Person 223 2 0% 141 4-Person 26 0.2% 62 5-Person 0 0.0% 0 6-Person 0 0.0% 0 7+ Person 0 0.0% 0 HOUSEHOLDS BY PRESENCE OF PEOPLE UNDER 18 YEARS BY HOUSEHOLD TYPE Households with one or more people under 18 years 3,548 31.9% 369 Family households 3,540 31.9% 369 Married-couple family 2,497 22.5% 320 Male householder, no wife present 321 2.9% 98 Female householder, no husband present 722 6.5% 347 Nonfamily households 8 0.1% 19 Households with no people under 18 years 7,566 68.1% 562 Married-couple family 2,836 25.5% 367 Other family 678 6.1% 196 Nonfamily households 4,052 36.5% 516 HOUSEHOLDS BY PRESENCE OF PEOPLE 65 YEARS AND OVER, HOUSEHOLD SIZE AND HOUSEHOLD TYPE Households with Pop 65+ 3,038 27.3% 360 1-Person 1,204 10.8% 298 2+ Person Family 1,706 15.4% 272 2+ Person Nonfamily 128 1.2% 83 Households with No Pop 65+ 8,075 72.7% 572 1-Person 1,699 15.3% 340 2+ Person Family 5,348 48.1% 467 2+ Person Nonfamily 1,028 9.3% 319 HOUSEHOLD TYPE
RELATIVES AND NONRELATIVES
POPULATION IN HOUSEHOLDS POPULATION IN HOUSEHOLDS Total 29,038 100.0% 1,611 In Family Households 23,398 80 6% 1,603 In Married-Couple Family 17,678 60 9% 1,635 Relatives 17,476 60 2% 1,604 Nonrelatives 201 0.7% 114 In Male Householder-No Spouse Present-Family 1,620 5.6% 433 Relatives 1,117 3 8% 311 Nonrelatives 502 1.7% 155 In Female Householder-No Spouse Present-Family 4,101 14 1% 1,213 Relatives 3,692 12.7% 1,043 Nonrelatives 409 1 4% 279 In Nonfamily Households 5,640 19 4% 844 Source: U.S. Census Bureau, 2017-2021 American Community Survey Reliability: high medium low August 28, 2023 ©2023 Esri Page 10 of 24
BY
FOR
ACS Population Summary
1520 NW 6th St, Redmond, Oregon, 97756 Prepared by Esri Ring: 3 mile radius Latitude: 44.29027 Longitude: -121.17359 2017-2021 ACS Estimate Percent MOE(±) Reliability POPULATION AGE 5+ YEARS BY LANGUAGE SPOKEN AT HOME AND ABILITY TO SPEAK ENGLISH Total 27,574 100.0% 1,557 5 to 17 years Speak only English 4,221 15 3% 593 Speak Spanish 879 3.2% 435 Speak English "very well" or "well" 767 2.8% 399 Speak English "not well" 112 0.4% 113 Speak English "not at all" 0 0 0% 0 Speak other Indo-European languages 0 0.0% 0 Speak English "very well" or "well" 0 0.0% 0 Speak English "not well" 0 0.0% 0 Speak English "not at all" 0 0 0% 0 Speak Asian and Pacific Island languages 19 0.1% 35 Speak English "very well" or "well" 0 0.0% 0 Speak English "not well" 19 0.1% 35 Speak English "not at all" 0 0 0% 0 Speak other languages 0 0.0% 0 Speak English "very well" or "well" 0 0.0% 0 Speak English "not well" 0 0.0% 0 Speak English "not at all" 0 0 0% 0 18 to 64 years Speak only English 16,073 58.3% 1,119 Speak Spanish 1,872 6.8% 475 Speak English "very well" or "well" 1,391 5 0% 460 Speak English "not well" 419 1.5% 258 Speak English "not at all" 62 0 2% 122 Speak other Indo-European languages 326 1.2% 170 Speak English "very well" or "well" 326 1 2% 170 Speak English "not well" 0 0.0% 0 Speak English "not at all" 0 0 0% 0 Speak Asian and Pacific Island languages 85 0.3% 59 Speak English "very well" or "well" 74 0.3% 52 Speak English "not well" 11 0.0% 26 Speak English "not at all" 0 0 0% 0 Speak other languages 0 0.0% 0 Speak English "very well" or "well" 0 0.0% 0 Speak English "not well" 0 0.0% 0 Speak English "not at all" 0 0 0% 0 65 years and over Speak only English 3,778 13 7% 420 Speak Spanish 124 0.4% 94 Speak English "very well" or "well" 41 0.1% 60 Speak English "not well" 31 0.1% 49 Speak English "not at all" 52 0 2% 78 Speak other Indo-European languages 190 0.7% 204 Speak English "very well" or "well" 190 0 7% 210 Speak English "not well" 0 0.0% 0 Speak English "not at all" 0 0 0% 0 Speak Asian and Pacific Island languages 7 0.0% 13 Speak English "very well" or "well" 7 0.0% 13 Speak English "not well" 0 0.0% 0 Speak English "not at all" 0 0 0% 0 Speak other languages 0 0.0% 0 Speak English "very well" or "well" 0 0.0% 0 Speak English "not well" 0 0.0% 0 Speak English "not at all" 0 0 0% 0 Source: U.S. Census Bureau, 2017-2021 American Community Survey Reliability: high medium low August 28, 2023 ©2023 Esri Page 11 of 24
1520 NW 6th St, Redmond, Oregon, 97756 Prepared by Esri Ring: 3 mile radius Latitude: 44.29027 Longitude: -121.17359 2017-2021 ACS Estimate Percent MOE(±) Reliability WORKERS AGE 16+ YEARS BY PLACE OF WORK Total 14,303 100.0% 1,014 Worked in state and in county of residence 13,236 92.5% 1,001 Worked in state and outside county of residence 958 6 7% 316 Worked outside state of residence 109 0.8% 54 SEX BY CLASS OF WORKER FOR THE CIVILIAN EMPLOYED POPULATION 16 YEARS AND OVER Total: 14,660 100.0% 1,035 Male: 7,412 50 6% 660 Employee of private company workers 5,284 36 0% 638 Self-employed in own incorporated business workers 521 3.6% 213 Private not-for-profit wage and salary workers 236 1.6% 115 Local government workers 291 2.0% 142 State government workers 155 1 1% 100 Federal government workers 199 1.4% 98 Self-employed in own not incorporated business workers 726 5 0% 302 Unpaid family workers 0 0.0% 0 Female: 7,248 49 4% 618 Employee of private company workers 4,416 30 1% 548 Self-employed in own incorporated business workers 373 2 5% 156 Private not-for-profit wage and salary workers 1,139 7.8% 279 Local government workers 629 4.3% 209 State government workers 179 1.2% 116 Federal government workers 97 0.7% 51 Self-employed in own not incorporated business workers 396 2.7% 139 Unpaid family workers 19 0 1% 24 POPULATION IN HOUSEHOLDS AND PRESENCE OF A COMPUTER Total 29,038 100.0% 1,611 Population <18 in Households 6,714 23 1% 703 Have a Computer 6,605 22 7% 699 Have NO Computer 109 0.4% 147 Population 18-64 in Households 18,280 63 0% 1,207 Have a Computer 18,030 62 1% 1,216 Have NO Computer 250 0.9% 165 Population 65+ in Households 4,044 13 9% 470 Have a Computer 3,868 13.3% 461 Have NO Computer 176 0 6% 101 HOUSEHOLDS AND INTERNET SUBSCRIPTIONS Total 11,113 100.0% 579 With an Internet Subscription 10,237 92.1% 578 Dial-Up Alone 65 0 6% 53 Broadband 8,043 72 4% 599 Satellite Service 1,190 10 7% 319 Other Service 55 0 5% 40 Internet Access with no Subscription 125 1.1% 63 With No Internet Access 751 6 8% 240 Source: U.S. Census Bureau, 2017-2021 American Community Survey Reliability: high medium low August 28, 2023 ©2023 Esri Page 12 of 24
ACS Population Summary
ACS Population Summary
1520 NW 6th St, Redmond, Oregon, 97756 Prepared by Esri Ring: 3 mile radius Latitude: 44.29027 Longitude: -121.17359 2017-2021 ACS Estimate Percent MOE(±) Reliability WORKERS AGE 16+ YEARS BY MEANS OF TRANSPORTATION TO WORK Total 14,303 100.0% 1,014 Drove alone 11,016 77 0% 947 Carpooled 1,477 10 3% 261 Public transportation (excluding taxicab) 107 0.7% 107 Bus or trolley bus 107 0 7% 107 Light rail, streetcar or trolley 0 0.0% 0 Subway or elevated 0 0.0% 0 Long-distance/Commuter Train 0 0.0% 0 Ferryboat 0 0.0% 0 Taxicab 35 0.2% 47 Motorcycle 15 0.1% 25 Bicycle 29 0.2% 33 Walked 221 1 5% 111 Other means 186 1.3% 232 Worked at home 1,218 8 5% 297
AGE
BY TRAVEL TIME TO WORK Total 13,086 100.0% 975 Less than 5 minutes 538 4.1% 193 5 to 9 minutes 2,245 17.2% 450 10 to 14 minutes 2,254 17 2% 393 15 to 19 minutes 1,125 8 6% 268 20 to 24 minutes 1,583 12 1% 384 25 to 29 minutes 1,749 13 4% 593 30 to 34 minutes 2,294 17.5% 400 35 to 39 minutes 329 2 5% 152 40 to 44 minutes 357 2.7% 116 45 to 59 minutes 284 2 2% 143 60 to 89 minutes 163 1.2% 126 90 or more minutes 164 1 3% 104 Average Travel Time to Work (in minutes) N/A N/A
20-64 YEARS
AGE OF OWN CHILDREN AND EMPLOYMENT STATUS Total 9,409 100.0% 680 Own children under 6 years only 1,018 10.8% 357 In labor force 832 8 8% 348 Not in labor force 186 2.0% 109 Own children under 6 years and 6 to 17 years 489 5 2% 167 In labor force 320 3.4% 153 Not in labor force 169 1 8% 110 Own children 6 to 17 years only 1,941 20.6% 307 In labor force 1,612 17 1% 280 Not in labor force 329 3.5% 128 No own children under 18 years 5,962 63 4% 623 In labor force 4,663 49.6% 587 Not in labor force 1,299 13 8% 238 Source: U.S. Census Bureau, 2017-2021 American Community Survey Reliability: high medium low August 28, 2023 ©2023 Esri Page 13 of 24
WORKERS
16+ YEARS (WHO DID NOT WORK FROM HOME)
FEMALES AGE
BY
1520 NW 6th St, Redmond, Oregon, 97756 Prepared by Esri Ring: 3 mile radius Latitude: 44.29027 Longitude: -121.17359 2017-2021 ACS Estimate Percent MOE(±) Reliability CIVILIAN NONINSTITUTIONALIZED POPULATION BY AGE & TYPES OHEALINSURANCE COVERAGE OF HEALTH INSURANCE COVERAGE Total 29,132 100.0% 1,617 Under 19 years: 7,067 24 3% 724 One Type of Health Insurance: 6,620 22 7% 686 Employer-Based Health Ins Only 2,115 7.3% 514 Direct-Purchase Health Ins Only 524 1 8% 272 Medicare Coverage Only 0 0.0% 0 Medicaid Coverage Only 3,792 13 0% 553 TRICARE/Military Hlth Cov Only 189 0.6% 168 VA Health Care Only 0 0.0% 0 2+ Types of Health Insurance 352 1.2% 196 No Health Insurance Coverage 95 0.3% 79 19 to 34 years: 6,290 21.6% 862 One Type of Health Insurance: 4,977 17.1% 645 Employer-Based Health Ins Only 3,238 11 1% 542 Direct-Purchase Health Ins Only 451 1 5% 275 Medicare Coverage Only 0 0.0% 0 Medicaid Coverage Only 1,208 4 1% 323 TRICARE/Military Hlth Cov Only 74 0.3% 49 VA Health Care Only 6 0 0% 15 2+ Types of Health Insurance 668 2.3% 342 No Health Insurance Coverage 644 2 2% 295 35 to 64 years: 11,699 40 2% 881 One Type of Health Insurance: 8,458 29 0% 786 Employer-Based Health Ins Only 5,323 18 3% 641 Direct-Purchase Health Ins Only 1,196 4 1% 320 Medicare Coverage Only 211 0.7% 91 Medicaid Coverage Only 1,558 5 3% 348 TRICARE/Military Hlth Cov Only 94 0.3% 64 VA Health Care Only 75 0 3% 50 2+ Types of Health Insurance 1,871 6.4% 431 No Health Insurance Coverage 1,370 4.7% 344 65+ years: 4,076 14.0% 470 One Type of Health Insurance: 1,213 4.2% 270 Employer-Based Health Ins Only 58 0.2% 56 Direct-Purchase Health Ins Only 0 0.0% 0 Medicare Coverage Only 1,155 4.0% 267 TRICARE/Military Hlth Cov Only 0 0 0% 0 VA Health Care Only 0 0.0% 0 2+ Types of Health Insurance: 2,856 9 8% 437 Employer-Based & Direct-Purchase Health Insurance 0 0.0% 0 Employer-Based Health & Medicare Insurance 389 1 3% 150 Direct-Purchase Health & Medicare Insurance 1,306 4.5% 383 Medicare & Medicaid Coverage 257 0 9% 135 Other Private Health Insurance Combos 0 0.0% 0 Other Public Health Insurance Combos 47 0.2% 28 Other Health Insurance Combinations 857 2.9% 184 No Health Insurance Coverage 7 0.0% 13 Source: U.S. Census Bureau, 2017-2021 American Community Survey Reliability: high medium low August 28, 2023 ©2023 Esri Page 14 of 24
ACS Population Summary
ACS Population Summary
CIVILIAN POPULATION AGE 18 OR OLDER BY VETERAN STATUS
CIVILIAN VETERANS AGE 18 OR OLDER BY PERIOD OF MILITARY SERVICE
1520 NW 6th St, Redmond, Oregon, 97756 Prepared by Esri Ring: 3 mile radius Latitude: 44.29027 Longitude: -121.17359 2017-2021 ACS Estimate Percent MOE(±) Reliability POPULATION BY RATIO OF INCOME TO POVERTY LEVEL Total 29,044 100.0% 1,614 Under 50 1,205 4.1% 418 50 to 99 1,355 4 7% 305 1 00 to 1 24 1,148 4.0% 625 1 25 to 1 49 2,539 8 7% 953 1 50 to 1 84 2,089 7.2% 641 1 85 to 1 99 610 2 1% 528 2 00 and over 20,098 69 2% 1,441
Total 22,447 100.0% 1,234 Veteran 1,825 8.1% 343 Nonveteran 20,622 91.9% 1,117 Male 10,282 45 8% 718 Veteran 1,626 7 2% 329 Nonveteran 8,656 38 6% 649 Female 12,165 54.2% 741 Veteran 199 0.9% 106 Nonveteran 11,966 53 3% 740
Total 1,825 100.0% 343 Gulf War (9/01 or later), no Gulf War (8/90 to 8/01), no Vietnam Era 383 21 0% 228 Gulf War (9/01 or later) and Gulf War (8/90 to 8/01), no Vietnam Era 51 2.8% 40 Gulf War (9/01 or later), and Gulf War (8/90 to 8/01), and Vietnam Era 0 0.0% 0 Gulf War (8/90 to 8/01), no Vietnam Era 243 13.3% 135 Gulf War (8/90 to 8/01) and Vietnam Era 0 0.0% 0 Vietnam Era, no Korean War, no World War II 536 29 4% 135 Vietnam Era and Korean War, no World War II 0 0.0% 1 Vietnam Era and Korean War and World War II 0 0.0% 0 Korean War, no Vietnam Era, no World War II 48 2.6% 32 Korean War and World War II, no Vietnam Era 0 0 0% 0 World War II, no Korean War, no Vietnam Era 15 0.8% 58 Between Gulf War and Vietnam Era only 482 26 4% 197 Between Vietnam Era and Korean War only 67 3.7% 43 Between Korean War and World War II only 0 0.0% 0 Pre-World War II only 0 0.0% 0 HOUSEHOLDS BY
STATUS Total 11,113 100.0% 579 Income in the past 12 months below poverty level 1,141 10.3% 267 Married-couple family 146 1 3% 71 Other family - male householder (no wife present) 52 0.5% 79 Other family - female householder (no husband present) 193 1 7% 98 Nonfamily household - male householder 270 2.4% 159 Nonfamily household - female householder 480 4.3% 188 Income in the past 12 months at or above poverty level 9,972 89 7% 564 Married-couple family 5,187 46 7% 488 Other family - male householder (no wife present) 370 3.3% 111 Other family - female householder (no husband present) 1,105 9.9% 386 Nonfamily household - male householder 1,109 10.0% 280 Nonfamily household - female householder 2,200 19 8% 406 Poverty Index 83 Source: U.S. Census Bureau, 2017-2021 American Community Survey Reliability: high medium low August 28, 2023 ©2023 Esri Page 15 of 24
POVERTY
ACS Population Summary
Data Note: N/A means not available Population by Ratio of Income to Poverty Level represents persons for whom poverty status is determined. Household income represents income in 2021, adjusted for inflation
2017-2021 ACS Estimate: The American Community Survey (ACS) replaces census sample data. Esri is releasing the 2017-2021 ACS estimates, five-year period data collected monthly from January 1, 2017 through December 31, 2021. Although the ACS includes many of the subjects previously covered by the decennial census sample, there are significant differences between the two surveys including fundamental differences in survey design and residency rules
Margin of error (MOE): The MOE is a measure of the variability of the estimate due to sampling error. MOEs enable the data user to measure the range of uncertainty for each estimate with 90 percent confidence. The range of uncertainty is called the confidence interval, and it is calculated by taking the estimate +/- the MOE. For example, if the ACS reports an estimate of 100 with an MOE of +/- 20, then you can be 90 percent certain the value for the whole population falls between 80 and 120.
Reliability: These symbols represent threshold values that Esri has established from the Coefficients of Variation (CV) to designate the usability of the estimates. The CV measures the amount of sampling error relative to the size of the estimate, expressed as a percentage
High Reliability: Small CVs (less than or equal to 12 percent) are flagged green to indicate that the sampling error is small relative to the estimate and the estimate is reasonably reliable.
Medium Reliability: Estimates with CVs between 12 and 40 are flagged yellow-use with caution.
Low Reliability: Large CVs (over 40 percent) are flagged red to indicate that the sampling error is large relative to the estimate. The estimate is considered very unreliable.
Source: U.S. Census Bureau, 2017-2021 American Community Survey
Reliability: high medium low
1520 NW 6th St, Redmond, Oregon, 97756 Prepared by Esri Ring: 3 mile radius Latitude: 44.29027 Longitude: -121.17359 2017-2021 ACS Estimate Percent MOE(±) Reliability HOUSEHOLDS BY OTHER INCOME Social Security Income 3,626 32 6% 417 No Social Security Income 7,488 67.4% 563 Retirement Income 2,266 20 4% 305 No Retirement Income 8,847 79 6% 592 GROSS RENT AS A PERCENTAGE OF HOUSEHOLD INCOME IN THE PAST 12 MONTHS <10% of Income 142 3 9% 125 10-14 9% of Income 283 7.7% 108 15-19 9% of Income 562 15 3% 238 20-24 9% of Income 382 10 4% 152 25-29.9% of Income 460 12.6% 190 30-34 9% of Income 295 8.1% 106 35-39 9% of Income 387 10 6% 271 40-49 9% of Income 295 8.1% 175 50+% of Income 811 22 1% 229 Gross Rent % Inc Not Computed 45 1.2% 41 HOUSEHOLDS BY PUBLIC ASSISTANCE INCOME IN THE PAST 12 MONTHS Total 11,113 100.0% 579 With public assistance income 382 3.4% 151 No public assistance income 10,731 96.6% 583 HOUSEHOLDS BY FOOD STAMPS/SNAP STATUS Total 11,113 100.0% 579 With Food Stamps/SNAP 1,792 16.1% 287 With No Food Stamps/SNAP 9,322 83.9% 562 HOUSEHOLDS BY DISABILITY STATUS Total 11,113 100.0% 579 With 1+ Persons w/Disability 3,123 28.1% 390 With No Person w/Disability 7,991 71.9% 613
August 28, 2023 ©2023 Esri Page 16 of 24
ACS Population Summary
1520 NW 6th St, Redmond, Oregon, 97756 Prepared by Esri Ring: 5 mile radius Latitude: 44.29027 Longitude: -121.17359 2017-2021 ACS Estimate Percent MOE(±) Reliability TOTALS Total Population 40,308 2,422 Total Households 15,587 790 Total Housing Units 16,021 802 POPULATION AGE 3+ YEARS BY SCHOOL ENROLLMENT Total 39,034 100.0% 2,357 Enrolled in school 8,203 21 0% 998 Enrolled in nursery school, preschool 599 1 5% 242 Public school 357 0.9% 192 Private school 242 0 6% 150 Enrolled in kindergarten 247 0.6% 179 Public school 236 0 6% 179 Private school 11 0.0% 23 Enrolled in grade 1 to grade 4 1,894 4.9% 528 Public school 1,450 3.7% 427 Private school 444 1 1% 320 Enrolled in grade 5 to grade 8 2,149 5.5% 413 Public school 1,908 4 9% 385 Private school 241 0.6% 145 Enrolled in grade 9 to grade 12 1,883 4 8% 446 Public school 1,741 4.5% 436 Private school 142 0 4% 97 Enrolled in college undergraduate years 1,248 3.2% 306 Public school 1,098 2.8% 290 Private school 150 0.4% 102 Enrolled in graduate or professional school 183 0 5% 82 Public school 55 0.1% 50 Private school 128 0 3% 66 Not enrolled in school 30,831 79.0% 1,436 POPULATION AGE 65+ BY RELATIONSHIP AND HOUSEHOLD TYPE Total 6,974 100.0% 608 Living in Households 6,855 98 3% 605 Living in Family Households 4,814 69 0% 553 Householder 2,483 35 6% 300 Spouse 1,864 26 7% 252 Parent 45 0.6% 38 Parent-in-law 126 1 8% 129 Other Relative 211 3.0% 101 Nonrelative 85 1.2% 82 Living in Nonfamily Households 2,041 29 3% 348 Householder 1,917 27.5% 330 Nonrelative 124 1.8% 86 Living in Group Quarters 119 1 7% 73 Source: U.S. Census Bureau, 2017-2021 American Community Survey Reliability: high medium low August 28, 2023 ©2023 Esri Page 17 of 24
ACS Population Summary
1520 NW 6th St, Redmond, Oregon, 97756 Prepared by Esri Ring: 5 mile radius Latitude: 44.29027 Longitude: -121.17359 2017-2021 ACS Estimate Percent MOE(±) Reliability HOUSEHOLDS BY TYPE AND SIZE Family Households 10,184 65.3% 701 2-Person 4,343 27.9% 463 3-Person 2,743 17 6% 490 4-Person 1,699 10 9% 425 5-Person 812 5 2% 256 6-Person 452 2.9% 217 7+ Person 135 0.9% 98 Nonfamily Households 5,404 34 7% 601 1-Person 3,901 25 0% 485 2-Person 1,188 7.6% 358 3-Person 262 1 7% 168 4-Person 52 0.3% 67 5-Person 0 0.0% 0 6-Person 0 0.0% 0 7+ Person 0 0.0% 0 HOUSEHOLDS BY PRESENCE OF PEOPLE UNDER 18 YEARS BY HOUSEHOLD TYPE Households with one or more people under 18 years 4,598 29.5% 569 Family households 4,574 29.3% 569 Married-couple family 3,208 20.6% 531 Male householder, no wife present 516 3.3% 186 Female householder, no husband present 849 5.4% 357 Nonfamily households 24 0.2% 46 Households with no people under 18 years 10,989 70.5% 693 Married-couple family 4,653 29.9% 464 Other family 957 6.1% 291 Nonfamily households 5,379 34.5% 601 HOUSEHOLDS BY PRESENCE OF PEOPLE 65 YEARS AND OVER, HOUSEHOLD SIZE AND HOUSEHOLD TYPE Households with Pop 65+ 4,864 31.2% 429 1-Person 1,713 11.0% 313 2+ Person Family 2,944 18.9% 340 2+ Person Nonfamily 208 1.3% 136 Households with No Pop 65+ 10,723 68.8% 790 1-Person 2,188 14.0% 396 2+ Person Family 7,240 46.4% 690 2+ Person Nonfamily 1,295 8.3% 378 HOUSEHOLD TYPE BY RELATIVES AND NONRELATIVES FOR POPULATION IN HOUSEHOLDS POPULATION IN HOUSEHOLDS Total 40,088 100.0% 2,417 In Family Households 32,632 81 4% 2,416 In Married-Couple Family 25,075 62 5% 2,395 Relatives 24,700 61 6% 2,369 Nonrelatives 375 0.9% 135 In Male Householder-No Spouse Present-Family 2,339 5.8% 772 Relatives 1,681 4 2% 519 Nonrelatives 659 1.6% 368 In Female Householder-No Spouse Present-Family 5,218 13 0% 1,402 Relatives 4,751 11.9% 1,256 Nonrelatives 466 1 2% 284 In Nonfamily Households 7,456 18 6% 1,019 Source: U.S. Census Bureau, 2017-2021 American Community Survey Reliability: high medium low August 28, 2023 ©2023 Esri Page 18 of 24
ACS Population Summary
1520 NW 6th St, Redmond, Oregon, 97756 Prepared by Esri Ring: 5 mile radius Latitude: 44.29027 Longitude: -121.17359 2017-2021 ACS Estimate Percent MOE(±) Reliability POPULATION AGE 5+ YEARS BY LANGUAGE SPOKEN AT HOME AND ABILITY TO SPEAK ENGLISH Total 38,245 100.0% 2,305 5 to 17 years Speak only English 5,414 14 2% 929 Speak Spanish 1,034 2.7% 464 Speak English "very well" or "well" 922 2.4% 431 Speak English "not well" 112 0.3% 113 Speak English "not at all" 0 0 0% 0 Speak other Indo-European languages 0 0.0% 0 Speak English "very well" or "well" 0 0.0% 0 Speak English "not well" 0 0.0% 0 Speak English "not at all" 0 0 0% 0 Speak Asian and Pacific Island languages 19 0.0% 35 Speak English "very well" or "well" 0 0.0% 0 Speak English "not well" 19 0.0% 35 Speak English "not at all" 0 0 0% 0 Speak other languages 0 0.0% 0 Speak English "very well" or "well" 0 0.0% 0 Speak English "not well" 0 0.0% 0 Speak English "not at all" 0 0 0% 0 18 to 64 years Speak only English 22,076 57.7% 1,600 Speak Spanish 2,165 5.7% 627 Speak English "very well" or "well" 1,536 4 0% 529 Speak English "not well" 531 1.4% 316 Speak English "not at all" 98 0 3% 122 Speak other Indo-European languages 449 1.2% 231 Speak English "very well" or "well" 449 1 2% 230 Speak English "not well" 0 0.0% 0 Speak English "not at all" 0 0 0% 0 Speak Asian and Pacific Island languages 114 0.3% 87 Speak English "very well" or "well" 97 0.3% 76 Speak English "not well" 17 0.0% 27 Speak English "not at all" 0 0 0% 0 Speak other languages 0 0.0% 0 Speak English "very well" or "well" 0 0.0% 0 Speak English "not well" 0 0.0% 0 Speak English "not at all" 0 0 0% 0 65 years and over Speak only English 6,497 17 0% 564 Speak Spanish 221 0.6% 119 Speak English "very well" or "well" 136 0 4% 90 Speak English "not well" 33 0.1% 49 Speak English "not at all" 52 0 1% 78 Speak other Indo-European languages 190 0.5% 204 Speak English "very well" or "well" 190 0 5% 210 Speak English "not well" 0 0.0% 0 Speak English "not at all" 0 0 0% 0 Speak Asian and Pacific Island languages 66 0.2% 53 Speak English "very well" or "well" 52 0.1% 67 Speak English "not well" 15 0.0% 37 Speak English "not at all" 0 0 0% 0 Speak other languages 0 0.0% 0 Speak English "very well" or "well" 0 0.0% 0 Speak English "not well" 0 0.0% 0 Speak English "not at all" 0 0 0% 0 Source: U.S. Census Bureau, 2017-2021 American Community Survey Reliability: high medium low August 28, 2023 ©2023 Esri Page 19 of 24
1520 NW 6th St, Redmond, Oregon, 97756 Prepared by Esri Ring: 5 mile radius Latitude: 44.29027 Longitude: -121.17359 2017-2021 ACS Estimate Percent MOE(±) Reliability WORKERS AGE 16+ YEARS BY PLACE OF WORK Total 19,526 100.0% 1,435 Worked in state and in county of residence 17,839 91.4% 1,426 Worked in state and outside county of residence 1,451 7 4% 362 Worked outside state of residence 236 1.2% 99 SEX BY CLASS OF WORKER FOR THE CIVILIAN EMPLOYED POPULATION 16 YEARS AND OVER Total: 19,901 100.0% 1,454 Male: 10,283 51 7% 870 Employee of private company workers 7,152 35 9% 828 Self-employed in own incorporated business workers 885 4.4% 241 Private not-for-profit wage and salary workers 361 1.8% 123 Local government workers 369 1.9% 143 State government workers 237 1 2% 107 Federal government workers 244 1.2% 146 Self-employed in own not incorporated business workers 1,033 5 2% 407 Unpaid family workers 3 0.0% 25 Female: 9,618 48 3% 896 Employee of private company workers 5,864 29 5% 798 Self-employed in own incorporated business workers 502 2 5% 179 Private not-for-profit wage and salary workers 1,357 6.8% 389 Local government workers 917 4.6% 280 State government workers 283 1.4% 125 Federal government workers 103 0 5% 86 Self-employed in own not incorporated business workers 565 2.8% 224 Unpaid family workers 28 0 1% 26 POPULATION IN HOUSEHOLDS AND PRESENCE OF A COMPUTER Total 40,088 100.0% 2,417 Population <18 in Households 8,530 21 3% 1,097 Have a Computer 8,416 21 0% 1,097 Have NO Computer 114 0.3% 149 Population 18-64 in Households 24,703 61 6% 1,694 Have a Computer 24,375 60 8% 1,701 Have NO Computer 328 0.8% 168 Population 65+ in Households 6,855 17 1% 605 Have a Computer 6,370 15.9% 596 Have NO Computer 485 1 2% 208 HOUSEHOLDS AND INTERNET SUBSCRIPTIONS Total 15,587 100.0% 790 With an Internet Subscription 14,297 91.7% 785 Dial-Up Alone 83 0 5% 81 Broadband 11,287 72 4% 789 Satellite Service 1,744 11 2% 360 Other Service 90 0 6% 60 Internet Access with no Subscription 195 1.3% 71 With No Internet Access 1,095 7 0% 273 Source: U.S. Census Bureau, 2017-2021 American Community Survey Reliability: high medium low August 28, 2023 ©2023 Esri Page 20 of 24
ACS Population Summary
ACS Population Summary
1520 NW 6th St, Redmond, Oregon, 97756 Prepared by Esri Ring: 5 mile radius Latitude: 44.29027 Longitude: -121.17359 2017-2021 ACS Estimate Percent MOE(±) Reliability
AGE 16+ YEARS BY MEANS OF TRANSPORTATION TO WORK Total 19,526 100.0% 1,435 Drove alone 14,666 75 1% 1,303 Carpooled 1,912 9 8% 445 Public transportation (excluding taxicab) 134 0.7% 131 Bus or trolley bus 134 0 7% 131 Light rail, streetcar or trolley 0 0.0% 0 Subway or elevated 0 0.0% 0 Long-distance/Commuter Train 0 0.0% 0 Ferryboat 0 0.0% 0 Taxicab 57 0.3% 81 Motorcycle 92 0.5% 104 Bicycle 141 0.7% 134 Walked 277 1 4% 117 Other means 202 1.0% 232 Worked at home 2,045 10 5% 410
WORKERS
BY TRAVEL TIME TO WORK Total 17,481 100.0% 1,364 Less than 5 minutes 844 4.8% 238 5 to 9 minutes 2,696 15.4% 539 10 to 14 minutes 2,932 16 8% 589 15 to 19 minutes 1,777 10 2% 327 20 to 24 minutes 2,277 13 0% 529 25 to 29 minutes 2,154 12 3% 703 30 to 34 minutes 2,925 16.7% 502 35 to 39 minutes 425 2 4% 168 40 to 44 minutes 535 3.1% 174 45 to 59 minutes 426 2 4% 154 60 to 89 minutes 272 1.6% 141 90 or more minutes 220 1 3% 121 Average Travel Time to Work (in minutes) N/A N/A
AGE 20-64 YEARS BY AGE OF OWN CHILDREN AND EMPLOYMENT STATUS Total 12,493 100.0% 973 Own children under 6 years only 1,249 10.0% 412 In labor force 1,044 8 4% 385 Not in labor force 204 1.6% 153 Own children under 6 years and 6 to 17 years 696 5 6% 292 In labor force 445 3.6% 227 Not in labor force 251 2 0% 185 Own children 6 to 17 years only 2,376 19.0% 494 In labor force 1,975 15 8% 461 Not in labor force 402 3.2% 179 No own children under 18 years 8,171 65 4% 851 In labor force 6,246 50.0% 795 Not in labor force 1,926 15 4% 351 Source: U.S. Census Bureau, 2017-2021 American Community Survey Reliability: high medium low August 28, 2023 ©2023 Esri Page 21 of 24
WORKERS AGE 16+ YEARS (WHO DID NOT WORK FROM HOME)
FEMALES
1520 NW 6th St, Redmond, Oregon, 97756 Prepared by Esri Ring: 5 mile radius Latitude: 44.29027 Longitude: -121.17359 2017-2021 ACS Estimate Percent MOE(±) Reliability CIVILIAN NONINSTITUTIONALIZED POPULATION BY AGE & TYPES OHEALINSURANCE COVERAGE OF HEALTH INSURANCE COVERAGE Total 40,220 100.0% 2,421 Under 19 years: 9,086 22 6% 1,134 One Type of Health Insurance: 8,359 20 8% 1,101 Employer-Based Health Ins Only 2,849 7.1% 626 Direct-Purchase Health Ins Only 681 1 7% 399 Medicare Coverage Only 0 0.0% 0 Medicaid Coverage Only 4,632 11 5% 875 TRICARE/Military Hlth Cov Only 196 0.5% 231 VA Health Care Only 0 0.0% 0 2+ Types of Health Insurance 596 1.5% 276 No Health Insurance Coverage 131 0.3% 99 19 to 34 years: 7,972 19.8% 1,042 One Type of Health Insurance: 6,367 15.8% 828 Employer-Based Health Ins Only 4,122 10 2% 663 Direct-Purchase Health Ins Only 594 1 5% 319 Medicare Coverage Only 0 0.0% 0 Medicaid Coverage Only 1,542 3 8% 425 TRICARE/Military Hlth Cov Only 96 0.2% 89 VA Health Care Only 13 0 0% 19 2+ Types of Health Insurance 830 2.1% 358 No Health Insurance Coverage 774 1 9% 324 35 to 64 years: 16,220 40 3% 1,361 One Type of Health Insurance: 11,723 29 1% 1,161 Employer-Based Health Ins Only 7,612 18 9% 1,020 Direct-Purchase Health Ins Only 1,669 4 1% 472 Medicare Coverage Only 217 0.5% 125 Medicaid Coverage Only 2,024 5 0% 474 TRICARE/Military Hlth Cov Only 109 0.3% 81 VA Health Care Only 93 0 2% 74 2+ Types of Health Insurance 2,519 6.3% 570 No Health Insurance Coverage 1,978 4.9% 518 65+ years: 6,942 17.3% 605 One Type of Health Insurance: 2,467 6.1% 396 Employer-Based Health Ins Only 100 0.2% 57 Direct-Purchase Health Ins Only 0 0.0% 0 Medicare Coverage Only 2,367 5.9% 393 TRICARE/Military Hlth Cov Only 0 0 0% 0 VA Health Care Only 0 0.0% 0 2+ Types of Health Insurance: 4,468 11 1% 513 Employer-Based & Direct-Purchase Health Insurance 0 0.0% 0 Employer-Based Health & Medicare Insurance 674 1 7% 166 Direct-Purchase Health & Medicare Insurance 1,849 4.6% 409 Medicare & Medicaid Coverage 369 0 9% 162 Other Private Health Insurance Combos 0 0.0% 0 Other Public Health Insurance Combos 142 0 4% 72 Other Health Insurance Combinations 1,433 3.6% 262 No Health Insurance Coverage 7 0.0% 13 Source: U.S. Census Bureau, 2017-2021 American Community Survey Reliability: high medium low August 28, 2023 ©2023 Esri Page 22 of 24
ACS Population Summary
ACS Population Summary
CIVILIAN POPULATION AGE 18 OR OLDER BY VETERAN STATUS
CIVILIAN VETERANS AGE 18 OR OLDER BY PERIOD OF MILITARY SERVICE
1520 NW 6th St, Redmond, Oregon, 97756 Prepared by Esri Ring: 5 mile radius Latitude: 44.29027 Longitude: -121.17359 2017-2021 ACS Estimate Percent MOE(±) Reliability POPULATION BY RATIO OF INCOME TO POVERTY LEVEL Total 40,060 100.0% 2,418 Under 50 1,596 4.0% 442 50 to 99 1,927 4 8% 610 1 00 to 1 24 1,546 3.9% 645 1 25 to 1 49 3,154 7 9% 1,167 1 50 to 1 84 2,688 6.7% 955 1 85 to 1 99 824 2 1% 536 2 00 and over 28,325 70 7% 2,181
Total 31,729 100.0% 1,709 Veteran 2,769 8.7% 439 Nonveteran 28,960 91.3% 1,604 Male 14,674 46 2% 959 Veteran 2,532 8 0% 393 Nonveteran 12,142 38 3% 907 Female 17,055 53.8% 1,054 Veteran 237 0.7% 188 Nonveteran 16,818 53 0% 1,039
Total 2,770 100.0% 439 Gulf War (9/01 or later), no Gulf War (8/90 to 8/01), no Vietnam Era 547 19 7% 296 Gulf War (9/01 or later) and Gulf War (8/90 to 8/01), no Vietnam Era 71 2.6% 46 Gulf War (9/01 or later), and Gulf War (8/90 to 8/01), and Vietnam Era 0 0.0% 0 Gulf War (8/90 to 8/01), no Vietnam Era 256 9.2% 137 Gulf War (8/90 to 8/01) and Vietnam Era 3 0.1% 20 Vietnam Era, no Korean War, no World War II 954 34 4% 187 Vietnam Era and Korean War, no World War II 4 0.1% 16 Vietnam Era and Korean War and World War II 0 0.0% 0 Korean War, no Vietnam Era, no World War II 158 5.7% 77 Korean War and World War II, no Vietnam Era 0 0 0% 0 World War II, no Korean War, no Vietnam Era 35 1.3% 60 Between Gulf War and Vietnam Era only 555 20 0% 242 Between Vietnam Era and Korean War only 188 6.8% 52 Between Korean War and World War II only 0 0.0% 0 Pre-World War II only 0 0.0% 0 HOUSEHOLDS BY POVERTY STATUS Total 15,587 100.0% 790 Income in the past 12 months below poverty level 1,500 9.6% 333 Married-couple family 220 1 4% 127 Other family - male householder (no wife present) 105 0.7% 92 Other family - female householder (no husband present) 266 1 7% 112 Nonfamily household - male householder 304 2.0% 173 Nonfamily household - female householder 604 3.9% 216 Income in the past 12 months at or above poverty level 14,088 90 4% 780 Married-couple family 7,641 49 0% 684 Other family - male householder (no wife present) 552 3.5% 187 Other family - female householder (no husband present) 1,399 9.0% 442 Nonfamily household - male householder 1,640 10.5% 328 Nonfamily household - female householder 2,855 18 3% 475 Poverty Index 78 Source: U.S. Census Bureau, 2017-2021 American Community Survey Reliability: high medium low August 28, 2023 ©2023 Esri Page 23 of 24
ACS Population Summary
Data Note: N/A means not available Population by Ratio of Income to Poverty Level represents persons for whom poverty status is determined. Household income represents income in 2021, adjusted for inflation
2017-2021 ACS Estimate: The American Community Survey (ACS) replaces census sample data. Esri is releasing the 2017-2021 ACS estimates, five-year period data collected monthly from January 1, 2017 through December 31, 2021. Although the ACS includes many of the subjects previously covered by the decennial census sample, there are significant differences between the two surveys including fundamental differences in survey design and residency rules
Margin of error (MOE): The MOE is a measure of the variability of the estimate due to sampling error. MOEs enable the data user to measure the range of uncertainty for each estimate with 90 percent confidence. The range of uncertainty is called the confidence interval, and it is calculated by taking the estimate +/- the MOE. For example, if the ACS reports an estimate of 100 with an MOE of +/- 20, then you can be 90 percent certain the value for the whole population falls between 80 and 120.
Reliability: These symbols represent threshold values that Esri has established from the Coefficients of Variation (CV) to designate the usability of the estimates. The CV measures the amount of sampling error relative to the size of the estimate, expressed as a percentage
High Reliability: Small CVs (less than or equal to 12 percent) are flagged green to indicate that the sampling error is small relative to the estimate and the estimate is reasonably reliable.
Medium Reliability: Estimates with CVs between 12 and 40 are flagged yellow-use with caution.
Low Reliability: Large CVs (over 40 percent) are flagged red to indicate that the sampling error is large relative to the estimate. The estimate is considered very unreliable.
Source: U.S. Census Bureau, 2017-2021 American Community Survey
Reliability: high medium low
1520 NW 6th St, Redmond, Oregon, 97756 Prepared by Esri Ring: 5 mile radius Latitude: 44.29027 Longitude: -121.17359 2017-2021 ACS Estimate Percent MOE(±) Reliability HOUSEHOLDS BY OTHER INCOME Social Security Income 5,615 36 0% 515 No Social Security Income 9,973 64.0% 760 Retirement Income 3,410 21 9% 392 No Retirement Income 12,177 78 1% 798 GROSS RENT AS A PERCENTAGE OF HOUSEHOLD INCOME IN THE PAST 12 MONTHS <10% of Income 146 3 1% 127 10-14 9% of Income 418 8.8% 226 15-19 9% of Income 606 12 8% 247 20-24 9% of Income 498 10 5% 189 25-29.9% of Income 517 10.9% 224 30-34 9% of Income 324 6.8% 154 35-39 9% of Income 428 9 0% 278 40-49 9% of Income 477 10 1% 187 50+% of Income 1,201 25 4% 288 Gross Rent % Inc Not Computed 117 2.5% 68 HOUSEHOLDS BY PUBLIC ASSISTANCE INCOME IN THE PAST 12 MONTHS Total 15,587 100.0% 790 With public assistance income 488 3.1% 174 No public assistance income 15,099 96.9% 793 HOUSEHOLDS BY FOOD STAMPS/SNAP STATUS Total 15,587 100.0% 790 With Food Stamps/SNAP 2,332 15.0% 369 With No Food Stamps/SNAP 13,256 85.0% 782 HOUSEHOLDS BY DISABILITY STATUS Total 15,587 100.0% 790 With 1+ Persons w/Disability 4,638 29.8% 532 With No Person w/Disability 10,949 70.2% 819
August 28, 2023 ©2023 Esri Page 24 of 24
Market Profile
Data Note: Household population includes persons not residing in group quarters. Average Household Size is the household population divided by total households. Persons in families include the householder and persons related to the householder by birth, marriage, or adoption. Per Capita Income represents the income received by all persons aged 15 years and over divided by the total population
Esri forecasts for 2023 and 2028 U.S. Census Bureau 2000 and 2010 decennial Census data converted by Esri into 2020 geography. August 28, 2023
1520 NW 6th St, Redmond, Oregon, 97756 Prepared by Esri Rings: 1, 3, 5 mile radii Latitude: 44.29027 Longitude: -121.17359 1 mile 3 miles 5 miles Population Summary 2010 Total Population 7,176 24,324 32,760 2020 Total Population 8,807 29,816 40,674 2020 Group Quarters 86 136 162 2023 Total Population 9,556 32,758 44,410 2023 Group Quarters 86 135 162 2028 Total Population 10,030 34,310 46,562 2023-2028 Annual Rate 0.97% 0.93% 0.95% 2023 Total Daytime Population 9,535 31,730 40,753 Workers 4,264 14,871 17,265 Residents 5,271 16,859 23,488 Household Summary 2010 Households 2,753 9,210 12,529 2010 Average Household Size 2.60 2.62 2.59 2020 Total Households 3,318 11,318 15,569 2020 Average Household Size 2.63 2.62 2.60 2023 Households 3,562 12,454 17,040 2023 Average Household Size 2.66 2.62 2.60 2028 Households 3,760 13,144 17,996 2028 Average Household Size 2.64 2.60 2.58 2023-2028 Annual Rate 1.09% 1.08% 1.10% 2010 Families 1,894 6,331 8,737 2010 Average Family Size 3.06 3.07 3.02 2023 Families 2,369 8,338 11,528 2023 Average Family Size 3.19 3.11 3.07 2028 Families 2,493 8,751 12,115 2028 Average Family Size 3.18 3.09 3.05 2023-2028 Annual Rate 1.03% 0.97% 1.00% Housing Unit Summary 2000 Housing Units 1,753 6,032 8,673 Owner Occupied Housing Units 66.9% 62.4% 65.9% Renter Occupied Housing Units 28.4% 32.8% 28.5% Vacant Housing Units 4.7% 4.8% 5.5% 2010 Housing Units 3,010 10,131 13,955 Owner Occupied Housing Units 56.2% 51.0% 54.9% Renter Occupied Housing Units 35.2% 39.9% 34.9% Vacant Housing Units 8.5% 9.1% 10.2% 2020 Housing Units 3,411 11,759 16,448 Vacant Housing Units 2.7% 3.8% 5.3% 2023 Housing Units 3,647 12,964 17,981 Owner Occupied Housing Units 72.4% 61.7% 65.8% Renter Occupied Housing Units 25.3% 34.3% 28.9% Vacant Housing Units 2.3% 3.9% 5.2% 2028 Housing Units 3,822 13,581 18,835 Owner Occupied Housing Units 74.1% 62.8% 67.0% Renter Occupied Housing Units 24.3% 34.0% 28.6% Vacant Housing Units 1.6% 3.2% 4.5% Median Household Income 2023 $73,053 $74,946 $75,971 2028 $85,039 $82,741 $84,672 Median Home Value 2023 $474,616 $454,552 $486,170 2028 $549,575 $522,824 $561,835 Per Capita Income 2023 $33,072 $33,208 $35,108 2028 $39,312 $38,730 $41,153 Median Age 2010 35.7 33.8 36.7 2023 38.0 35.8 38.7 2028 37.5 35.8 38.8
©2023 Esri Page 1 of 7
Source:
Market Profile
Data Note: Income represents the preceding year, expressed in current dollars. Household income includes wage and salary earnings, interest dividends, net rents, pensions, SSI and welfare payments, child support, and alimony.
Source: Esri forecasts for 2023 and 2028 U.S. Census Bureau 2000 and 2010 decennial Census data converted by Esri into 2020 geography.
1520 NW 6th St, Redmond, Oregon, 97756 Prepared by Esri Rings: 1, 3, 5 mile radii Latitude: 44.29027 Longitude: -121.17359 1 mile 3 miles 5 miles 2023 Households by Income Household Income Base 3,562 12,454 17,040 <$15,000 8.4% 6.2% 7.2% $15,000 - $24,999 4.9% 5.0% 5.4% $25,000 - $34,999 5.8% 5.6% 5.5% $35,000 - $49,999 15.4% 14.6% 13.2% $50,000 - $74,999 16.4% 18.6% 17.8% $75,000 - $99,999 16.8% 19.2% 18.2% $100,000 - $149,999 22.2% 21.3% 21.7% $150,000 - $199,999 6.1% 6.4% 7.1% $200,000+ 4.0% 3.0% 4.0% Average Household Income $88,345 $87,509 $91,063 2028 Households by Income Household Income Base 3,760 13,144 17,996 <$15,000 7.5% 5.4% 6.1% $15,000 - $24,999 3.7% 3.8% 3.8% $25,000 - $34,999 4.3% 4.2% 4.0% $35,000 - $49,999 12.0% 12.2% 11.1% $50,000 - $74,999 14.3% 16.8% 16.3% $75,000 - $99,999 17.2% 19.8% 18.5% $100,000 - $149,999 26.7% 24.7% 24.8% $150,000 - $199,999 8.9% 9.1% 10.1% $200,000+ 5.5% 4.1% 5.3% Average Household Income $104,424 $101,284 $105,954 2023 Owner Occupied Housing Units by Value Total 2,641 8,004 11,836 <$50,000 3.9% 3.0% 2.3% $50,000 - $99,999 0.7% 3.9% 2.8% $100,000 - $149,999 0.8% 1.6% 1.1% $150,000 - $199,999 2.2% 3.9% 2.8% $200,000 - $249,999 1.8% 3.6% 2.6% $250,000 - $299,999 4.3% 5.6% 4.4% $300,000 - $399,999 10.7% 14.9% 11.7% $400,000 - $499,999 34.5% 24.8% 25.7% $500,000 - $749,999 35.1% 32.8% 37.0% $750,000 - $999,999 5.3% 4.7% 7.0% $1,000,000 - $1,499,999 0.5% 0.6% 1.8% $1,500,000 - $1,999,999 0.4% 0.4% 0.4% $2,000,000 + 0.0% 0.1% 0.4% Average Home Value $493,525 $464,091 $512,595 2028 Owner Occupied Housing Units by Value Total 2,833 8,527 12,613 <$50,000 0.4% 0.2% 0.2% $50,000 - $99,999 0.0% 0.9% 0.6% $100,000 - $149,999 0.0% 0.0% 0.0% $150,000 - $199,999 0.0% 0.1% 0.1% $200,000 - $249,999 0.0% 0.3% 0.2% $250,000 - $299,999 0.0% 0.3% 0.2% $300,000 - $399,999 2.9% 13.2% 9.0% $400,000 - $499,999 36.5% 30.8% 27.7% $500,000 - $749,999 51.9% 44.2% 48.5% $750,000 - $999,999 6.5% 7.0% 8.9% $1,000,000 - $1,499,999 0.7% 1.3% 3.1% $1,500,000 - $1,999,999 1.1% 1.4% 1.2% $2,000,000 + 0.1% 0.2% 0.3% Average Home Value $585,166 $568,995 $605,810
©2023 Esri Page 2 of 7
August 28, 2023
Market Profile
1520 NW 6th St, Redmond, Oregon, 97756 Prepared by Esri Rings: 1, 3, 5 mile radii Latitude: 44.29027 Longitude: -121.17359 1 mile 3 miles 5 miles 2010 Population by Age Total 7,174 24,325 32,757 0 - 4 7.6% 8.1% 7.3% 5 - 9 7.8% 8.0% 7.3% 10 - 14 8.1% 7.7% 7.4% 15 - 24 11.7% 13.1% 12.3% 25 - 34 13.8% 15.0% 13.5% 35 - 44 13.6% 13.8% 13.4% 45 - 54 12.9% 12.3% 13.1% 55 - 64 11.0% 10.1% 11.6% 65 - 74 7.5% 6.3% 7.8% 75 - 84 4.3% 3.9% 4.4% 85 + 1.7% 1.9% 2.0% 18 + 71.9% 71.9% 73.7% 2023 Population by Age Total 9,556 32,756 44,411 0 - 4 6.6% 7.1% 6.4% 5 - 9 7.0% 7.3% 6.7% 10 - 14 6.8% 7.1% 6.6% 15 - 24 12.7% 13.0% 12.2% 25 - 34 12.8% 14.4% 13.2% 35 - 44 13.8% 14.1% 13.3% 45 - 54 12.2% 11.7% 11.8% 55 - 64 11.0% 10.5% 11.9% 65 - 74 9.8% 8.9% 10.7% 75 - 84 5.3% 4.4% 5.4% 85 + 2.0% 1.6% 1.8% 18 + 75.0% 74.3% 76.3% 2028 Population by Age Total 10,031 34,310 46,560 0 - 4 6.7% 7.2% 6.5% 5 - 9 7.0% 7.2% 6.6% 10 - 14 7.2% 7.4% 6.9% 15 - 24 11.8% 12.6% 11.6% 25 - 34 14.0% 14.4% 13.2% 35 - 44 13.0% 14.1% 13.3% 45 - 54 12.4% 11.7% 11.8% 55 - 64 10.2% 9.9% 11.0% 65 - 74 9.3% 8.6% 10.7% 75 - 84 6.2% 5.1% 6.3% 85 + 2.2% 1.7% 2.1% 18 + 74.7% 74.0% 76.1% 2010 Population by Sex Males 3,491 11,790 15,975 Females 3,685 12,534 16,786 2023 Population by Sex Males 4,651 16,013 21,781 Females 4,905 16,745 22,629 2028 Population by Sex Males 4,848 16,726 22,771 Females 5,182 17,584 23,791 Source: Esri forecasts for 2023 and 2028 U.S. Census Bureau 2000 and 2010 decennial Census data converted by Esri into 2020 geography. August 28, 2023 ©2023 Esri Page 3 of 7
Market Profile
Data Note: Persons of Hispanic Origin may be of any race The Diversity Index measures the probability that two people from the same area will be from different race/ ethnic groups
decennial
data converted by Esri into 2020 geography.
1520 NW 6th St, Redmond, Oregon, 97756 Prepared by Esri Rings: 1, 3, 5 mile radii Latitude: 44.29027 Longitude: -121.17359 1 mile 3 miles 5 miles 2010 Population by Race/Ethnicity Total 7,176 24,324 32,760 White Alone 90.6% 89.1% 90.1% Black Alone 0.4% 0.4% 0.4% American Indian Alone 1.1% 1.3% 1.2% Asian Alone 0.9% 0.8% 0.7% Pacific Islander Alone 0.2% 0.2% 0.2% Some Other Race Alone 4.2% 5.3% 4.7% Two or More Races 2.6% 3.0% 2.8% Hispanic Origin 11.1% 12.3% 10.9% Diversity Index 33.9 37.5 34.4 2020 Population by Race/Ethnicity Total 8,807 29,816 40,674 White Alone 81.1% 81.0% 82.5% Black Alone 0.4% 0.6% 0.5% American Indian Alone 1.2% 1.2% 1.1% Asian Alone 0.8% 1.1% 1.1% Pacific Islander Alone 0.1% 0.2% 0.2% Some Other Race Alone 6.0% 5.9% 5.1% Two or More Races 10.3% 10.0% 9.6% Hispanic Origin 14.2% 14.1% 12.5% Diversity Index 49.1 49.3 45.9 2023 Population by Race/Ethnicity Total 9,556 32,758 44,409 White Alone 80.3% 80.1% 81.7% Black Alone 0.4% 0.5% 0.5% American Indian Alone 1.3% 1.2% 1.1% Asian Alone 0.8% 1.2% 1.1% Pacific Islander Alone 0.1% 0.2% 0.1% Some Other Race Alone 6.3% 6.3% 5.4% Two or More Races 10.8% 10.5% 10.0% Hispanic Origin 15.0% 15.0% 13.3% Diversity Index 50.8 51.1 47.7 2028 Population by Race/Ethnicity Total 10,031 34,311 46,562 White Alone 79.0% 78.8% 80.5% Black Alone 0.4% 0.5% 0.5% American Indian Alone 1.3% 1.3% 1.2% Asian Alone 0.9% 1.2% 1.2% Pacific Islander Alone 0.1% 0.2% 0.2% Some Other Race Alone 6.9% 6.9% 5.9% Two or More Races 11.5% 11.2% 10.7% Hispanic Origin 16.0% 16.1% 14.3% Diversity Index 53.1 53.4 49.9 2010 Population by Relationship and Household Type Total 7,176 24,324 32,760 In Households 99.6% 99.2% 99.0% In Family Households 84.1% 83.6% 83.9% Householder 26.4% 26.0% 26.8% Spouse 19.5% 18.5% 20.0% Child 32.0% 32.2% 30.7% Other relative 2.9% 3.2% 3.1% Nonrelative 3.3% 3.6% 3.4% In Nonfamily Households 15.5% 15.6% 15.1% In Group Quarters 0.4% 0.8% 1.0% Institutionalized Population 0.0% 0.4% 0.5% Noninstitutionalized Population 0.4% 0.4% 0.4%
Source: Esri forecasts for 2023 and 2028 U.S. Census Bureau 2000
2010
August 28, 2023 ©2023 Esri Page 4 of 7
and
Census
Market Profile
1520 NW 6th St, Redmond, Oregon, 97756 Prepared by Esri Rings: 1, 3, 5 mile radii Latitude: 44.29027 Longitude: -121.17359 1 mile 3 miles 5 miles 2023 Population 25+ by Educational Attainment Total 6,388 21,476 30,248 Less than 9th Grade 2.5% 3.1% 3.0% 9th - 12th Grade, No Diploma 5.0% 5.5% 5.4% High School Graduate 24.9% 21.0% 22.8% GED/Alternative Credential 4.3% 4.3% 3.7% Some College, No Degree 28.5% 25.7% 25.0% Associate Degree 11.4% 13.3% 12.5% Bachelor's Degree 17.7% 19.6% 19.8% Graduate/Professional Degree 5.8% 7.6% 7.8% 2023 Population 15+ by Marital Status Total 7,602 25,730 35,655 Never Married 21.3% 28.7% 26.5% Married 55.0% 49.8% 52.4% Widowed 5.5% 5.1% 5.9% Divorced 18.1% 16.4% 15.2% 2023 Civilian Population 16+ in Labor Force Civilian Population 16+ 4,588 17,090 22,581 Population 16+ Employed 95.0% 94.6% 93.9% Population 16+ Unemployment rate 5.0% 5.4% 6.1% Population 16-24 Employed 12.3% 13.3% 12.2% Population 16-24 Unemployment rate 27.3% 20.4% 21.0% Population 25-54 Employed 70.0% 68.5% 67.4% Population 25-54 Unemployment rate 0.3% 2.8% 3.1% Population 55-64 Employed 13.1% 13.4% 14.7% Population 55-64 Unemployment rate 2.6% 2.7% 6.4% Population 65+ Employed 4.6% 4.9% 5.6% Population 65+ Unemployment rate 2.4% 0.8% 0.5% 2023 Employed Population 16+ by Industry Total 4,358 16,161 21,210 Agriculture/Mining 0.8% 1.2% 1.7% Construction 9.2% 13.0% 12.7% Manufacturing 3.2% 4.9% 5.3% Wholesale Trade 1.3% 1.3% 1.7% Retail Trade 17.6% 14.1% 15.0% Transportation/Utilities 9.9% 7.2% 5.9% Information 1.3% 1.2% 1.0% Finance/Insurance/Real Estate 3.6% 3.5% 3.1% Services 50.3% 50.5% 50.4% Public Administration 2.8% 3.0% 3.2% 2023 Employed Population 16+ by Occupation Total 4,359 16,160 21,207 White Collar 62.0% 57.7% 57.2% Management/Business/Financial 14.8% 14.9% 15.2% Professional 20.8% 19.6% 19.6% Sales 12.6% 9.4% 9.7% Administrative Support 13.8% 13.8% 12.7% Services 16.7% 18.0% 18.4% Blue Collar 21.4% 24.3% 24.4% Farming/Forestry/Fishing 0.0% 0.2% 0.2% Construction/Extraction 5.6% 8.2% 7.6% Installation/Maintenance/Repair 4.2% 3.0% 3.5% Production 4.1% 4.1% 3.7% Transportation/Material Moving 7.5% 8.9% 9.3% Source: Esri forecasts for 2023 and 2028 U.S. Census Bureau 2000 and 2010 decennial Census data converted by Esri into 2020 geography. August 28, 2023 ©2023 Esri Page 5 of 7
Market Profile
Data Note: Households with children include any households with people under age 18, related or not. Multigenerational households are families with 3 or more parentchild relationships. Unmarried partner households are usually classified as nonfamily households unless there is another member of the household related to the householder. Multigenerational and unmarried partner households are reported only to the tract level. Esri estimated block group data, which is used to estimate polygons or non-standard geography.
U.S.
Bureau 2000 and 2010 decennial Census data converted by Esri into 2020 geography.
28, 2023
1520 NW 6th St, Redmond, Oregon, 97756 Prepared by Esri Rings: 1, 3, 5 mile radii Latitude: 44.29027 Longitude: -121.17359 1 mile 3 miles 5 miles 2010 Households by Type Total 2,752 9,210 12,529 Households with 1 Person 23.9% 23.4% 23.0% Households with 2+ People 76.1% 76.6% 77.0% Family Households 68.8% 68.7% 69.7% Husband-wife Families 50.8% 49.0% 52.1% With Related Children 23.5% 23.5% 22.6% Other Family (No Spouse Present) 18.1% 19.7% 17.6% Other Family with Male Householder 5.4% 5.7% 5.2% With Related Children 3.9% 4.2% 3.8% Other Family with Female Householder 12.6% 14.0% 12.4% With Related Children 9.4% 10.6% 9.2% Nonfamily Households 7.3% 7.9% 7.3% All Households with Children 37.7% 39.1% 36.2% Multigenerational Households 3.1% 3.6% 3.4% Unmarried Partner Households 8.6% 9.3% 8.6% Male-female 8.0% 8.7% 7.9% Same-sex 0.6% 0.7% 0.6% 2010 Households by Size Total 2,752 9,210 12,530 1 Person Household 23.9% 23.4% 23.0% 2 Person Household 34.6% 34.1% 36.6% 3 Person Household 16.8% 17.1% 16.4% 4 Person Household 13.6% 13.9% 13.4% 5 Person Household 7.0% 7.4% 6.9% 6 Person Household 2.9% 2.8% 2.6% 7 + Person Household 1.2% 1.4% 1.2% 2010 Households by Tenure and Mortgage Status Total 2,753 9,211 12,529 Owner Occupied 61.5% 56.1% 61.2% Owned with a Mortgage/Loan 46.8% 44.2% 46.9% Owned Free and Clear 14.7% 11.8% 14.3% Renter Occupied 38.5% 43.9% 38.8% 2023 Affordability, Mortgage and Wealth Housing Affordability Index 63 68 64 Percent of Income for Mortgage 39.0% 36.4% 38.5% Wealth Index 67 62 72 2010 Housing Units By Urban/ Rural Status Total Housing Units 3,010 10,131 13,955 Housing Units Inside Urbanized Area 0.0% 0.0% 0.0% Housing Units Inside Urbanized Cluster 90.6% 91.5% 81.2% Rural Housing Units 9.4% 8.5% 18.8% 2010 Population By Urban/ Rural Status Total Population 7,176 24,324 32,760 Population Inside Urbanized Area 0.0% 0.0% 0.0% Population Inside Urbanized Cluster 90.6% 91.7% 82.9% Rural Population 9.4% 8.3% 17.1%
Source: Esri
for 2023 and
August
©2023 Esri Page 6 of 7
forecasts
2028
Census
Market Profile
Data Note: Consumer spending shows the amount spent on a variety of goods and services by households that reside in the area Expenditures are shown by broad budget categories that are not mutually exclusive. Consumer spending does not equal business revenue. Total and Average Amount Spent Per Household represent annual figures The Spending Potential Index represents the amount spent in the area relative to a national average of 100
Source: Consumer Spending data are derived from the 2019 and 2020 Consumer Expenditure Surveys, Bureau of Labor Statistics. Esri. Source: Esri forecasts for 2023 and 2028 U.S. Census Bureau 2000 and 2010 decennial Census data converted by Esri into 2020 geography. August 28, 2023
1520 NW 6th St, Redmond, Oregon, 97756 Prepared by Esri Rings: 1, 3, 5 mile radii Latitude: 44.29027 Longitude: -121.17359 1 mile 3 miles 5 miles Top 3 Tapestry Segments 1. Middleburg (4C) Middleburg (4C) Middleburg (4C) 2. Old and Newcomers (8F) Urban Edge Families (7C) The Great Outdoors (6C) 3. Down the Road (10D) Front Porches (8E) Urban Edge Families (7C) 2023 Consumer Spending Apparel & Services: Total $ $6,450,042 $22,526,192 $31,476,001 Average Spent $1,810.79 $1,808.75 $1,847.18 Spending Potential Index 82 82 84 Education: Total $ $4,729,453 $17,007,834 $24,218,589 Average Spent $1,327.75 $1,365.65 $1,421.28 Spending Potential Index 74 76 79 Entertainment/Recreation: Total $ $11,226,237 $38,440,318 $55,102,708 Average Spent $3,151.67 $3,086.58 $3,233.73 Spending Potential Index 83 82 86 Food at Home: Total $ $19,821,130 $69,323,878 $98,663,014 Average Spent $5,564.61 $5,566.39 $5,790.08 Spending Potential Index 82 82 85 Food Away from Home: Total $ $11,042,195 $38,575,660 $54,120,492 Average Spent $3,100.00 $3,097.45 $3,176.09 Spending Potential Index 83 83 85 Health Care: Total $ $22,456,475 $75,652,112 $109,164,684 Average Spent $6,304.46 $6,074.52 $6,406.38 Spending Potential Index 86 83 87 HH Furnishings & Equipment: Total $ $8,823,099 $30,367,166 $43,139,495 Average Spent $2,477.01 $2,438.35 $2,531.66 Spending Potential Index 84 83 86 Personal Care Products & Services: Total $ $2,829,851 $9,854,382 $13,908,484 Average Spent $794.46 $791.26 $816.23 Spending Potential Index 83 83 85 Shelter: Total $ $71,463,227 $253,166,340 $359,707,818 Average Spent $20,062.67 $20,328.11 $21,109.61 Spending Potential Index 81 82 85 Support Payments/Cash Contributions/Gifts in Kind: Total $ $9,520,103 $32,067,126 $46,436,576 Average Spent $2,672.68 $2,574.85 $2,725.15 Spending Potential Index 85 82 87 Travel: Total $ $6,712,197 $23,087,095 $32,882,492 Average Spent $1,884.39 $1,853.79 $1,929.72 Spending Potential Index 84 82 86 Vehicle Maintenance & Repairs: Total $ $3,994,803 $13,783,969 $19,584,117 Average Spent $1,121.51 $1,106.79 $1,149.30 Spending Potential Index 86 84 88
©2023 Esri Page 7 of 7

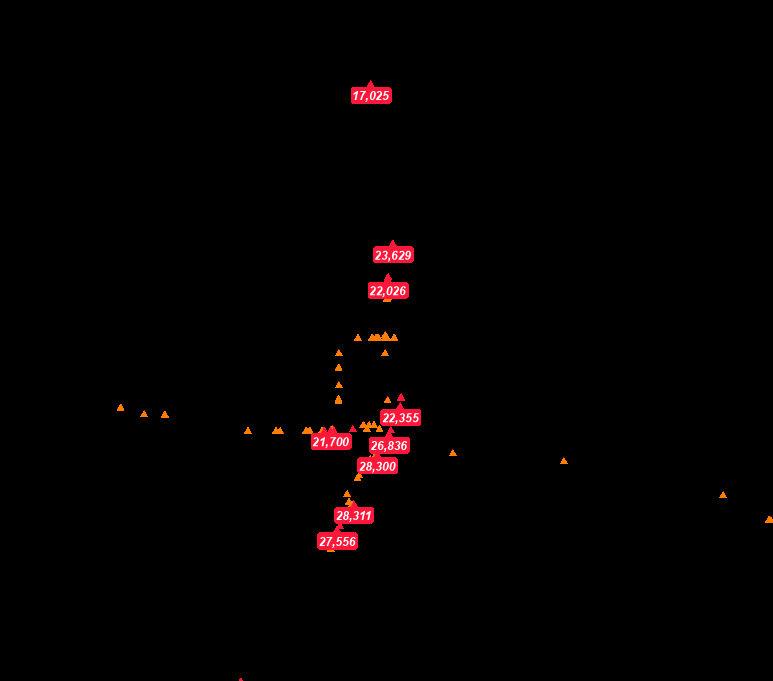
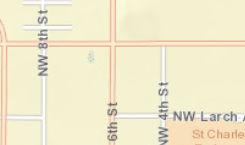
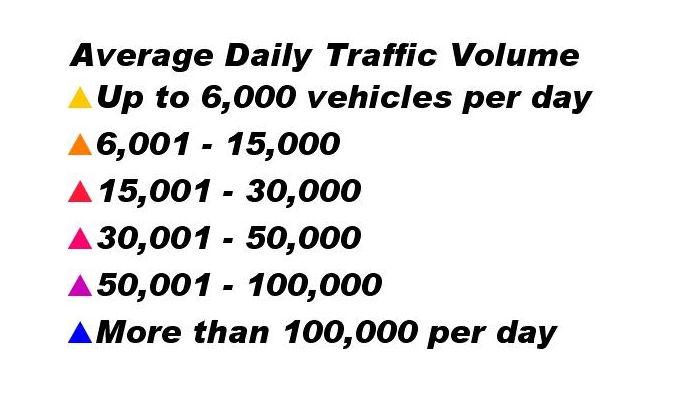
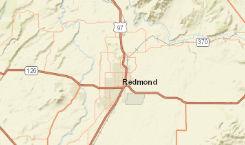
Bureau of Land Management, State of Oregon GEO, State of Oregon, Esri, HERE, Garmin, INCREMENT P, NGA, USGS, U.S. Forest Service 0 0.8 1.6 mi
1520 NW 6th St, Redmond, Oregon, 97756 Prepared by Esri Rings: 1, 3, 5 mile radii Latitude: 44.29027 Longitude: -121.17359 Source: ©2023 Kalibrate Technologies (Q2 2023). August 28, 2023 ©2023 Esri Page 1 of 1
Traffic Count Map
COMMERCIAL USE AND INDUSTRIAL USE ZONES
8.0150Strip-Service Commercial C-1 Zone.
8.0155Central Business District Commercial (CBD) C-2 Zone.
8.0160Special-Service Commercial C-3 Zone.
8.0165Limited Service Commercial C-4Zone.
8.0166Limited Service Commercial C-4A Zone: Except as provided in 8.0190 and 8.0195, the standards and criteria for development in the C-4A Zone shall apply to development in the C-4A Zone.
8.0170Tourist Commercial C-5 Zone.
8.0175Downtown Overlay District. In the DowntownOverlay District, the following regulations shall apply:
1. Purpose. The purposeof the Downtown Overlay District is to promote and sustain:
A. Economic Growth - Assure opportunities for a stable, vital, diverse, and competitive economy in the heart of the city.
B. Vibrant Downtown - Strengthen downtown as avibrant, mixed-use district that draws a wide spectrum of residents and visitors.
C. Downtown Appearance - Improve and enhancethe appearance of the built environment and natural features throughout downtown, especially along primary commercial corridors, and other major arterials.
D. Historic Character - Preserve and retain historic structures and cultural resourcesthroughout downtown.
E. Pedestrian Environment - Improve and enhance the pedestrian environment throughout downtown, as well as the pedestrianconnections to surrounding neighborhoods and civic resources.
2. Intent. The intent of the Downtown Overlay District is to:
A. Encourage avibrant mix of pedestrian-oriented uses, including residential, shopping and entertainment uses;
B. Increase the density and intensity of development;
C. Establish height, bulk, and lot coverage regulations that balance existing urban fabric with a desired character for downtown;
D. Promote active ground floors by regulating the quantity and location of doors and windows;
E. Establish standards for setbacks and landscaping that encourage and promote a strong pedestrian environment.
F. Establish parking and access standards that support pedestrian activity.
3. Uses Permitted (Please see 8.0190 TableC)
4. Development Standards. In the Downtown Overlay District, the following dimensional standards shall apply:
A. Minimum Building Setback: Two (2) feet. Surface treatment needs to be of similar nature as adjoining sidewalk.
B. Maximum Building Setback: Ten (10) feet. Surface treatment beyond two feet from the sidewalk needs to be landscaped or treated with decorative pavers. Asphalt is prohibited. For full-block developments, a minimum of 50% of the primary street-facing building façade must be located at the minimum two (2) feet setback as described in4.A.
C. Minimum LandscapedArea: No minimum landscaping requirement.
D. Ground Floor Windows: Ground floor windows must be at least 50% of the building length and 50%of the street-facing façade to a minimum height of -
CHAPTER 8 DEVELOPMENT REGULATIONS 62
above finished right-of-way. If the site has two or more frontages, the Ground Floor Window standards is only required on the primary façade. The other façade has a minimum requirement of 50% of the building length and 25% of the ground floor wall area. Windows arerequired tobe transparent.
Please note: Ground floor wall area is defined as all wallareas up to ten (10) feet above the finished grade.
Ground Floor Windows Residential Use: 25% of the ground floor wall area must be transparent.
E. Main Entrance: The front door to all buildings must be oriented to the primary street. In the event that a building is located on the corner, the front door should be oriented directly to the corner or located within fifty (50) feet of the corner of the primary street.
F. Pedestrian Connection from Front Door to theStreet: Create a straight-line connection from the front door tothe primary street sidewalks.
G. Exterior Display and Storage: Permanent storage between the building and the street is prohibited.
H. Screening HVAC Equipment: Screen rooftop mechanical equipment through extended parapets or other roof forms that are integrated into the overall composition of the building. Screen ground floormechanical equipment. Renewable energy generation devicesmay be exempt from screening, subject to site and design review by a hearings body.
I. Parking andAccess: Parking between the building and the primary street is prohibited.
5. Building Height. The intent of the building height standards is to set guidelines to assist the development in the downtowncore that increase economic activity, capital value and encourage investment in the downtown core. The following guidelines provide performance standards that encourage innovative design and development techniques within specific parameters. They are generally prioritized to include the following: Compatibility withexisting downtownbuildings andsurrounding residential neighborhoods; Human scale related to building design, including height and massing, and its impact on solar access and views; Multi-story and mixed-use buildings for increased density and diversified use on premium land intheurban core; Development incentives for increased height, based on Performance Bonuses.
A. Maximum Height: Themaximum height allowed for the downtown overlay district for all structures that are not within one full city block of aresidential zone and west of SW 5th Street is sixty (60) feet, and east of SW 5th Street is 75 feet. The maximum height of structures east of 5th Street may be increased if a Conditional Use Permit for the structure is approved by a Hearings Body. The following standards shall apply to structures inthe Downtown OverlayDistrict.
1. Street Wall Height: Maximum street wall façade height for the downtown overlay district for all structures that are not within one full city block of aresidential zone is forty-five (45) feet.
2. Upper-floor Setback: Buildings taller than forty-five (45) feet must step back upper stories by at least 10 feet measured from the façade of the street wallfacing the street, public park, or open space.
3. Residential Buffer Zone: All buildings in the Downtown Overlay District within one full city blockadjacent to a residential zone shall be considered to be part of the Residential Buffer Zone, wherein the following height
CHAPTER 8 DEVELOPMENT REGULATIONS 63
standards apply:
a. Maximum Height: The maximum height allowed for all structures within the Residential Zone Buffer is fifty (50) feet.
b. Street Wall Height: Maximum street wall façade height for structures withinthe Residential Zone Buffer is thirty-five (35) feet.
c. Upper Floor Setback Requirements: Buildings taller than thirtyfive (35) feet must step back upper stories by at least 10 feet measured from the façade of the street wall facing the street, alleyway, public park, or open space.
B. Architectural Standards for Buildings Taller Than 45 Feet: In addition to the existing Site and Design Review criteria and Downtown Overlay District Design Standards, the following architectural standards will apply to all buildings taller than forty-five(45) feet.
1. On upper floors use windows and/or architectural features that provide interest on all four sides of the building when permitted within the building code.
2. Abrupt changes in building heights and/or roof orientation should be diminished by offsets of building form and mass.
3. Use recesses and projections to visually divide building surfaces into smaller scaleelements.
4. Use color tovisually reduce the size, bulk, and scale of the building.
5. Buildings sixty feet or over shall provide rooflines with articulated features.
6. Location of back flow prevention devices and the fire sprinkler riser must be identified on project plans submitted for site and design review and shall be located inside the building.
C. Buildings within the Downtown Overlay District shall only be permitted to exceed 75 feet if they comply with the standards set forthbelow.
1. Performance Bonus: Additional building height above 75 feet may be approved if the project achieves a minimum of twelve (12) points from the following:
Affordable Housing: The project provides affordable housing, per City standards, for low- and moderate-income households, as a percentage of the total number of residential units built. 3points for 10%, 4 points for 15%, and 5 points for 20% of total number of residential units built for affordable housing.
Workforce Housing: The project provides workforce housing, per City standards. 1 point for 10%, and 2points for 20% of total number of residential uses built for workforce housing.
Public Plaza: The project incorporates a public plaza which is at least 5% of the gross site area. Theplaza shall be on the street side of the building, and open and free to the public at alltimes and shallremain for a period of at least ten years. 1 point per 5% public plaza space, with a maximum of 4points.
Public Art: 0.5% of the overall project budget is set aside for an on-site public art project that shallremain for the life of the building, or 1.0% of the overall project budget is provided to the City for off-site public art shall be awarded 2 points. Increasing thesepercentages to 0.75 % and 1.5% respectively increases the number of points awarded to 3. Increasing these percentages to
3 - 5 pts.
1 2 pts.
1 - 4 pts.
2 - 4 pts.
CHAPTER 8 DEVELOPMENT REGULATIONS 64
1.0% and 2.0 % respectively increases the points awarded to 4.
View Access and Preservation: The project provides a public viewing deck or decks, or similar features, whichare at least 5% of the gross site area. The viewing deck(s) should be located at least sixty (60) feet above ground level and provide significant free public access to views of surrounding Central Oregon features, such as the Cascade Mountains and Smith Rocks, and shall remainfor a period of at least ten years.
Economic Vitality: The project provides additional economic benefit tothe City by providing retail sales and/or hospitality uses on multiple levels. Total floor area dedicated to entertainment, eating anddrinking, retail services, and service commercial uses as presented in Section 8.0190, Table C of the Redmond Development Code, must equal or exceed 75% of the building footprint and shall remain for a period of 5 years will be awarded 4 points. One additional point will be awarded for each additional 25% of floor area (as defined by the building footprint) for retail, entertainment or hospitality uses up to amaximum of 8 points.
Historic Preservation: The project provides for preservation or adaptive reuse of all buildings on the Cit tory of Historic Resources located on the project site in amanner consistent with the Secretary of the Interio rds for the Treatment of Historic Resources shallbeawarded 2 points. The Hearings Body may increase the points up to 4 points for projects on the National Register of Historic Places. As an alternative, 1.0% of the overall project budget is provided for a specific historic preservation project that will be completed within a specific timeframe in the Cityof Redmond or is provided to the Redmond Historic Commission for historic Redmond projects (not operations) shallbe awarded 2 points. The provision of 2% of the overall project budget will receive 4 points.
Sustainable Building: Project is built to LEED standards, or equivalent green building practices. It will be up tothe applicant toprovide material supporting equivalent building practices. (Certified is awarded 2 points, Silver certification is awarded 3 points, Gold certification is awarded 4 Points, and Platinum is awarded 5 points.)
Parking: In addition to the required parking for the development, the project provides at least 7 on-site parking spaces for public use between 8:00 6:00 PM that shall remain for the life ofthe building. 1 point per 7 public parking spaces, with amaximum of 5 points.
1 pt.
4 - 8 pts.
2 - 4 pts.
2 - 5 pts.
1 - 5 pts.
Total: 36 pts.
2. Building Bulk for Buildings over 60 feet in Height:
a. Floor Area Ratio (FAR): Buildings between sixty (60) feet and eighty-five (85) feet shall have a maximum floor area ratio of 4.0. Buildings eighty-five (85) feet and taller shall have a maximum floor area ratio of 5.0. Floor Area Ratio (FAR) is a method of
CHAPTER 8 DEVELOPMENT REGULATIONS 65
calculating allowable floor area in a development as a means of con an massing of larger developments, often encouraging setbacks and step backs, and progressively slender upper floors.
3. Application Requirements for Buildings Over 75 Feet: Planning applications submitted for new buildings over 75 feet tall shall include the following additional items to assist the City in the analysis and decisionmaking process.
a. Three-Dimensional Digital Model: A complete threedimensional digital model of the proposed building.
b. Solid WasteManagement Plan: A solid wastemanagement plan to showhow the project meets or exceed Solid Waste Guidelines, to the approval of the Utilities Director.
c. Utilities InfrastructureAnalysis: on of existing utilities infrastructure and recommendations to ensurethat the project will have adequate water pressure for domestic use and fire flows andthat the collection system inthe area surrounding the proje impact.
d. Emergency Services Access Plan: A written and graphic plan, created in consultation wit eMarshal to showhow access to site and upper floors for emergency response personnel will be provided.
e. Public Safety Plan: A security plan, created in consultation with the Police Department for all proposed buildings that include publicly accessible areas such as parking garages, courtyards, public stairways, elevators, and decks.
4. Height Design Departure: In addition to the availability of variances as noted in 8.0700 8.0720, a design departure procedure will be established to allow a project to achieve flexibility in the application of prescriptive development standards and height performance bonuses (limited to two height performance bonuses). A 20% departure may be granted administratively. In order to allow a departure from a code standard, an applicant must demonstrate that it would result in a development that better meets the intent of the purpose of the regulation and applicable design guidelines.
6. Design Standards. Any change to the exterior of a building or a property shallbe reviewed by the Community Development Department pursuant to Article IV Section 8.3040 of the Redmond Development Code.
7. Off-Street Parking. In addition to the standards of 8.0505 8.0515, the following standards shall apply for off-street parking in theDowntown Overlay District:
A. Off-Street Parking Requirements(Number ofSpaces):
1. Residential: Per State Condominium Code
2. Non-Residential: 1 parking space per 500 net square feet
3. For buildings over 75 feet in height: 1 parking space per 1000 net square feet.
B. Fee-In-Lieu of Parking: The purpose of these provisions is to allow development in the Downtown Overlay District to reduce the number of off-street parking spaces through payment of a fee in order to meet the parking requirements set forth in this Code. These provisions may be utilized for parking required for new construction or for an increase in required parking resulting from the change of use of an existing building.
CHAPTER 8 DEVELOPMENT REGULATIONS 66
Payment made to the City in-lieu of supplying the required off-street parking spaces for a project in the Downtown Overlay District may be provided as follows:
1. By the one-time payment of a non-refundable parking and mobility improvement fee to the ee Schedule, paid prior to the issuance of Certificate of Occupancy. Fees collected shall be used to fund parking, street improvements or facilities to improve mobility or enhance pedestrian connectivity and safety in the Downtown Overlay District.
2. From time to time the City shall establish the value of off-street parking facilities on a per parking space basis, used to establish the above parking and mobility improvement fee.
3. The City Engineering shall evaluate development proposals requesting to pay an in-lieu fee through conducting a Transportation System Analysis or parking study.
4. Any such request for parking in-lieu may be denied or reduced by the Community Development Director, or designee. The Director, or designee, shall determine:
a. Whether there is sufficient alternative parking within a two to fourblock radius of the project location.
b. Whether approval of the request would have an adverse effect on surrounding neighborhoods.
c. Whether the request meets the Purpose and Intent of the Downtown Overlay District Zone.
d. Compliance with the Redmond Comprehensive Plan 2040 and support plans, as amended.
[Section 8.0175 amended by Ord. #2016-17 passed January 31, 2017]
[Section 8.0175 amended by Ord. #2022-04 passed June 28, 2022]
[Section 8.0175 amended by Ord. #2022-09 passed December 13, 2022]
8.0180Light Industrial (M-1) Zone.
8.0182General Industrial (M-1.5) Zone.
8.0185Heavy Industrial (M-2) Zone.
8.0186Large Lot Industrial (LLI) Zone.
1. LLI Zone Regulations. The following standards and regulations apply inthe LLI Zone:
A. The lot shall adhere to the designation as acknowledged by the Central Oregon IntergovernmentalCouncil.
B. No property that is zoned LLI can be rezoned to another zone within ten years of the LLI designation.
C. The minimum lot size is 50 acres. Division or separation of lots or parcels within the site to new lots or parcels less than the minimum lot size is not allowed until the site is developed with a primarytraded sector use requiring a large lot.
D. Allowed uses are tradedsector uses as provided in Section 2.
E. Uses allowed tosupport a primary userincluded:
1. Subordinate industrial uses that rely upon and support the primary traded sector use;
2. Service commercial uses that support the traded sector uses if they are limited to7500 square feet per use; and
CHAPTER 8 DEVELOPMENT REGULATIONS 67
3. Retail uses accessory to a traded sector use and limited to 7500 square feet.
F. Conceptual Phased Site Development Plan. A Conceptual Phased Site Development Plan is required for each primary traded-sector use as part of the Site and Design Review process in addition to the criteria and requirements outlined in Article IV of this code. In addition to the requirements outlined in Section 8.3025, the following elements shall be considered as part of the Conceptual Phased SiteDevelopment Plan:
1. Open Space. Generally identify land provided for openspace onthe site.
2. Connectivity and Trail Networks. A conceptual transportation plan for streets, pedestrians connectivity and trail networks. E.g., Connection of bicycle routes and pedestrian network for utility and recreational purposes.
3. Site Design. Describe how the design elements (i.e., streets, open spaces, signage, and architecture) are integrated and coordinated throughout the site.
4. Analysis of Anticipated Utility Consumption by Phase. Analysis of the anticipated utility consumption by phase for wastewater, water, power, natural gas, and other utility infrastructure necessary to support the development.
2. LLI Zone Uses Permitted. The following uses are allowed outright or conditionally in the Large Lot Industrial Zone:
O PerORS285B.280,tradedsectormeansindustriesinwhich memberfirmsselltheirgoodsorservicesintomarketsforwhich nationalorinternationalcompetitionexists,aswellasusesand servicesthatdirectlybenefittradedsectoruses.Alloweduses includemanufacturing,processingplants,distributioncenter, warehousing,researchanddevelopment,andhighereducation institutions
O
C
Afteraprimarytraded-sectorusehasbeensited,subordinate industrialusesareallowed.Subordinatemeansindustriesthat relyuponandsupportaprimarytradedsectoruse
Afteraprimarytraded-sectorusehasbeensited,service commercialusesareallowedthatsupportthetradedsectoruses andshallbelimitedto7500squarefeetperstructure
C Afteraprimarytraded-sectorusehasbeensited,retailuses,and eatinganddrinkingestablishmentsareallowedasaconditional useandshallbelimitedto7500squarefeetperuseinthe structure.
O=Outrightuses,C=ConditionalUses
3. Minimum Standards. See Table D, 8.0195.
[Section 8.0186 added by Ord. #2015-11 passedSeptember 22, 2015]
[Section 8.0186 amended by Ord. #2022-09 passed December 13, 2022]
CHAPTER 8 DEVELOPMENT REGULATIONS 68
Land Use: Zone: RESTRICTIONS AND REQUIREMENTS: Traded-Sector Usage
Subordinate Industrial Uses
Service Commercial Uses
Retail Uses
CHAPTER 8 DEVELOPMENT REGULATIONS
8.0190Table C, Uses Permitted. The following uses identified below are allowed outright or conditionally in each of the Commercial and Industrial zones. Outright or conditional uses in the M-1.5 zone may be permitted Conditionally in the M-1 or M-2 zones; this allowance does not apply for uses Not Allowed ( N ).
69
means Permitted Outright eans Permitted Conditionally means Not Allowed Commercial/Industrial: C-1 C-2 C-3 C-4 C-4A C-5 M-1 M-1.5 M-2 DOD Restrictions and Requirements: Apartments N N N N N N N N N N SeeMulti-Family complexes. AssistedLivingFacility O O O O O O N N N C BedandBreakfast C C C C N N N N N C BoardingHouse O O O O C C N N N O Caretaker C N N C N C C C O N Mustliveonsite. Condominium N N N O N N N N N O Stateregulated. Dairy N N N N N N N N N O HomelessShelter O C C C N N O C N N ManufacturedHomePark C N N C N N N N N N Multi-FamilyComplex O O O O O O N N N O* *ResidentialUseonground floorrestrictedto<25%and shallnotbeinfrontof building. PlannedUnit Development C C C C C C C C C C ResidentialUseabove groundfloor O O O O N N N N N O ResidentialUseon groundfloor<25% N O O O N N N N N O Notinfrontofbuilding. ResidentialUseon groundfloor>25% N N N N N N N N N N Residentialcarefacility O C O C N N N N N C Residentialcarehome O O O O N N N N N O SingleFamilyDetached Dwelling(including ADUs) andDuplexeson ground floor C O* C N N N N N N O* *Onlypermittedforthose usespre-datingthe adoptionoftheC-2Zone Amendmentsand DowntownOverlayDistrict onAugust12,2008. AttachedSingleFamily andtriplexand quadplex abovegroundfloor O O O O O O N N N O Resumptionofa residentialuse O O O O O O N N N C Onlyaspreviously established. Eating and Drinking: C-1 C-2 C-3 C-4 C-4A C-5 M-1 M-1.5 M-2 DOD Restrictions and Requirements: Bakery(retail/sit-down) O O O O O* O O O O O Bar,Lounge,Tavern, Nightclub O O C O O* O O O O O Café,Restaurant(sitdown),Diner, BrewPub O O O O O* O O O O O Deli'sarelistedunder"retail uses." Café,Restaurant, Espresso(drivethrough) O O O O O* O O O O O Deli'sarelistedunder"retail uses." Entertainment: C-1 C-2 C-3 C-4 C-4A C-5 M-1 M-1.5 M-2 DOD Restrictions and Requirements:
70 AmusementPark C N N N O O N N N N ArenaforIndoorSports Events O C N C O O N N N C Largerthanindoor commercialrecreational use. DrivingRange O N N N N O N N N N GolfCourse N N N N N O N N N N IndoorCommercial Recreation O O O O O O C C C O MiniatureGolf, "Pitch&Putt" O N N N N O N N N N OutdoorCommercial Recreation C C N C O C N N N C Walk-inMovieTheater O O O O O O N N N O Automobile, Trucks, RV's: C-1 C-2 C-3 C-4 C-4A C-5 M-1 M-1.5 M-2 DOD Restrictions and Requirements: AutoDetailing O C N O O* N O O N C** Noautobodywork permittedas"detailing". **Grandfatheredasa ConditionalUseforexisting businessespriortoAugust 12,2008. AutoPainting, AutoBodyWork O N N N O* N O O O N AutoRepair O C N C O* N O O O C** Definedinpartbysomeonsiteautostorage. **Grandfatheredasa ConditionalUseforexisting businessespriortoAugust 12,2008. AutoSales(newand used);AutoRentals C C N O N N N N N C** **Grandfatheredasa ConditionalUseforexisting businessespriortoAugust 12,2008. AutoService O C N O O* N N N O C** Includesautolubeshops ('sameday'service). **Grandfatheredasa ConditionalUseforexisting businessespriortoAugust 12,2008. RecreationalVehicleor BoatSalesandService C N N C C N C C N N Includesmotorcycles, ATVs,otherrecreational vehicles. CarWash O O O O O O O O O C** Steamcleaningpermitted intheindustrialzones. **Grandfatheredasa ConditionalUseforexisting businessespriortoAugust 12,2008. GasStationsIncluding CardLock O O N O O O O O O C** **Grandfatheredasa ConditionalUseforexisting businessespriortoAugust 12,2008. TireSalesandService O O N O O N N N N N TruckStop O N N N O N O O O N TruckTerminal N N N N N N O O O N Automobileand RecreationalVehicle Storage/TowingYard N N N N N N C C C N Includesimpoundyards, autofleets. Industrially Related Uses: C-1 C-2 C-3 C-4 C-4A C-5 M-1 M-1.5 M-2 DOD Restrictions and Requirements: Aircraft/AirportService, ParkingLot, Maintenance N N N N N N O N O N
CHAPTER 8 DEVELOPMENT REGULATIONS
71 AutoWrecking,Recycling N N N N N N C C O N Bakery,Wholesale Distribution C N N N N N O O O N BatchPlants (Asphalt/Concrete) N N N N N N N C O N Commercial Manufacturing(Retail Support,Craftsmen) O O O O O O O O O O Mustbefullyenclosedin "C"zonesthatpermitthis use. Concrete&Concrete Products,Stone-cutting N N N N N N C C O N DistributionCenter N N N N O N O O O N Dump,Landfill N N N N N N N N C N EnclosedWarehousing andManufacturing N N N N N N O O O N Upto50%retailallowedin IndustrialZones. Junkyard N N N N N N N N O N AutoWreckingYard'isa separatecategory. LandscapingSupply (Bulk) N N N N N N O O O N Outdoorstorageofbulk landscapingmaterial. LumberMill N N N N N N N C O N Manufacturing (HeavyIndustrial) N N N N N N N C O N Manufacturing (LightIndustrial) N N N N N N O O O N SubjecttoDEQ requirementsand neighborhoodcompatibility. MedicalResearchFacility O O O O O O O O O O Excludesresearchusing biohazardousmaterial. PrecisionMachineShop C N N C N N O O O N Mustbefullyenclosedin "C"zonesthatpermitthis use. RetailUsesinsupportof primaryIndustrialUse N N N N N N O O O N Mustbelessthan50%of thegrossfloorarea. RockCrushing/Recycling N N N N N N C C O N Slaughterhouse N N N N N N N N O N Tanning,Curing, StoringofHides N N N N N N N C O N WholesalePrintingand Distribution N N N N N N O O O N WoodProduct Manufacturingand Assembly N N N N N N O O O N Offices and Office Products: C-1 C-2 C-3 C-4 C-4A C-5 M-1 M-1.5 M-2 DOD Restrictions and Requirements: Office O O O O O O C C N O OfficeServiceand Supplies O O O O O* O N C N O Officesrelatedto IndustrialUse N N N N N N O O O N Printing,Publishing O O O O O O O O N O Telemarketing,Call Center O O O O O O C C N N Public and Semi Public Uses: C-1 C-2 C-3 C-4 C-4A C-5 M-1 M-1.5 M-2 DOD Restrictions and Requirements: AgriculturalUses N N N N N N N N N N Churches,Religious Institutions C C C C C C C C N C ConventionCenter O O N O N O N N N O Hospital N N O N N N N N N N
CHAPTER 8 DEVELOPMENT REGULATIONS
72 Lodge,Club, Non-profit/frat.Org. C C C C C C C C N C Park,PublicorPrivate O O O O O O O O O O ParkingGarage, PublicorPrivate O O O O O O O O O O PublicTransportation Station O O O O O O O O O O RVPark,PublicorPrivate C N N C N C C C N N Referto8.0615(14) PoliceorFireStation: PublicSafetyor EmergencyServices O O O O O O O C C C Schools,PublicorPrivate C C C C C C C C N C CityOwnedUtilityor PublicFacility O O O O O O O O O O Retail Uses: C-1 C-2 C-3 C-4 C-4A C-5 M-1 M-1.5 M-2 DOD Restrictions and Requirements: BicycleSalesandService O O N O O* O N O N O BulkyRetail (includingfurniture) O O N O O O N O N O Excludesequipmentand heavyequipment. ContractorSupplies (enclosed) O O N O O N O O O O AlsocalledBuilding Supplies(nonlandscaping). ContractorSupplies (outdoors) O C N C O N N O N C Delicatessen O O O O O* O C C N O DrugStore,Pharmacy O O O O O* O N O N O EquipmentSales,Service &Rental O O N O O N N O N C ExcludesHeavyEquipment SalesandService. Florist O O O O O* O N O N O Gallery,Studio O O N O O O N O N O GeneralRetail O O N O O* O N N N O Gift/CardShop O O O O O* O N N N O GroceryStore,Market O O N O O** O N N N O HardwareStore O O N O O* O N C N O HeavyEquipmentSales O N N N N N O C O N Onlypermittedw/primary serviceuseinMZone. HeavyEquipmentService O N N N N N O C O N HeavyEquipment Storage (outdoor) N N N N N N N C O N MedicalSupplies(Retail) O O O O O N N C N O Mobile/Manufactured HomeSales&Service O N N C N N N N N N Novelty,Specialty, VarietyStore O O C O O* O N N N O Includesmusic,artsupply, electronicequipment, sportinggoods. OutdoorMerchandise Display,Other O C N O O N N C N C Nonstoragerelated;for retailsales. PetShop O O N O O O N N N O PlantNursery O N N O O O N C N N ThriftStore-1 O O O O N O N N N O Service Commercial Uses: C-1 C-2 C-3 C-4 C-4A C-5 M-1 M-1.5 M-2 DOD Restrictions and Requirements:
CHAPTER 8 DEVELOPMENT REGULATIONS
CHAPTER 8 DEVELOPMENT REGULATIONS
O*Maximumsize=10,000squarefeet
O**Maximumsize=20,000squarefeet
[Section 8.0190 amended by Ord. #2012-10 passed August 14, 2012]
[Section 8.0190 amended by Ord. #2015-04 passed May 19, 2015]
[Section 8.0190 amended by Ord. #2016-17 passed January 31, 2017]
[Section 8.0190 amended by Ord. #2017-12 passed December 12, 2017]
[Section 8.0190 amended by Ord. #2018-09 passed September 11, 2018]
[Section 8.0190 amended by Ord. #2020-15 passed November 10, 2020]
[Section 8.0190 amended by Ord. #2022-04 passed June 28, 2022]
[Section 8.0190 amended by Ord. #2022-09 passed December 13, 2022]
73 ApplianceandComputer Repair O O N O O* N N N N O Includesstereos,electronic equipment,residential appliances. Bank,FinancialInstitution O O N O O C N N N O Beauty&BarberShops& Salons(Includingspas) O O O O O* O N N N O ContractorService O N N O O N O O O N Enclosedwithinabuilding (exceptinM-2zone); includesequipmentrentals andsales. Contractor'sYard C N N N N N C O O N Includesoutdoorstorageof equipmentandbuilding supplies. ChildCareFacility O O O O O O C C N O Ifafacilityispartofan industrialdevelopmentand withinthemanufacturing structure,aconditionaluse permitisnotrequired. DryCleaner(drop-off only) O O N O O* O N C N O DryCleaner(fullservice) O C N C O* N N C N C Kennel C N N C N N O C O N Laundromat O O N O O O N C N O MiniStorage C N N C N N C C N N SeeSection8.0615(17). Mortuary,FuneralHome O O O N N O N C N O Motel,Hotel O O C O O O C N N O PrintingandCopying Store O O N O O* O N C N O VeterinarianServices O O O O O O O C O C FullyenclosedinCzones; nooutdoorkennels.
CHAPTER 8 DEVELOPMENT REGULATIONS
8.0195Table D, Minimum Standards. The following minimum standards are required in each of the Commercialand Industrial zones as follows (all distances aremeasured in feet):
*Theminimumlotsizeshallbedeterminedbasedondemonstrationoftheabilitytodevelopthesiteinaccordancewiththezonestandards,offstreetparkingstandards,Site&DesignReviewStandards,landscapingrequirementsandotherapplicableDevelopmentCodeprovisionswithout adverseimpacttowaterandlandresourcequalityandadjoiningproperties.
*ResidentialusespermittedinCommercialzonesshallbesubjecttothedensitystandardsfortheR-5zone,exceptfortheC-2,C-3zoneand DowntownOverlayDistrict,forwhichthereisnomaximumdensitystandard.
A Arearyardabuttinganalleyshallbe25feetfromthepropertylinetofoundationwhenthealleyisusedtoservicethecommercialestablishment and10feetinothercases.
B Maximumbuildingheightislimitedto45feetforallstructureswithinonefullcityblockofaresidentialzone.Whereallowedbuildingsover45feet shallconformtheUpperFloorSetbackStandardsintheDowntownOverlayZoneSiteandDesignStandardsinSection8.0175(5).
C RearyardsalongthenorthsideofHighlandAvenue/Highway126betweenSW23rdandSW27thStreetsshallhaveaminimumarterialsetback of25feet.Allotherrearsetbacksadjacenttoarterialsshallbe50feet.
D TheminimumsetbackbetweenastructureandanexistinguseintheC-5zoneshallbe5feetfromthepropertylineand10feetfromany adjacentstructureonthesubjectsiteoradjacentproperty.
74
C-1 C-2 C-3 C-4 C-4A C-5 M-1 & M-1.5 M-2 LLI DOD Minimum Yard Setbacks Front LocalStreet 10 H 5 10 10 10 10 10 10 10 H 2 Collector 25 25 25 25 25 25 25 25 Arterial 50 50 50 50 50 50 50 50 InteriorSide Standard D 5 F 10-15 F 1015 10-15 AdjacenttoR-Zone 25 25 25 25 Street Side LocalStreet 10 10 10 10 50 10 10 10 Collector 25 25 25 25 50 25 25 25 Arterial 50 25 50 50 50 50 50 50 Rear Interior D 5 10 10 10 LocalStreet 10 10 10 10 50 10 10 10 Collector 25 25 25 25 50 25 25 25 Arterial 50 25 C 25/50 25 50 50 50 50 AdjacenttoR-Zone 25 25 25 25 50 Adjacenttoalley A 10/25 A 10/25 A 10/25 A 10/25 Maximum FrontYard Setback I 15 I 10 Maximum Building Height 60 B 50/60 60 60 60 60 60 60 60 G 50/60/75 Minimum Street Frontage StandardStreet 50 50 50 50 50 50 50 50 50 Cul-de-sac 30 30 30 30 30 30 30 30 30 Minimum Landscaping 15% J 15% 15% 15% 15% 15% 15% 15% 15% 0% Minimum Lot Size* 200acres for1st Lot.50 acres
CHAPTER 8 DEVELOPMENT REGULATIONS
E Nouselocatedinanindustrialzoneadjacenttooracrossthestreetfromaresidentialzoneshallexceed60%ofthelotareaincludingbuildings, storageorfacilities,andoff-streetparkingandloading.Mostofthelandscapingrequiredonindustriallotsthatabutresidentialzonesispermittedin betweentheindustrialuse/residentialuses.
F Theminimumsideyardinanindustrialzoneshallbe10feetfor1and2storybuildingsand15feetfor3storybuildings.
G Maximumbuildingheightislimitedto50feetforallstructureswithinonefullcityblockofaresidentialzone.Whereallowed,buildingsover50 feetshallconformtheDowntownOverlayDistrictSiteandDesignStandardsinSection8.0175(5).Themaximumbuildingheightforstructures westofSW5th Streetis60feet.Themaximumbuildingheightforstructureseastof5th Streetis75feetandmaybeincreasedabove75feetifa ConditionalUsePermitforthestructureisapprovedbyaHearingsandReviewAuthority.
H Existingzero-lotlinestructuresasofAugust12,2008,shallbeexemptfromthisstandard.Atthetimethefrontfaçadeofabuildingorabuilding isdemolishedasdefinedbythisCode,thenthebuildingshallcomplywiththisstandardunlessavarianceisapproved.
I Fullblockdevelopmentsrequireaminimumof50percentofthebuildingfaçadetobedevelopedtotheminimumsetback.Asphaltisprohibitedin thefrontyardsetback(concrete,pavers,landscapingareallowed).
J Maybemetthroughwalkways,playareas,plazas,pocketparks,andpicnicareas.
[Section 8.0195 amended by Ord. #2012-10 passed August 14, 2012]
[Section 8.0195 amended by Ord. #2014-12 passed May 27, 2014]
[Section 8.0195 amended by Ord. #2015-11 passed September 22, 2015]
[Section 8.0195 amended by Ord. #2018-09 passed September 11, 2018]
[Section 8.0195 amended by Ord. #2020-15 passed November 10, 2020]
[Section 8.0195 amended by Ord. #2022-04 passed June 28, 2022]
75