HOW BIDEN

WILL BOOST SA
REGISTERING A SMALL BUSINESS
INVESTING IN WINE WITHER INFLATION?
TRACK YOUR FORTUNE WITH OUR DATABANK VOLUME 86 • 1 st QUARTER 2021 WWW.PERSFIN.CO.ZA

COVER STORY ‘Act Big’ is South Africa’s silver
bullet
Having Joseph Biden and his administration installed at the White House is good news for South Africa, but it’s up to our government to seize the moment.

FEATURES
12 Inflation: coming to an economy near you? Has the low-inflation environment lulled us into complacency?
15 Do you need to register your small business?
Answers to questions small business owners need to consider.
20 Provident funds align with pension funds Changes to withdrawals take effect on March 1.
22
31 Does fine wine a fine investment make?
Putting profit before pleasure.
35 Money market funds: some are more equal than others
The differences between these funds explained.
37 What to know about life annuity guarantees
Benefits for your heirs if you die prematurely.
39 Leaving South Africa? This is what you must know about tax
With our complex tax system, it pays to be informed.
42 How do offshore assets fit into your estate planning?
Depending on where they are, things can get complicated.
44 There’s more to Section 12J investing than the tax break
The case for diversification and economic growth.
REGULARS
4 Upfront Big Spender
6 Book review Our pick of financial books
7 Your letters Readers’ queries answered by experts
48 Millennial view How 2021 changed my relationship with money
49 Fund focus The Absa Inflation Beater Fund
51 On the contrary Investment solutions for a new world
DATABANK
52 A list of the adjudicators and the ombuds who can assist you with your complaints, followed by the unit trust quarterly results, tax rates and annuity rates
Why saving in a retirement fund is hard to beat Research confirms taxbreak advantages over other investments.
26 From Pretoria with love Financial Planner of the Year, Hester van der Merwe.
28 The road to universal health care Is NHI the answer to South Africa’s healthcare ills?
8
MARTIN HESSE
BIG SPENDER
Since the 2008 global financial crisis, economists and governments of developed countries have converged on the Keynesian view that the best way to handle a financial crisis is to spend your way out of it. The difference between how the US and Europe emerged from the crisis made it clear: austerity only makes things worse.
The question then becomes where should the money be spent?
After the 2008 crash, the Obama administration bailed out big finance, slashed interest rates and embarked on quantitative easing, which was wonderful for investors, who benefited from the longest bull market in US history. But was it beneficial for the man in the street?
The answer appears to be no, or else working and middle-class Americans would not have become so disenchanted in their government that they were seduced by the populist rhetoric of Donald J Trump.
The Covid-19 crisis has been very different, in that it has not seriously undermined the financial system. But it has hit the man in the street much harder: depriving him of business, employment and income on a scale not seen since the Great Depression.
The US government stepped in with massive relief packages, aimed directly at citizens, simply to enable them to survive, month in and month out.
When that relief started drying up at the end of 2020, the question was to what extent it should be extended. After all, even with the advent of vaccines, no one knew (and still doesn’t) how long it would take for the virus to be defeated and life to get back to normal. Even a country as rich as America couldn’t afford to sustain its population indefinitely.
With Biden winning the White House, and Janet Yellen being appointed Treasury Secretary, the answer was decided. Much more spending and QE was needed to see America through the crisis.
Of course, Biden has been good for America and the global economy in numerous other ways, and there has been almost immediate improvement in relations with its traditional allies.
As we read in financial analyst Ryk de Klerk’s insightful article on page 6, the by now cash-strapped South African government may not be able to offer the same sort of relief to its citizens that the US can, but it can take advantage of any international support in the offing.
Positioning South Africa as an investment-friendly destination is a vital step.
VOLUME 86
1st QUARTER 2021
An Independent Media (Pty) Ltd publication
Editor
ANA Publishing CEO
ANA Publishing CFO

Head of Production
Head of Design Designer
Martin Hesse martin.hesse@inl.co.za

Vasantha Angamuthu Sooren Ramdenee
Mugamad Jacobs
Matthew Naudé Thabang Boshielo
ADVERTISING
Tony Malek tony.malek@anapublishing.com
Daniel Kgaladi daniel.kgaladi@inl.co.za
OFFICE MANAGER
Caryn Wessels caryn.wessels@inl.co.za
IMAGERY Freepik.com and AP
INDEPENDENT MEDIA BOARD OF DIRECTORS
Dr. Mohammed Iqbal Survé, Takudzwa T. Hove, Aziza B. Amod, Ismet Amod, Yuexing Wang, Jinghua Dong
EDITORIAL ENQUIRIES
Tel: 021 488 4187
Physical address: Fourth floor, Newspaper House, 122 St George’s Mall, Cape Town, 8001 Postal address: PO Box 56, Cape Town, 8000
Personal Finance magazine (ISSN 1562-3750) is published by the proprietors, Independent Media (Pty) Ltd, Star Building, 47 Sauer Street, Johannesburg, 2001 All products appearing in Personal Finance are available and all prices are correct at time of print, subject to change.

Now is not the time to sit by idly.


Now is the time to question.

The time to challenge.


Now is the time to act.
To believe in something bigger than ourselves.

Now is the time to help small business.

Big business.
And nurture new business.

Now is the time to put our money where it matters.
By investing R2,25bn of our own capital.
To jumpstart the economy.
To keep business doors open.
And keep food on the table.
Now is the time to plan.
We know the importance of keeping as many businesses going as possible. That’s why we’re actively supporting businesses that have been negatively impacted by COVID-19 by creating the Sanlam Investors’ Legacy Range –three impact funds with the core objective of helping to preserve current jobs and creating new ones. To find out more about the Sanlam Investors’ Legacy Range, visit www.sanlamintelligence.co.za/institutional/.
www.sanlaminvestments.com


KINGJAMES 51104/RR
Sanlam Investment Management is an Authorised Financial Services Provider.
EXPERT ADVICE ON DEALING WITH SARS
Practical Guide to Handling Tax Disputes
Author: Nico Theron
Publisher: LexisNexis
Retail price (print or e-book): R546.25
Taxpayers and businesses are under increasing pressure as a result of the economic downturn and impact of Covid-19. Equally, the South African Revenue Service (SARS) is under pressure to meet revenue targets. A possible outcome of this scenario, according to experts, is the potential for an increased number of tax disputes in the near future.
“Tax disputes have become increasingly complex,” says Nico Theron, tax expert and author of the newly released guide by LexisNexis South Africa. “There is no single detailed analysis of the rules and, as a result, there seems to often be various interpretations as to what the rules actually are, which makes for increasingly complex outcomes.”
The guide spells out taxpayer options, providing fair opportunity for taxpayers to fight their case and assisting in preventing the collection of taxes and penalties that
are not due. It offers grounds for taxpayers to defend themselves against SARS, the remedies available and tactics for dealing with the pay-now-argue-later rule that SARS typically enforces.
Including templates and dispute resolution forms, the title fills a key gap in existing literature. It will be useful both for individual taxpayers and tax professionals, including lawyers, accountants, auditors, and other tax practitioners.
Nico Theron has an MCom Taxation and is the founder and managing partner of Unicus Tax Specialists SA, a niche tax advisory firm with a key focus on tax dispute resolution. Before founding Unicus in 2017, he was a partner at a tax consulting firm, and he worked at various other tax firms in South Africa. Theron lectures honours students at the University of Pretoria on tax administration and presents seminars for the South African Institute for Tax Professionals.
INTRIGUING MIX OF TALES ABOUT MONEY
Upshot: Stories of Financial Futures
Curated by Lauren Beukes
Publisher: RisCura
Available online, to read or to listen to, on www.riscura.com/upshot
This anthology of fiction about financial realities, by a group of top writers and curated by internationally acclaimed author Lauren Beukes, launched online in January.
The seven stories take society’s present concerns and translate them into future scenarios that require readers to think about their life and investment choices in new and revelatory ways.
Contributors include Tade Thompson, Sam Beckbessinger (whose financial self-help book, Manage Your Money Like a F***ing Grownup, was a runaway success), Angela Makholwa, Bongani Kona and Mohale Mashigo.
“The stories range from a rollicking pension schemer wheeler-dealer with space bikes to a blue-economy love story set in the kelp forests, and an AI financial adviser that wants to make life decisions for you.
Readers will also encounter would-be retirees faking their own deaths, a moving debt slavery reality TV show, a nuanced take on a universal basic income experiment in Nigeria, and every parent’s nightmare in a kid-repossession story,” says Beukes.
The anthology was commissioned by investment firm RisCura. “Upshot is an anthology of stories that contemplate an uncertain future through a financial lens. Financial decisions that may seem abstract to us today will impact us and our future world in 2050 or 2070. We need to start today to invest in the life and the world we want — the implications of our decisions are critical for us and the fate of the planet,” says Malcolm Fair, RisCura’s managing director.
“The stories pose important questions about how we can create safe and prosperous futures through the financial choices we make. They are a call to action for the fatalist and a wake-up call for the unconscious,” he says.
YOUR LETTERS
RETIREMENT FUND SHARE PORTFOLIO
I have heard you can include a share portfolio as part of some retirement products. I am considering this, as my RA has not been performing well at all. In fact, it seems to be losing value. What are the advantages and disadvantages of doing this? I have about R2.5 million in a preservation fund from when I left my last job. I am still saving in my current employer’s pension fund and I am retiring when I’m 65, in 10 years’ time. – Name withheld
Graham Lovely, a financial adviser from PSG Wealth Claremont responds:
You can indeed have a personal share portfolio (PSP) in certain retirement investments, such as an RA, equity-linked living annuity or preservation fund. A PSP is a long-term insurance licensed portfolio made up of various securities such as equities and bonds. Some advantages include:
• Active participation: you’ll have more say in the management of your retirement money.
• Estate planning: at death, the distribution of your benefits is determined by the product in which your PSP is housed. No estate duty will be levied on your benefits. Executor’s fees might be charged on the benefits if the benefits are paid to your estate.
• Creditor protection: retirement benefits are secured from attachment in the event of sequestration. Keep the risks in mind too, such as:
• Capital risk: this is not a guaranteed investment, as the value of your investment is linked to the market value of the securities you hold.
• Costs associated with the investment: fees within the investment product include an ongoing platform administration fee, adviser fee and the underlying fees relating to the share portfolio such as portfolio management fees and brokerage.
Regulation 28 of the Pension Funds Act applies to PSP investments that form part of retirement annuities and preservation pension funds and the Preservation Provident Funds. The asset allocation of a total portfolio must comply with Regulation 28, which, among other things, requires that the equity (share) part of your portfolio is limited to 75%.
A PSP may be suitable for some investors, but it depends on your unique circumstances. Since a PSP is likely to invest predominantly in shares, you should be prepared to accept the associated volatility. Bear in mind that you need to understand the reasons for underperformance in your current investments before deciding to move. I suggest you consult with a qualified financial adviser, to ensure your asset allocation is suited to your needs.
STAFF PENSION FUND VERSUS AN RA
I’ve just received a new job offer. Until now I have saved into my own retirement annuity (RA), but my new employer offers a staff pension fund, and they require that all employees are members. What is the difference? – Name withheld
Pierre de Bruyn, a financial adviser at PSG Wealth Northcliff responds:
Membership in a pension fund depends on an employer-employee relationship and may be required in terms of your employment contract. The underlying investments are usually managed according to the investment strategies followed by the fund’s trustees. An RA is not dependent on an employment relationship, and you, with your adviser’s help, can make your own investment choices.
Both vehicles offer the same tax benefits. Your total contributions made to any retirement funds are deductible for income tax purposes, limited to 27.5% of the greater of your taxable income or remuneration, capped at R350 000 per year. Depending on how your RA contribution is made, you may need to claim back tax from The South African Revenue Service.
Your contributions to an RA can be made paid up; however, penalties could apply. It will depend on the product provider, and it’s always best to first request a quotation to assess the impact.
I suggest you consult a qualified financial adviser, who can advise you accordingly.
4
‘ACT BIG’ IS SOUTH AFRICA’S SILVER BULLET
Financial analyst Ryk de Klerk looks at what the new Biden administration means for South Africa’s fortunes, and why our government can take a page from America’s book to stimulate the economy.

8 PERSONAL FINANCE | 1 ST QUART ER 2021
United States President Biden has hit the ground running and his plans unequivocally underscore the World Bank’s recent views that global economic output is likely to expand by four percent in 2021. Although world growth will have a positive rub-off on South Africa, it is not the silver bullet the country has been waiting for.

Within a few days of President Biden’s inauguration he made significant sweeping changes, as promised during his election campaign. Human dignity and equality have been restored with immediate effect. Biden also rescinded Trump’s withdrawal from agreements such as the Paris Accord on Climate Change and made a recommitment to the World Health Organisation (WHO). A massive effort is underway to vaccinate American people to create herd immunity against Covid-19 as soon as possible and stimulus cheques are to be boosted to US$2000.
Treasury nominee Janet Yellen, during her confirmation hearing before the Senate Finance Committee, argued that massive fiscal support is needed to “defeat the pandemic, to provide relief to American people, and then make long-term investments that will help the economy grow”. This is Yellen’s “Act Big” stimulus plan.
The massive stimulus encompasses quantitative easing through the purchasing of US government bonds. This will put a lid on US government bond yields. Likewise, the postpandemic recovery in the Eurozone requires further massive fiscal stimulus.
The search for yield during the massive quantitative easing is likely to underpin capital inflows to emerging market and developing economies, propping up their currencies relative to hard currencies such as the US dollar, euro and Japanese yen. The market volatility in 2020 just confirmed how fickle international capital flows are.
Foreign inflows seldom end up in fixed investment in emerging markets, and they turn into outflows as soon as foreign investors perceive risks tilting to the downside. That is, unless there is a buy-in and, according to the World Bank, “a comprehensive policy … to rekindle robust, sustainable, and equitable growth”.
The normalisation of ties between the US and its former trade partners will improve global trade and reduce the prospects of supply shocks. Furthermore, the geopolitical environment will improve tremendously, as the new administration is likely to rescind Trump’s withdrawal from agreements such as the Iran nuclear deal. Early indications from China are that the trade war with the US may moderate somewhat as well.
But growth worldwide will be asynchronous owing to the various stages of where major economic zones find themselves in the war against the coronavirus and its various strains, especially regarding the availability and rollout of vaccines.
Dark times

Apart from the East Asia and the Pacific region benefiting from a solid rebound in China, the World Bank expects growth prospects in other
emerging market and developing economies, including South Africa, to be severely hamstrung by the coronavirus’s impact on consumption and investment.
Janet Yellen’s statement “I think we need to get through these dark times before the vaccination programme enables us to get back to life as we knew it” is hair-raising and so is WHO Director-General Tedros Adhanom Ghebreyesus’s recent warning that “the world is on the brink of a catastrophic moral failure” due to the inequitable access to vaccines, and “the price of this failure will be paid with lives and livelihoods in the world’s poorest countries”.
The South African government and other debt-ridden governments have no room for further fiscal policy measures to preserve lives during the pandemic. South Africa and many other developing and underdeveloped economies simply do not have the means to get through the “dark times”. They had to end their income-relief programmes for citizens who have lost pay and jobs as a result of the pandemic. Nor do they have funds to secure and ensure the roll-out of vaccination programs.
That is why it is so senseless for the government to ban the sale of alcohol and forego tax income on it. The entire industry is at risk, while job losses and starvation are facing many of the country’s people.
Poor countries’ plight
South Africa is now part of the world’s poorest countries desperately in need of support during the coronavirus pandemic. South
9 PERSONAL FINANCE | 1 ST QUARTER 2021 WEALTH•INVESTMENT•PROSPERITY
Africa and other poor nations cannot afford to borrow more as they are in a severe debt crisis inter alia as a result of the major disruptions in the global economy caused by the coronavirus pandemic.
Yellen, previously US Federal Reserve chair from 2014 to 2018, comes most recently from the Brookings Institution and is acutely aware of the poorer countries’ and specifically Africa’s dire debt problem. In April 2019 already, Brookings warned about an impending debt crisis in Africa and recalled that Africa’s past debt crises have been devastating.


The tendency of the South African government over the past few years was to impose austerity measures and cut expenditure to reduce the fiscal deficit. According to Brookings, similar actions during the debt crisis in the ’80s did not work: they had severe impacts on social spending and caused severe hardship. In
US relations and investment
South Africa is likely to benefit strongly from improved relations with the US. The new Biden administration is a valuable and strong ally of South Africa: we are the US’s largest trade and investment partner in Africa, while the US is South Africa’s third-largest export market. President Biden has promised greater US investment into the South African economy. The tariffs on imports of aluminium and steel imposed by Trump are likely to be revisited, and Biden is likely to overturn the Trump administration’s revocation of South Africa’s “developing country” status in 2020. It means that South Africa will again enjoy the preferential trade treatment for purposes of US subsidies and countervailing duty investigations.
The Biden administration is also likely to strongly support the African Continental Free Trade Area initiative that aims for Africa to become self-reliant.
WEALTH•INVESTMENT•PROSPERITY PERSONAL FINANCE | 1 ST QUARTER 2021 10
Private sector funding
I still believe that President Ramaphosa’s Economic Reconstruction and Recovery Plan is feasible, but it is still a mystery how it will be funded. The South African government will be unable to contribute as, according to Mike Schussler, chief economist at Economists.co.za, in a piece on Bloomberg, “the shouts for funding will become screams as state-owned enterprises like Eskom, the SABC, Denel and others will need money from the fiscus”.
The stimuli have to come from the private sector as well as the savings industry, specifically retirement funds and financial institutions.
I am on record – and took a lot of stickthat I supported Cosatu’s original proposal of the effective reintroduction of prescribed assets for all retirement funds, life assurance industry and assets managed by the Public Investment Corporation, as it makes sense. Furthermore, by setting minimum exposures to investments in domestic developmental projects, such as in infrastructure and green energy, the stage will be set for much-needed investment in the economy, as it is one of the crucial pillars of economic growth and employment.
Debt relief
South Africa and other heavily indebted developing countries should be able to join the current list of 39 countries eligible or potentially eligible for HIPC Initiative assistance where 36 are receiving full debt relief from the IMF and other creditors.
According to IMF factsheets, the HIPC
Initiative was supplemented by the Multilateral Debt Relief Initiative (MDRI). The MDRI allows for 100-percent relief on eligible debts by three multilateral institutions – the IMF, the World Bank, and the African Development Fund – for countries completing the HIPC Initiative process.
pandemic and safeguarding the lives and livelihoods of millions of the most vulnerable people. Since it took effect on May 1, 2020, the initiative has delivered about $5 billion in relief to more than 40 eligible countries”.
But the devastation of the pandemic is such that much more should be done. Countries such as South Africa will not be able to get out of this hole. This is especially true given the World Bank’s current view that “risks to the outlook are tilted to the downside”. Debt service suspension could or should make way for the partial cancellation of debt.
In June 2005 the G8 finance ministers agreed to provide enough funds to the World Bank, the IMF and the African Development Bank to cancel $40 to $55 billion in debt owed by members of the heavily indebted poor countries.

Partial cancellation of debt or blanket debt relief for highly indebted poor and developing countries such as South Africa will enable these countries to embark on a sustainable growth path again.
Countries must meet certain criteria, commit to poverty reduction through policy changes, and demonstrate a good track record over time. The IMF and World Bank provide interim debt relief in the initial stage and, when a country meets its commitments, full debt relief is provided.
According to the World Bank’s Brief on Covid 19: Debt Service Suspension Initiative (DSSI), dated 12 January this year, the World Bank and the IMF urged G20 countries to establish the DSSI “to help countries concentrate their resources on fighting the
The silver bullet is, to put Yellen’s words into the South African context, massive domestic and international support to “defeat the pandemic, provide relief to all South African people, and then make long-term investments that will help the economy grow”.
Ryk de Klerk is analyst-at-large. Contact rdek@ iafrica.com. The views expressed above are his own. You should consult your broker and/ or investment adviser for financial advice. Past performance is no guarantee of future performance.

11 PERSONAL FINANCE | 1 ST QUARTER 2021
Debt relief for poor countries will enable them to be sustainable again.
INFLATION COMING TO AN ECONOMY NEAR YOU?
Could Covid-19 be the catalyst that finally lets the inflation genie out of the bottle? Now is a good time for investors to consider how it could impact them. Sahil Mahtani and Russell Silberston explain why they think inflation risk has increased.
We haven’t had a sustained period of price rises for years. Could the coronavirus be the catalyst that finally lets inflation loose? Now may be a useful time for investors to think through the portfolio implications of a more inflationary environment.
What causes inflation?
The massive stimulus implemented by central banks to help economies recover
from Covid-19 has sparked speculation in some quarters that inflation may follow. Traditional economic theory certainly suggests that a major expansion of central banks’ balance sheets should drive up prices. However, the relationship between money supply and inflation only holds over multi-decade periods. In the shorter term, inflation is tough to predict. That was amply demonstrated following the 2008/9 Global Financial Crisis (GFC), when widespread
forecasts that prices would start increasing –in response to super-accommodative monetary policies – proved wide of the mark.
That inflation has been subdued in the decade since partly explains why many investors seem sanguine about the inflation outlook now. We hesitate to write these words, but this time it could be different: we see a significantly higher risk of inflation in the next 10 years than in the last 10.
12 PERSONAL FINANCE | 1 ST QUARTER 2021
WEALTH•INVESTMENT•PROSPERITY
Why 2020 isn’t 2008
Remember ‘Helicopter Ben’? That was the nickname given to former United States Federal Reserve Chairman Ben Bernanke, whose strategy following the GFC was to shower the US economy with money. Partly because of his policies, the US monetary base expanded 5.5 times between January 2008 and November 2020, while the consumer price index rose only 20 percent.
So why haven’t prices increased in response to the expansion of the money supply? One theory is that, to get going, inflation requires a double-whammy of monetary expansion and the right policy environment. Specifically, governments must be:
Targeting fiscal expansion while being reluctant to impose higher taxes to pay for it.
Aiming to lower the unemployment rate. We didn’t have these twin policies following the GFC. But we do now, implemented by governments trying to deal with the immense economic and social challenges of the pandemic.
Two other developments make inflation more likely:
1. The shift by many central banks to ‘make-up’ inflation strategies, under which inflation is allowed to run above the target to compensate for periods when it ran below it (until very recently, most central banks aimed always to keep inflation below the target).
2. The retreat from globalisation, which
for many years has held down prices by allowing companies to shift production to low-cost locations.
In combination, these factors could finally unleash the inflationary consequences of the money-supply expansion following the GFC and the coronavirus pandemic.
Why 2020 isn’t the 1970s That said, we don’t expect a re-run of the soaraway prices of the 1970s. That type of inflationary episode is extremely unusual, because it requires a set of circumstances that come together only very rarely:
Significant inflations ferment over many years and require multiple policy missteps based on analytical errors.
They result from a concatenation of numerous factors, both domestic and international.
Moreover, certain specific drivers of the 1970s inflation, such as a supply-side oil shock, are unlikely to recur. So we see a very low chance of runaway prices now. Nevertheless, today’s economic and social backdrop, which we explore below, might be conducive of modestly higher inflation than has dominated the post-GFC era to date.
Some inflation-limiting factors are weakening
As economist Edward Yardeni has put it, there have been four powerful deflationary forces in recent decades: détente, disruption, debt and demography – to
which we would add ‘disparities’. Some are intact, but others are weakening.
• Détente. If conflict is inflationary, peace is deflationary. The years immediately following the GFC generally featured cooperation among the major global powers. Status: détente seems to be ending, with superpower competition in security and trade intensifying. This is likely to contribute to inflation pressures.
• Disruption. The shift to e-commerce is thought to have subdued inflation by increasing price competition (by as much as 0.23 percent every year, according to one study). Other disruptive technologies, such as automation and artificial intelligence, are believed to have similar effects. Status: intact.
• Debt. In the short-term, consumption and GDP growth accelerate when debt levels rise. But in the longer term, increases in household debt have the opposite effect, reducing growth rates. Debt has been rising in much of the West. Status: intact.
• Demography. Demographic trends –specifically, rising life expectancy and falling birth rates – are thought to be disinflationary. But the jury is out on the extent to which these effects are offset by related trends, such as the growing participation of women in the labour force. Status: studies suggest demographics’ impact on global growth peaked in the mid-2010s. If that’s right, this check on rising prices should weaken.
• Disparity. Wealth inequality has increased in recent decades. This depresses
13 PERSONAL FINANCE | 1 ST QUARTER 2021
WEALTH•INVESTMENT•PROSPERITY
inflation because richer people tend to save a bigger proportion of their income; consequently, concentrating wealth in their hands reduces consumption. Status: intact, but a wild card. Global coordination of tax policy could start to weaken or even reverse the ‘rich-get-richer’ trend.
Taken together, we think these five factors suggest that the outlook is for marginally higher inflation, but still in the context of a period of low inflation.
Pressures building in the US?
Finally, we take a deeper dive into the inflation outlook for the US. Several dynamics suggest a higher chance of inflation following the Covid-crisis than after the GFC, including that:
The millennial generation (20-40) is now forming households and taking on debt; the deflationary impact of the baby-boomer generation is weakening.
The banking sector is healthier than after the GFC, with a greater ability to lend.
The US government appears more willing to expand its balance sheet, while (as noted earlier) the US Federal Reserve is likely to let the economy run ‘hot’.
In our view, inflation looks more likely in the US than in other major economies, given the stronger deflationary headwinds in Japan and the eurozone, and China’s more balanced inflationary outlook. In the table below we contrast the status of inflationary/ deflationary pressures in the US now and following the GFC: green is pro-inflationary, red is deflationary, and amber is neutral.
Inflation: prepare for the risk of a modest return
Overall, we think the chances of inflation taking hold in the next decade are significantly higher than they were after
the GFC, particularly in the US. Inflationary pressures are mild at present and we don’t expect a return to the 1970s. Moreoever, inflation tends to take time to get going. But investors should keep a close eye on
inflationary dynamics and be prepared for how they may affect portfolios.
Sahil Mahtani is a strategist at the Ninety One Investment Institute and Russell Silberston is a portfolio manager at Ninety One.
Economic conditions after the general financial crisis of 2008 versus those after the Covid-19 crisis of March 2020
Household balance sheets
Post-GFC
Households heavily indebted, with an ageing population (boomers) entering a deleveraging cycle High debt-service costs consume income
Housing market Deflating housing bubble weighs on household balance sheets and consumption
Demographics Sharp decline in working-age population growth; ageing population trend
Financial sector Overleveraged Regulation forces balance sheets to shrink
Non-financial corporate sector Relatively healthy balance sheets with ability to take on leverage
Monetary policy Aggressive easing supports assets prices and a wealth effect
Fiscal policy Supportive fiscal policy, particularly financial-sector guarantees
Real incomes
Real incomes declined and then stagnated in the years immediately after the GFC
Post-Covid-19
Households have deleveraged and debt service costs are at record lows (partly due to very low interest rates) Millennial generation entering a phase of life when borrowing increases
Relatively healthy housing market, supported by cheap borrowing and millennial household formation
Working age population growth troughing Large millennial generation enters a higher-spending phase
Banking system is relatively healthy, though question marks remain over pandemic impacts Some deregulation
Corporate leverage is extended and debt service is somewhat elevated, but not at previous highs
Very aggressive easing supports asset prices, a wealth effect and corporate growth
Strong fiscal support with direct increase in money pumped into the real economy
Real incomes have risen due to fiscal support
The pace of the recovery and whether there is additional fiscal support will determine whether or not this gain is maintained
14 PERSONAL FINANCE | 1 ST QUARTER 2021
DO YOU NEED TO REGISTER YOUR SMALL BUSINESS?
Got a side hustle? Newly self-employed? Working in the gig economy? Anna Rich answers your questions on why, when and how to register your business – and whether it’s really necessary.

WEALTH•INVESTMENT•PROSPERITY
PERSONAL FINANCE | 1 ST QUARTER 2021 15
Is this the first you’ve heard about the possibility of registering your business?
If so, whether you realise it or not, your business is probably a sole proprietorship (or “sole prop”). You run your business in your own name, and haven’t jumped through any hoops in terms of legalities –besides perhaps getting a trading licence if your municipality requires it.
As a sole proprietor, there is no clear line between your personal assets and the assets of the business, because your business is not a separate legal entity. Even if you’ve given your business a name, as a sole proprietor you only have to file one tax return, which includes both personal and business income.
First principles
It’s very important to separate your business finances from your personal finances, says Petro Bothma, group enterprise development manager and programme manager for the SME Toolkit at Business Partners. “I cannot stress that enough. Even if you bake cupcakes for home industries, or sell products at a weekend market, and make very little profit, keep the money separate. If you have only one bank account, it just muddles things.”
Bothma takes this advice a step further, urging anyone with a small business to “be serious about it”. “Keep records of your cash flows; keep every invoice, every receipt.” These records could allow you to claim tax deductions.
If you are disciplined about keeping financial records, it is easier for an accountant to help you if you decide to register as a private company, and it’s easier to source finance and to seize opportunities that arise, she adds.
Bothma has particular insight into missed opportunities. Business Partners and other financial institutions administered relief programmes to help businesses impacted by Covid-19 (if they were financially viable prior to the pandemic). To qualify, businesses had to be formally registered, and show tax and regulatory compliance. “Many entrepreneurs who applied didn’t have financial records, and were using
their business and personal money interchangeably,” she says. “So they missed out.”
Types of businesses
Companies come in different forms and legal structures. Our government sets out the standards for running companies in the Companies Act of 2008, which includes the terms for legally forming a company (known as incorporation), registering, organising and managing it. The Act also provided for the establishment of the Financial Reporting Standards Council to advise on requirements for financial record-keeping and reporting by companies.
Working on the assumption that you’re running a business to make money, let’s put non-profit companies aside. Non-profits are for public benefit, or to promote a cultural, social or group interest.
For-profit companies include public, private and personal liability companies. A personal liability company is used by professionals like lawyers or doctors, and a public company offers the public the opportunity to buy shares. The type you’re most likely to look at forming legally is a private company.
What about a close corporation? This was a similar entity to a private company, only with fewer legal requirements. But when the new Companies Act took effect, no new close corporations were permitted to be registered.
To register or not to register as a private company?
“It isn’t as simple as a yes or no,” says Bo Bissict. “You need to look at your particular situation and work out what's best for you.” Bissict is co-founder of Govchain, which helps their clients with company registration and compliance. “If you’re a small, simple company not looking to grow anytime soon, then you’re probably better off trading as a sole proprietor. If you have plans to build your business, then you’re likely to want to register it.”
Ideally, we want to encourage small businesses to register and grow, says Jacques Sibomana, founder and managing
director of Kuba Technologies, a digital platform that aims to unlock the potential of small businesses. “But we advise business owners that they need to be emotionally ready to take the step of registering, as it is not as smooth-sailing as it might seem.”
“Do you really need to go through the hassle of registering a business?” asks Bothma. “There’s a lot of admin involved, and thereafter, a private company is subject to several legislative requirements. So start with ‘why?’” she advises. “Ask yourself ‘Why do I want to register?’”
Question 1: Do you need to protect your personal assets?
“As a sole prop, you’re trading in your own personal name, so if anything goes wrong, you and your personal assets are liable,” explains Bissict. “Your creditors will take everything – your house, your car,” adds Bothma.
On the other hand, a registered company is a separate legal entity. “The legal aspect of limited liability is one of the greatest innovations in modern economic history,” says Bissict. “This means that if a registered company gets into debt, the owner’s assets are protected and only company assets are liable,” he explains.
“This holds true unless you have provided security for the company’s debt in your personal capacity,” Bothma notes.
Consider the level of risk your business poses to your personal assets. “If you’re doing something small and safe like selling orange juice at a market or freelance web work for clients, it’s fine to be a sole prop, but if it’s anything risky, you’re safer having a registered company,” says Bissict.
Bothma flags the implications for your business if you are married in community of property, the default in South Africa if you did not set up an antenuptial contract.
Spouses married in community of property own all assets jointly. “But being married in community of property also entails that you are liable, in full, for all debts and liabilities incurred by your spouse before and during the marriage,” explains Ann-Suhet Kamffer, who is part of the litigation team at Van Deventer and
16 PERSONAL FINANCE | 1 ST QUARTER 2021 WEALTH•INVESTMENT•PROSPERITY
Van Deventer Incorporated. “It is possible for creditors to claim from a business owned by one spouse to settle outstanding debt of the other spouse.”
Registering a private company (proprietary limited) does not exclude the company, or its assets and liabilities, from the marriage, adds Kamffer. “The liabilities of the company also form part of the debt of the joint estate, which is owned and managed by both spouses, so both are held liable for its payment.”
There is a way to avoid this scenario. “If both parties agree,” says Kamffer, “in terms of Section 21 of the Uniform Rules of the Court, they can apply to the High Court to change the status of their marital regime. The court must be satisfied that the rights of creditors of the parties are preserved and no other person will be prejudiced by this amendment.”
Question 2: Could you pay less tax if you registered your company? Again, there is no simple answer; it depends on your particular circumstances. “If you’re a sole proprietor, you’re taxed at the rates that apply to you on a personal level, but if your business is registered as a private company, then the company is generally taxed at a flat rate of 28% of profit,” says Bothma. ”If you earn very little from your sole proprietorship, you might pay no tax at all.”
For the 2021 tax year, if you are younger than 65, and earn less than R83 100, you are not liable (with some provisos) to pay any income tax. After that, if you earn up to R205 900, you are taxed at 18% of taxable income. And so on it goes, through seven different tax brackets, to the top bracket at which you are taxed R559 464 plus 45% of taxable income above R1 577 300. (See “rates of tax for individuals” on the SARS website, sars.gov.za.)
“People often avoid registering a company because they think it's simpler running it through their own personal accounts,” says Bissict. “But at the end of the day, all the transactions need to be reported to SARS and it’s often easier to do this through a separate single purpose entity rather than mixed in with your own personal tax.”
If your business is small, with an annual turnover of R1 million or less, this is known as a micro business within the tax framework – and it might qualify for turnover tax. These tax rates are low, with turnover of up to R335 000 taxed at 0%; R335 001 to R500 000 at 1% of each R1 above R335 000, and so on. This could apply to you, whether you are operating as an individual (sole proprietor) or as a registered private company. Though you don’t need to be registered with the Companies and Intellectual Property Commission (CIPC) as a private company, you do need to qualify for these rates (check this on the turnover tax page on the SARS website), and if you do, you need to register with SARS for turnover tax. Another positive of turnover tax is that it simplifies your need for accounting/ record keeping, says Bissict. It replaces income tax, VAT (unless you decide to stay in the VAT system), provisional tax, capital gains tax, and dividends tax.
Perhaps you’ve registered with the CIPC, and are playing in the “small business corporation” space, rather than at a “micro” level. “SARS is doing good work to assist with promoting growth in small businesses,” Bissict notes. “They recently introduced a tax type for Small Business Corporations (SBC), which can reduce a small business’s taxes.”
Find out if your business qualifies as a Small Business Corporation by going through the checklist on the Tax Tim website (taxtim.com). Two of the key determiners are that your business is
registered with the CIPC, and that its gross income is less than R20 million in a financial year. They also have a handy Small Business Taxable Income calculator on their site.
Question 3: Would registering allow you to access more opportunities?
“In many cases, registering as a private company is the way to go,” says Bothma. “If you want to submit tenders to government, you have to be registered. And corporates often work only with registered companies.”
“By registering your company, you are formalising it to the world,” says Bissict. “People prefer dealing with registered entities as they feel safer.”
Sibomana attests to this. “Most companies want to work with a registered entity with clear legal documents and a business account to avoid fraud and other issues,” he says. “And consumers see you as more credible too.” But he has also found that you experience a shift in mindset: “Your behaviour changes when your business is registered. You start taking greater responsibility, as you wish to see it grow.”
Besides opening up the possibility of landing government contracts, “the government offers training and financial incentives that are not available to unregistered companies,” adds Bissict. “This was clear during lockdown when the government excluded informal traders from operating as essential services.”
Another set of possibilities that could open up if you are registered is B2B, which means business-to-business – businesses working with other businesses, explains Bissict. “In this large trade sector, products and services are supplied to companies. Some companies only work with other registered companies, and some offer significant discounts to registered businesses. We’ve heard of people
17 PERSONAL FINANCE | 1 ST QUARTER 2021
WEALTH•INVESTMENT•PROSPERITY
dropping their expenses by 10 to 15% by registering their companies.”
Bothma says that if you are an Exempted Micro Enterprise (EME), and more than 50% black-owned, or a qualifying sole enterprise, with an annual total revenue of
R10 million or less, you can apply to various corporations for supplier development.
Another benefit to registering as a company is when you need finance, says Bothma. “Once you start buying business assets – perhaps a fancy machine from
China, or a vehicle, or a commercial property – it’s much easier if you’re a registered company.” Sibomana agrees: “Once you register your company, this sets you apart, making it is easier to access finance.”
WHERE TO REGISTER OR GET HELP
If you decide to set up a private company – designated by the abbreviation (Pty) Ltd (for Proprietary Limited) after the name –the Companies Act requires that you register it as a legal entity with the Companies and Intellectual Property Commission (CIPC). The CIPC is tasked with monitoring and enforcing compliance with the Act: registering companies and corporate names, maintaining data, and regulating governance and disclosure by companies. You’ll need to fill in several forms and pay the accompanying filing fees. Visit www.cipc.co.za.
To register in person, find your nearest office by clicking “Access" on the home page of the CIPC website, then "CIPC Self Service Centres and Partner Sites". These might be closed temporarily, depending on Covid-19 regulations.
More of an online type?
On the CIPC home page, select “Register your Business”, “Register a Company”, then under “Register”, “Private Company with a Standard MOI”, if you don’t
need to customise the MOI. MOI? The Memorandum of Incorporation is the document in which the owner/s set out the rules for managing and maintaining the company. See what the standard MOI entails by clicking the link on that page. If it works for you, follow the fourstep process spelled out in detail on the website. Here’s the general idea:
• Register online as a customer to get your CPIC customer code.
• Deposit the company registration fee (R125/R175) into the CIPC account.
• Reserve your corporate name. It’s possible to use your company’s enterprise number instead.
• Register your private company with standard MOI by clicking on “Online transacting” then “Private Company Registrations”. After completing the process, you’ll receive an email requesting documents such as certified copies of the director/s ID and the name confirmation certificate, if applicable.
Or go through the collaborating bank
First National Bank offers CIPC registration, online or at a branch. From the www.fnb.co.za home page, click on “For my business”, then under “Value
Adds + Rewards”, you’ll find CIPC.
Or outsource the process
“The dark side of starting a business is the admin,” says Bissict. “Incorporating, bookkeeping, contracts, taxes, payments. All this you must do even if you’re a small business. While trying to survive, these things are often done poorly, resulting in costly mistakes and distractions.”
If this makes you anxious, get a thirdparty company to take you through the process (for a fee), though there’s no getting around filling in forms. One of these companies is Govchain. “We’ve built a solution to create a pain-free entry point into the formal economy,” says Bissict. “We handle all the complexity of starting a business and dealing with compliance admin, while you focus on the real hustle which is building a successful product/service.”
Go to www.govchain.co.za
Another company that provides help to small business is Kuba, which offers tools and opportunities for growth, including company registration. Kuba also connects corporations with BEE compliant suppliers. https://kuba. services
18 PERSONAL FINANCE | 1 ST QUARTER 2021
WEALTH•INVESTMENT•PROSPERITY
Access the SME Toolkit, a free online resource
“The SME Toolkit consists of over 5 000 pieces of content on starting, managing and growing a business,” says Petro Bothma, group enterprise development manager and programme manager for the SME Toolkit at Business Partners. “For Business Partners, it’s our way of giving back, and of building entrepreneurship.” Go to smetoolkit.businesspartners.co.za.

19 PERSONAL FINANCE | 1 ST QUARTER 2021 WEALTH•INVESTMENT•PROSPERITY
PROVIDENT FUNDS ALIGN WITH PENSION FUNDS

The government’s retirement fund reform programme, which it initiated about a decade ago, was designed to encourage working people to save for their retirement and to discourage them from cashing in their retirement savings every time they changed jobs. March 1 sees another milestone in this reform: the so-called “annuitisation” of provident fund benefits at retirement.
Changes to retirement benefits for provident fund members, initially meant to come in five years ago and now scheduled for March, will see tax uniformity for all who contribute towards retirement, whether it be in pension funds or provident funds. These changes, under the Taxation Laws Amendment Act, will also encourage greater savings, something South Africa desperately needs as it seeks to crawl its way out of an economic hole.
Dolana Conco, regional executive of consulting at Alexander Forbes, says: “One of the aims of retirement reform is to create a uniform retirement fund system for all types of retirement savings vehicles, such as pension, provident and retirement annuity funds. This will allow all members to receive the same tax treatment of the money
contributed and how benefits can be paid at retirement.”
Alexander Forbes Member Watch analysis shows that about half of members retire with less than one-fifth of their final salary to live on in retirement.
Many reforms have been implemented over the last few years, but it has been a long journey to this next vital step. “The changes are beneficial for most retirement fund members and encourage greater savings for retirement and address issues in the retirement system,” Conco says.
She says: “Currently, provident fund members can take their retirement benefit as a full cash lump sum and do not have to buy a pension (annuity) from a registered insurer when they retire. Pension fund members, on the other hand, must use at least two-thirds of their retirement benefit
to buy a pension, unless the total benefit is less than R247 500.”
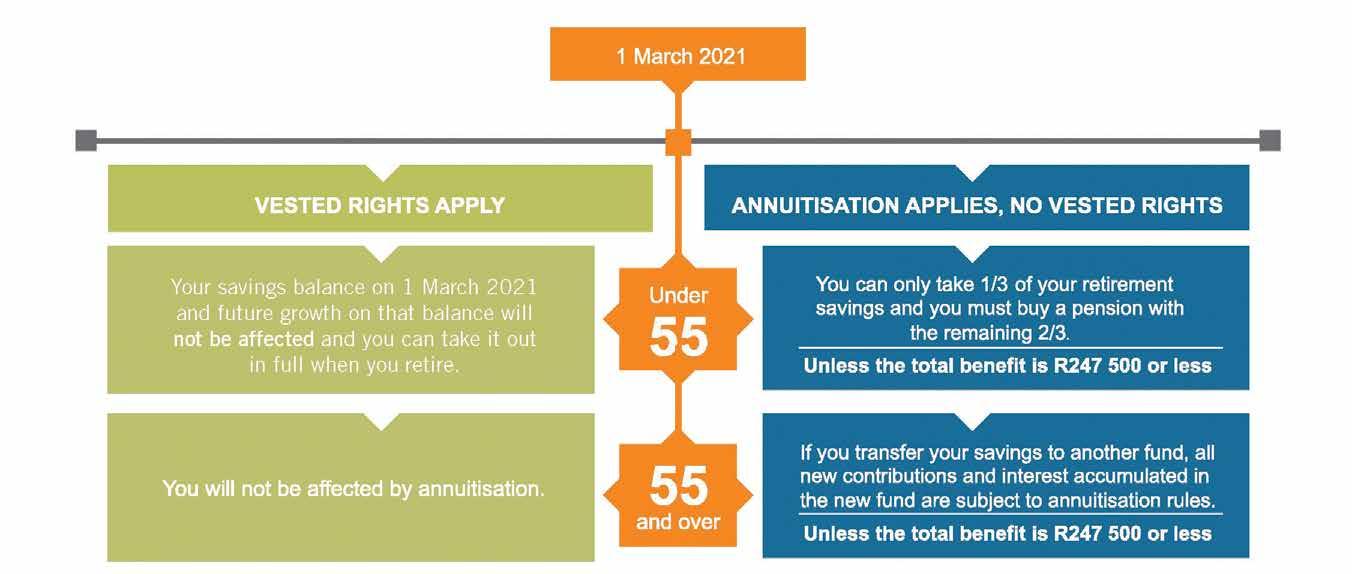
How members will be affected
From 1 March this year, retirement benefits from provident funds will be treated in the same way as pension funds for the part of the benefit based on member contributions. Conco says the changes for provident fund members are:
• They will have the same annuitisation rules as pension funds. This means that members will have to buy a pension (annuity) from a registered insurer with at least two-thirds of their retirement benefit, unless the total benefit is less than R247 500.
• Vested rights will apply – in other words, provident fund members will not lose their rights on their existing savings. Retirement savings will be ring-fenced as follows before
PERSONAL FINANCE | 1 ST QUARTER 2021 20 WEALTH•INVESTMENT•PROSPERITY
the new legislation takes effect:
• Any provident fund balance saved before 1 March 2021 plus the future growth on this until retirement won’t be affected and can be taken in cash on retirement.
• Members who are 55 years or older on 1 March 2021 will not be affected by this change at all if they stay a member of the same provident fund (or provident preservation fund), until retirement. This means that the retirement benefit will be treated in the same way as it is currently treated when these members retire. If these members transfer to another fund, they will still have vested rights, but any savings in the new fund will be subject to the new rules – they will have to buy a pension with two-thirds of the retirement benefit. The benefit of this change is that funds will be able to transfer members’ savings tax efficiently.
Considerations for employers and trustees
Many employers offer both a provident fund and a pension fund to their employees. Conco suggests that employers who have multiple retirement funds consider consolidating these funds, as pension funds, provident funds and retirement annuity funds will be harmonised in the tax treatment of contributions and the retirements benefits at the time of retirement. Consolidation requires other factors to be considered – for example, understanding the implications on vested rights when transferring provident fund members who are 55 or older on 1 March. Other factors include:
• The size of the funds,
• Potential cost savings or cost implications,
• Transfer requirements under Section 14 of the Pension Funds Act,

• Deregistration, and
• Liquidation requirements of the transferor fund.
“The changes to ensure further harmonisation between pension funds, provident funds and retirement annuity funds take effect on 1 March. It is important for trustees to start implementing plans to get ready for these changes. Amendments to rules, communication to members, and fund consolidation will be some of the matters to consider,” Conco says.
–
PERSONAL FINANCE | 1 ST QUARTER 2021 21 WEALTH•INVESTMENT•PROSPERITY
Supplied by Alexander Forbes
WHY SAVING IN A RETIREMENT FUND IS HARD TO BEAT
The recent superior performance of investment funds invested in offshore markets has led some financial advisers to advocate using discretionary funds, which are not restricted in their offshore exposure, to save for retirement, rather than retirement funds, which are. Martin Hesse reports that research by Alexander Forbes shows that this is not a good idea.

22 PERSONAL FINANCE | 1 ST QUARTER 2021
WEALTH•INVESTMENT•PROSPERITY
Retirement funds were designed for people to save for their retirement. Although they have built-in limitations, they have distinct advantages over discretionary investments. Do the advantages outweigh the limitations, even when
market conditions favour discretionary investments? Research by financial services firm Alexander Forbes shows that they do.
Many investment professionals are critical of Regulation 28, the rule under the Pension Funds Act that imposes limits on the extent to which retirement funds (which comprise occupational pension and provident funds, retirement annuity funds and preservation funds) can invest offshore and in higher-risk asset classes, such as property and equities. The critics maintain that the limits are too restrictive and that funds should have more flexibility to invest where they choose, to optimise long-term returns for their members.
A major point of contention is the limit on investing offshore, which restricts funds to a maximum of 30percent in foreign markets and a further 10percent in Africa outside of South Africa. In other words, a minimum of 60percent of any retirement fund portfolio must be invested locally.
Calls from the investment community for retirement funds to be allowed greater access to offshore markets have become louder in recent years because of the poor performance of JSE-listed equities and the ongoing depreciation of the rand against the major foreign currencies, both indicative of South Africa’s shaky economy. The stellar performance in 2020 of the United States stock market, driven largely by a handful of giant tech companies, further fuelled antiReg-28 sentiment.

Treasury circular
There was a flutter of excitement in November, when National Treasury, in an attempt to encourage foreign investment in South Africa, issued a circular that changed the status of JSE-listed rand-denominated offshore instruments to domestic instruments. Providers of exchange traded funds (ETFs) tracking offshore market indices saw this as a way of circumventing Regulation 28’s offshore limit. However, when the government became aware of this “loophole”, it withdrew the circular.
The offshore brigade was appalled at this
seeming about-turn. Some financial advisers went so far as to advise their clients to put as much as they could of their retirement savings into discretionary investments, in which the only offshore limits are the rand amounts imposed by the exchange control regulations. (Your offshore investment allowance is R10 million a year.)
How responsible were these advisers in giving such advice? Would you genuinely be better off having the bulk of your retirement savings offshore? Or are you better off in a retirement fund, even if the JSE performs poorly?
Media presentation
John Anderson, executive of investments, products and enablement at Alexander Forbes, and his team of actuaries set about finding answers to these questions, and he shared the results at a recent media presentation.
Unlike many countries, Anderson said, South Africa does not have a safety net for pensioners, apart from the paltry old-age grants for the destitute. It’s left to us as individuals to save for retirement, and, unfortunately, we don’t appear to do that very well. Fewer than one in 10 South Africans preserve their retirement savings when they change jobs throughout their careers, he said.
It’s in the government’s interests that we save enough for our retirement – it cannot afford old-age grants for everyone. But there is another good reason for maintaining a large pot of retirement savings within South Africa: it’s one of the country’s largest resources for economic development. In 2018, retirement fund assets totalled R4.2 trillion, according to the 2017/18 Annual Report of the Registrar of Pension Funds. At least three-quarters of this money is invested locally, mostly in listed equities and bonds. South Africa’s largest pension fund, the Government Employees’ Pension Fund, which manages assets of about R1.6 trillion, has half of its portfolio invested in domestic equity and 31percent in domestic government and corporate bonds.
23 PERSONAL FINANCE | 1 ST QUARTER 2021
WEALTH•INVESTMENT•PROSPERITY
Retirement fund tax breaks
The government provides powerful incentives for us to save in retirement funds, in the way of generous tax breaks on what goes into them, but it also restricts how you can use the money you have saved. The major features of retirement funds are:
• You can deduct your contributions from your taxable income. The tax break applies on contributions up to 27.5percent of your annual gross remuneration, and up to R350 000 a year. If you contribute more, you can roll over the excess amount, to be deducted in a subsequent year.
• The investment itself is not taxed: income tax on interest earned, capital gains tax, and the 20 percent withholding tax on dividends do not apply to retirement funds.
• When you retire, you can take up to one-third of your savings as a lump sum, of which R500 000 is tax-free. With the remaining two-thirds (or more), you must buy a pension (annuity), which can take various forms. In these post-retirement investments returns are not taxed, but you do pay income tax on your pension.
• To counteract the generous tax breaks and encourage preservation, you are taxed heavily if you cash in your retirement savings when you change jobs or take the allowed once-off cash withdrawal from a preservation fund.
If you save in anything other than a retirement fund – for example, in a collective investment scheme such as a unit trust fund or ETF – you do so using after-tax funding. These discretionary investments are subject to taxes on interest, dividends and capital gains. However, there are no restrictions on deposits and withdrawals. Anderson said there are vehicles, such as tax-free savings accounts, which have some tax benefits. A rule of thumb, he said, is that the more flexibility you have, the fewer tax incentives there are.
He said it is important that you have a greater allocation to South African assets than offshore ones because your liabilities – your expenses, such as food, accommodation and debt repayments – are in rands. The volatile exchange rate can work against you both when taking money offshore and when bringing it home. “In three months (from August to November),
the rand went from R19 to R15 to the dollar, an increase of 26 percent. When it was at R19 people were jumping up and down saying we should go offshore. This is typical: at the point of greatest pain, people tend to make the wrong decisions, and forget about good investment principles,” Anderson said.
Alexander Forbes research Anderson’s team of actuaries first considered what the optimal offshore allocation would be for a retirement fund, bearing in mind the prudential requirements for such funds. They targeted returns of five percentage points above inflation, while seeking to keep investment risk as low as possible. Looking backwards over the past 15 years, the team found that the optimal offshore allocation would have been 40 to 45 percent. However, looking forwards, based on the Alexander Forbes house view of the markets in November, they found that the optimal offshore allocation was likely to be lower, at 25 to 27.5 percent. These figures are not far off the Regulation 28 limits and “nowhere near 100 percent offshore allocation recommended by some advisers”, Anderson said.
He said: “We believe additional flexibility would be welcome, but on the whole you don't need more flexibility than up to 50 percent. So our view is that a gradual raising of the current limits is desirable, but it should be done in a way that balances the other objectives that the regulations are aiming to achieve.”
The team then compared the performance of formal retirement savings with that of discretionary investments with a 100 percent offshore allocation over 35 years into the future. Their model considered a range of outcomes under different income brackets (contributing 15 percent of income) and under different equity return scenarios, where local returns were higher than offshore returns and vice versa. They took into account an average annual depreciation of the rand of 7.2 percent a year over the 35 years, and based their calculations on the 2020/21 tax tables adjusted for inflation over the period. They did not take investment costs into account.
The actuaries considered three scenarios: where offshore and local returns were roughly the same (base case), where offshore equities outperformed local equities, and where local equities outperformed offshore equities. The asset allocation of the portfolios was as follows:
• Retirement fund portfolio: local equities 45 percent, local bonds 25 percent, offshore equity 30 percent, in line with the Regulation 28 restrictions.
• Discretionary vehicle: 100 percent in offshore equities for the base-case scenario and the scenario in which offshore equities provided the best returns; 100 percent local equities in the scenario in which local equities provided the best returns.
The results, Anderson said, were quite staggering. They found that, under all scenarios, and whatever your income level, the retirement fund significantly outperformed the discretionary offshore investment, and this was wholly due to the tax benefits. And the more you earned, the more the tax benefits worked in your favour.
In the base-case scenario, where the average before-tax real (after-inflation) returns of the two portfolios were almost equal (retirement portfolio 5.58 percent a year; discretionary portfolio 5.60 percent a year), the after-tax real returns in the discretionary portfolio were:
• 3.82 percent for someone earning R500 000 a year. You’d need a real return of 7.55 percent to compensate.
• 3.44 percent for someone earning R1 million a year (8.10percent needed to compensate).
• 3.16 percent for someone earning R2 million a year (8.50percent needed to compensate).
In this scenario, for someone earning R500 000 a year, after 35 years the accumulated savings in the retirement fund was R7.3 million. In the discretionary investment it was just over half of that: R3.9 million.
In the scenario where the retirement portfolio delivered 5.60% and the offshore discretionary portfolio did better, providing an average annual pre-tax real return of 6.50%, the after-tax real returns in the discretionary portfolio were:
24 PERSONAL FINANCE | 1 ST QUARTER 2021
WEALTH•INVESTMENT•PROSPERITY
• 4.62 percent for someone earning R500 000 a year. You’d need a real return of 7.65 percent to compensate.
• 4.21 percent for someone earning R1 million a year (8.15percent needed to compensate).
• 3.91 percent for someone earning R2 million a year (8.55 percent needed to compensate).
In the third scenario, where local equities surprised investors and performed well, the advantages of being in the retirement fund were even more pronounced. Where the retirement portfolio delivered 7.27 percent percent and the discretionary portfolio

(now also invested in local equities) delivered a pre-tax real return of 7.50 percent, the after-tax real returns in the discretionary portfolio were:
• 5.51 percent for someone earning R500 000 a year. You’d need a real return of 9.50 percent to compensate.
• 5.06 percent for someone earning R1 million a year (10.10percent needed to compensate).
• 4.75 percent for someone earning R2 million a year (10.55percent needed to compensate).
The tax benefits do not stop at retirement, Anderson said. His team showed that outcomes in a formal postretirement vehicle such as a living annuity continued to surpass those offered by a discretionary investment.
Retiring offshore?
The situation becomes more complicated if you plan to leave the country at some point – for instance, if you aim to retire in Mauritius.

Anderson said that over the 35-year period modelled, you would still be better off investing in a local retirement fund. “Such a strategy would make sense for younger members who have that period of time and who don’t need to be overly concerned with shorter-term currency fluctuations.
“However, as the term to retirement decreases, it becomes increasingly important for the assets to be invested in a way that reduces shorter-term currency risk. This is because once one starts drawing an income, sequence-of-returns risk becomes important. Many retirees would find it hard to absorb the short-term currency fluctuations in their income in retirement,” he said.
Therefore, Anderson said, you would need to phase your investments into a vehicle that would better match the currency of your ultimate retirement destination. “This would need to be done carefully – and over a sufficient period to ensure short-term currency risks are smoothed out – in the period before starting to draw an income.
“For individuals close to or in retirement, it remains important for their investment strategy to reflect the currency they need their income in,” he said.
25 PERSONAL FINANCE | 1 ST QUARTER 2021
WEALTH•INVESTMENT•PROSPERITY
FROM PRETORIA WITH LOVE

For Hester van der Merwe, the Financial Planning Institute’s 2020/21 Financial Planner of the Year, there’s nothing boring about playing it safe. As the world grapples with one unprecedented disaster after the next, she has shown just how important it is to go back to basics. Linda Graham caught up with her.


26 PERSONAL FINANCE | 1 ST QUARTER 2021
Hester van der Merwe receives the Financial Planner of the Year Award from Lelane Bezuidenhout, chief executive of the Financial Planning Institute, at a scaled-down ceremony in October 2020.
Spend five minutes chatting to Hester van der Merwe and it feels like you’ve known her for years. The latest winner of South Africa’s most prestigious award for the financial planning profession has nothing to hide: she speaks with warmth and intelligence, and her wry smile and sense of humour defuses any awkwardness that might derail a first meeting between two strangers. For a planner at the very top of her game, this kind of humility is rare and refreshing.
“Trust is the single most important factor when dealing with somebody’s financial life,” she says. “It’s not something that can be developed overnight, so it’s vital to start the relationship in an open and honest way. I find that being professional does not exclude being friendly; creating an atmosphere where a person feels safe and where they know that their wellbeing is paramount.”
Van der Merwe, 51, has lived in Pretoria all her life. The youngest of four sisters – “a proper laatlammetjie” – she grew up in a “typical Afrikaans family” where her father Fanie was a government official and her mother Olivia was a housewife. Both parents were creative: “My mom taught me to love reading and she was an amazing gardener and baker. My dad was artistic and could draw anything he saw. He would have loved to have been a full-time artist, but he felt that he had to have a ‘responsible’ job to provide for his family.”
Tragedy struck the Van der Merwe family when Hester was only 12 years old: Fanie passed away after a prolonged illness, but thankfully his life policies and retirement plans were all in place and the family was able to grieve without having to stress about money.

“My mom had always done the household accounts, even when my dad was alive,” Van der Merwe says. “It was a process that took place behind closed doors, and she was never in a good mood on accounts day…”
As the years went by and Hester got older, she was sometimes allowed to watch if she promised to keep quiet. “Watching my mom gave me a sense of
how important it is to have order and method when dealing with finances,” she says. “I tried to copy her process with my own pocket money, and I learnt a hard lesson alongside her when she lost some money by trusting an unscrupulous adviser. I also started noticing the relationships that my friends’ families had with money, and I realised that there isn't a one-size-fits-all approach to creating and sustaining wealth.”
Lessons along the way
After studying law at the University of Pretoria, Van der Merwe began her professional career as an assistant to a blind attorney. Like a musician’s amanuensis, she listened attentively, took notes and transcribed dictations. “It was challenging to work in such close proximity with another person, but I learned the importance of building solid relationships, and to constantly improve on what I was doing,” she says.
Thereafter, she joined Boland Bank in the debt-collection department, where

she dealt with insolvent estates and accounts that had to be handed over to attorneys. Even though she found the environment harsh and unenjoyable, she stuck it out for seven years and taught herself to do her best regardless of the circumstances.
“After Boland Bank, I did a short stint at a firm of attorneys for more of the same,” she says. “We mainly dealt with the collection of micro loans and it was then that I properly understood how important it is for clients to understand the documents they sign. So many people don’t understand the terms of their loan agreements, and the consequences are often devastating.”
Even though the epiphany piqued Van der Merwe’s interest in financial planning, she never actually intended to become a planner. In 2003, after having taken a step back from work to raise her children, she was looking for a half-day job and joined a practice under the mentorship of Spalding Fourie, who was “an amazing planner”, in Van der Merwe’s words. His attention to
WEALTH•INVESTMENT•PROSPERITY PERSONAL FINANCE | 1 ST QUARTER 2021 27
Hester and her son Deon prepare to take a bike ride in the rain.
detail and his close relationships with his clients showed just how much was possible in the profession, and how rewarding it could be.
Inspired, Van der Merwe enrolled for a Postgraduate Diploma in Financial Planning at the University of the Free State. At first, this was “just to improve [her] spreadsheets”, but once the bug had bitten there was no turning back. She persisted with her qualifications until she was able to write CFP (Certified Financial Planner) behind her name.
She had finally found her professional calling. She worked at FNB for a few years, heading up a small team of advisers, and joined Ultima Financial Planners in 2015, where she has been given the freedom to carve out her own brand focused on practical advice, detailed planning and unwavering commitment to her clients.
The retirement challenge
“I mainly deal with clients around retirement age,” Van der Merwe explains. “It’s a strange time in a person’s life, full of stress and uncertainty. You typically retire when you're at the height of your profession; an expert with a wealth of knowledge accumulated over years and years. Then you retire and all that is left behind – you find yourself in a confusing world with a multitude of choices, so much financial jargon, an overload of information online and strangers who suddenly want to take care of your money … It’s a perfect storm.
“I always start off by creating a safe environment. I tell my clients that they might not have all the answers and neither do I, but if we work together then we’ll have a better chance of building a stable financial future.”
One particular client was kind enough to summarise Van der Merwe’s approach as follows: “Right from our first meeting, I was treated with respect and dignity. I had no idea what was going to happen to me financially, but Hester had my back and still has. Nothing has ever been too much for her. My endless enquiries and questions have always been handled with patience and kindness.”

Blushing faintly at the praise, Van der

Merwe nods: “You have to be aware of where your clients are in their lives at any particular moment, and be sensitive to their state of mind. That’s the only way you’ll get them to stick to a long term financial plan.”
And when she’s creating that plan, Van der Merwe sees no reason to overcomplicate things. “I have five planning tips that I almost always adhere to,” she says. “Live within your means; get rid of your debt; maintain an emergency fund; make long-term goals and live with open hands –be generous, in other words. These are simple values but they’re tremendously powerful, and they’re timeless. My parents lived by these values and I’ve tried to instil them in my own children, too.”
The human touch
Not content to rest on her laurels, the Financial Planner of the Year is currently in the process of becoming a certified financial coach – a relatively new field that combines pure financial advice with life coaching, to help clients not only become financially secure but also to embolden them to achieve more in their personal lives.
“Fintech is developing at an incredible rate and soon robo-advice will be the norm,” Van der Merwe says. “For financial planners to remain relevant, we have to offer what a machine cannot: compassion, ethical decision-making, friendship… all the human traits that combine to form trust. Coaching is a fascinating field and it’s the future of financial planning, in my opinion.”
Indeed, this forward-thinking professional devotes little time to dwelling on the past. Asked whether she would do anything differently if she had the chance to start all over again, she smiles her trademark smile and shakes her head: “I wouldn’t change a thing. We are formed as much by our successes as by our failures. It’s important to learn from our mistakes and try to become better versions of ourselves.”
Hester’s tips for aspiring financial planners
• Don’t settle for anything less than becoming a Certified Financial Planner.
• Surround yourself with a strong team –this will enable you to play to your own strengths.
• Always do what is right, not what is easy.
• Keep learning and pushing yourself. There are always ways to improve.
• Ask for assistance when you need it.
• Don’t be afraid to show your own vulnerability.
• Plan for the person, not the portfolio.
• If you have to, walk away firmly but with kindness. You can’t be everything for everybody.
28 PERSONAL FINANCE | 1 ST QUARTER 2021
WEALTH•INVESTMENT•PROSPERITY
Hester befriends an elephant and its handler on a trip to Zambia.
Top performing fund in South Africa*


The Truffle Sanlam Collective Investments Income Plus Fund, launched in September 2016, has been awarded a 2020 Raging Bull in the South African interest-bearing short-term category for the second consecutive year. Since inception, the fund has achieved an annualised return of 10.31% net of fees (52.15% cumulative) vs the benchmark of 6.91% (33.10% cumulative). Source: Morningstar as at 31 December 2020 *Full details and basis of this award are available from the manager.


Truffle Asset Ma nagement Truffle Asset Management (Pty) Ltd is an authorised Category I, II and IIA financial services provider, FSP number: 36584 (Date of Authorisation: 11/03/2009). Sanlam Collective Investments (RF) (Pty) Ltd is a registered and approved Manager in Collective Investment Schemes in Securities (CIS). Annual performance of the Fund vs benchmark: 2017: 12,99% vs 7,54%; 2018: 11,33% vs 7,25% ; 2019: 10,67% vs 7,29%; 2020: 6,19% vs 5,39%. Full fund performance from inception date and further details in respect of the fund can be obtained from the Manager or by referring to the latest MDD. You can view our full CIS Disclosure and FAIS disclosure on our website. Truffle operates independently from the Raging Bull Awards and is neither an associate or product supplier to Raging Bull. Registered address: Ground Floor, Lancaster Gate Building, Hyde Park Lane Business Complex, Hyde Lane, Corner William Nicol and Jan Smuts, Hyde Park, Sandton, Johannesburg, 2196. The value of experience.
learn more visit our website
To
www.truffle.co.za
THE ROAD TO UNIVERSAL HEALTH CARE
Covid-19 has placed greater urgency on the need for National Health Insurance, writes Eugene Yiga . Criticism that the government initiative will be fraught with corruption may be premature.

30 PERSONAL FINANCE | 1 ST QUARTER 2021
The coronavirus pandemic has taught us that a well-functioning health system is essential for a well-functioning society. It has also made people aware of the need for medical cover for all citizens.
“It’s our role to improve patient care, improve occupational health services, and improve the way we deliver services to the public,” says Dr Nicholas Crisp, a public health specialist now working with the Minister of Health on the implementation of the National Health Insurance (NHI) Fund. “There’s a lot of work to do but there’s a plan and it has already started to roll out.”
Part of that plan involves a focus on quality. And while there are centres of excellence in the private sector, Crisps admits that there’s a lot of work to be done in the public sector.
“There have been public sector programs to improve quality for some time,” he says. “There’s a national quality improvement programme, which is about to be rolled out. Once that gets going, we’ll have a number of quality learning centres at sites around the country, and a number of facilities will become pilots which we’ll learn from and which will be the gold standard to teach other facilities. Some of those initiatives already exist within provincial administrations. But this is a specifically designed system.”
One new organisation is the Office of Health Standards Compliance. It’s not yet adequately funded and is still finding its feet. But even though it has limited inspectors, they have started the process of getting the regulations converted into

standards and included as measurement tools.
“We’re working more closely with the Department of Health and the Office of Health Standards Compliance to build a programme of quality improvement,” Crisp says. “It’s going to be a long process, I’m sure, and some of the requirements to improve quality will require money, but not everything requires money. Clearly, if you need infrastructure improvement, that requires money. But there’s already a lot of money in the system committed to the improvements of many facilities. The trick is to get the personnel and labour unions involved.”
that we’re building into our systems,” he says. “That includes dealing with patients who try to defraud the system and structuring the Office of Health Products Procurement so that you don’t have massive tenders that are corruptible. The systems are also designed to flag any aberrant behaviour so that it can be investigated immediately.”
Crisp points out that his team has also designed the technical aspects of the system – with data structures, access, backups, storage, redundancy, and do son – in such a way as to prevent hacking. Also, capacity in the Department of Health will become the core of the Office of Health Products Procurement.
“We’re taking corruption extremely seriously,” he says. “There’s a whole unit to deal with both internal fraud and corruption as well as the external investigation arm. And then there’s the body that’s been put together with all the law enforcement agencies, which reports regularly to the presidency.”
Saving money
Tackling corruption
After all the instances of government corruption over the last decade, including the scandal surrounding personal protective equipment, many South Africans are wary about the potential for more malpractice with NHI. But Crisp is confident that this won’t be an issue.
“We have a risk management framework
The fund will aim to save money by doing things at the lowest cost (without sacrificing quality) to extend benefits. For example, people would get coverage provided they entered the system at the lowest possible point, such as seeing a community health worker or general practitioner before seeing a specialist. By purchasing from the right providers and giving people the right incentives, Crisp believes that we can better identify gaps where needs exist and provide the right services to address those.
WEALTH•INVESTMENT•PROSPERITY PERSONAL FINANCE | 1 ST QUARTER 2021 31
Many South Africans are wary about the potential for more malpractice with NHI.
“I don’t want to oversimplify it because it’s complex reform – both financial reform and service delivery reform,” he says. “And there are many providers in many different teams. So we need every provider we can possibly get – public and private – to be accredited to have interoperable systems so that we can have portability of health services and don’t need to refer a patient to private hospitals when there’s a public hospital down the road. If we can purchase from the closest facility that’s accredited to provide a certain benefit, we can make sure everybody gets access to the care they need.”
Another challenge to overcome is individual buy-in. That’s why Crisp believes the benefits need to be clear and unambiguous so that the public can decide for themselves whether or not it’s still valuable to be part of a private medical scheme or if they’re happy to go with the

public sector. Obviously, people will consider the quality of the services, which is why it’s important that the fund only accredits the right providers.


“If I’m concerned that there are things important to me that won’t be covered by the fund, I’d like to have a medical scheme environment that allows me to purchase that kind of insurance elsewhere,” he says. “But it was never in the white paper that we’ll have two parallel systems, because then we’re back to where we are now. The intention is that [medical scheme benefits] are only on top of what’s not covered in the NHI benefits. But until we put those benefits on the table, this becomes an esoteric debate, and people are going to fight about the role of the medical scheme.”
Promoting change


To understand what people need, it helps to turn to the Government Employees Medical Scheme (Gems), which was formed as a service out of an agreement between the government as the employer and the Public Service Co-ordinating Bargaining Council. It covers around two million beneficiaries, making it, in the


words of principal officer Dr Stan Moloabi, “a microcosm of what’s happening in South Africa”.

“As Gems, we have a unique position of having access to policymakers,” he says. “We collaborate with the government all the time and have always been available to talk to the departments, whenever they need us for any support. We also interpret what the desire of the government is in serving its people and make inputs there. That comes in handy when we’re faced with situations like we’re faced with now.”
Ultimately, Moloabi emphasises that the introduction of a new way of funding healthcare is inevitable. Anybody “putting their head in the sand will be the big loser”. It’s the reason the attitude at Gems is to modify its way of doing business so that it isn’t left behind.
“We’ll be doing everything to ensure that our role can be defined, being cognisant of policy changes that we’ll need to align ourselves with,” he says. “We need to have a role that is meaningful and that helps in achieving universal health care so that we don’t end up becoming dinosaurs in a changing world. And I think all healthcare funders and medical schemes have to look at the future in terms of what role they will have to play. It’s all about modifying your business to be part of the future.”
Learn more at www.nhisa.co.za.
32 PERSONAL FINANCE | 1 ST QUARTER 2021
WEALTH•INVESTMENT•PROSPERITY
DOES FINE WINE MAKE FOR A FINE INVESTMENT?
While the South African wine industry as a whole battles enormous challenges, the upand-coming market in fine wines is generating excitement as an exciting prospect for investors, whether the eventual goal is profit or consumption – or both. Roz Wrottesley reports on what one wine merchant calls a “fine wine revolution”.

PERSONAL FINANCE | 1 ST QUARTER 2021 33 WEALTH•INVESTMENT•PROSPERITY
By any measure, the fine wine sector of the South African wine market is marginal, representing just five percent of the local bottled wine market and two percent of the whole. Yet there is real optimism about its potential as an alternative investment … and not just because, in the Covid era, enterprising people search diligently in the margins of commerce (or life) for good news. Certainly, good news is needed in and around the wine industry. Even before the pandemic, total exports were dropping (as much as 24 percent in 2019, due mainly to the three-year drought) and the industry was gripped by what Michael Fridjhon, leading South African wine writer and international judge, has described as a pricing crisis that threatens long-term sustainability. Consumers’ respect for the obvious creativity of South African winemaking has tended to mask the fact that our market is largely dependent on bulk buyers who are in the habit of paying excruciatingly low prices. We are second only to Argentina for cheapness – and when the rand sinks even lower than usual, we are even cheaper. According to Fridjhon, well over half of all bottled wines on sale in South Africa cost less than R50, and in the export market some Australian wines are priced at 12 times the average price of export wine from South Africa.
So it generates real excitement when an argument emerges that casts a positive light on low prices. The online wine merchant Wine Cellar (https://winecellar.co.za/ ) believes the fine wine market is poised for a boom, thanks to a rare combination of low prices and high quality, and is offering an investment and brokerage service to fit the moment. Our best wines are winning international plaudits, our wine style is distinctive, our reputation is growing, and the supply is limited – all ideal conditions for investment, according to Roland Peens, a director and former chief executive of Wine Cellar.
But of course, when it comes to the commodity called wine, there is another factor in play when it comes to investment:
the desire to drink it. The very sophisticated global market in fine wines has always been driven less by profitability than the desire to fund future access to sought-after wines for drinking. For example, an investor might buy three cases of a classic French Bordeaux at the launch price, hold on to them until maturity and then sell one case to cover the cost of the two kept for drinking. ‘Buy now and drink for free’ is the mantra of fine wine investors who are not in it just for the profit.
The investment product introduced by Wine Cellar in 2018 offers carefully curated parcels of wine of recent vintages that can be stored in the company’s cellars (four years of free cellaring comes with the package) until such time as investors decide to store it themselves, resell it or drink it. A new partnership with the fine art auctioneers Strauss & Co is designed to facilitate the resale market and the auction house has teamed up with wine specialist Higgo Jacobs to create a fine wine auction programme.

Wine Cellar's first rand-based Vintage Investment Portfolio (VIP) in 2018 was composed of South Africa’s greatest wines from the 2015 vintage. It was a sell-out and has since shown an annualised price growth of 30.4 percent, according to Peens. The latest portfolio, the 2021 Personal Investment Portfolio (PIP), was released in January and is based on the 2017 vintage.
The South African context
Considering that wine has been made in South Africa since the 17th century, the fine wine market is surprisingly young: only one, or at most two, generations old, according to Peens. During a wine investment webinar he hosted at the end of December, he acknowledged that the market is “tiny”: measured in wines valued at more than R150 a bottle, it amounts to less than two percent of the global market. In fact, the whole GDP of the South African wine industry, including wine tourism and bulk sales of wine, amounts to R34bn annually, with the fine wine industry accounting for R50m to R100m.
Peens has no illusions about the pricing
crisis in our industry: “Broadly, we are losing one percent of our vineyards per year: 20 years ago we had 110 000 hectares; it’s now down to 90 000 hectares,” he says. “And that’s probably going to continue with the glut of wine in the market today. Prices are low, stocks are high and the large producers might not even take their full quota (of grapes) next year. So we’re struggling at the bottom end of the market. But that does mean we still have cheap wines at the top end.”
In the investor’s favour, he points out that “we also have inflation here, so wines do go up in price every year, which doesn’t happen often in international markets with low inflation. We also have a currency that’s really volatile and an economy that’s even more so.”
Johan Malan, Wine Cellar's manager of investment and brokerage, says premium wines in South Africa are defined as those priced at R75 to R80 a bottle and up, so fine wines priced at R2 500 or R3 500 are targeted at a very niche segment in South Africa. “Yet there is still demand at that level, and I think that’s because people around the world are recognising that, in quality terms, South Africa has come a long way,” he says. In any line-up of 90-point (‘outstanding’) wines from around the world, the cheapest is always South African, he says: US$40 per bottle on average, compared to $106 for a 90-pointer from France and $65 for one from California. Another measure of fine wine pricing is the margin between the lowest price and the highest price in a particular market. In France, the most expensive wine is as much as 10 000 times more expensive than the cheapest; in South Africa the margin is 200 (R30 to R6 000).
Just a few years ago, the highest price locally was (a very rare) R1 000 to R1 500. “We are moving up the scale, but then so are the other countries, so the gap remains,” says Peens. Which makes this, in the words of Wine Cellar chief executive James Pietersen, “the best time to start investing: right at the beginning of the fine wine revolution”, before the industry’s successes do drive prices up.
34 PERSONAL FINANCE | 1 ST QUARTER 2021 WEALTH•INVESTMENT•PROSPERITY
Causes for optimism
Since 2018, the South African industry has celebrated three fine wines receiving the “perfect” score of 100 points, which is regarded as a major breakthrough and stimulus for the market. Last year alone, the internationally respected British wine writer Tim Atkin awarded two of those 100s, and gave ratings of 95 points or more to 32 Chenin Blancs and 97-99 points to 23 wines of his 153 South African “wines of the year”. The experts may disagree on a lot of things, but a round-up of their comments on quality are unanimously positive: Michael Fridjhon, 2018: “Our wines have been getting better every year. We know they have long been under-valued.”
[blob] Mike Ratcliffe, chairman of the Stellenbosch Wine Route and managing partner of the Vilafonté Winery, 2019: “On the back of a decade-long explosion in quality, the industry is now striving to realign quality with price.”
Jancis Robinson (well-known British wine critic), 2018: “South Africa is now well worth considering because the wines are seriously undervalued and a new wave of producers are making distinctive, age-worthy, appetising, definitively South African wines, both red and white.”
Tim Atkins (award-winning wine writer)
in his South Africa Special Report, 2020: Despite the well-publicised challenges it faces, South Africa is making the best wines in its history…. It has been a delight to see the general improvements in quality and the tentative emergence of a South African fine wine sector.

Boom, not bubble
The message is obviously getting out there, since vintage wines featured strongly in the exceptional growth in online sales experienced by Wine Cellar last year, driven by the general increase in online activity, and (just a guess…) wine-supply insecurity after the first liquor-sales shutdown. Jacobs is confident that the growth “is real, not artificial” – a boom, rather than a bubble, which reflects growing awareness of the quality and investment potential of South Africa’s fine wines in the context of a remarkably stable world market. Liv-ex, the global marketplace of the wine trade, described fine wine prices as a “picture of calm” in its November 2020 annual report. All the fine wine indices had shown gains in the first 11 months of the year, and the industry’s leading benchmark, the Liv-ex 100, had risen by 4.65 percent and reached
its highest level in two years. Amid the chaos of Covid-19, fine wine had offered investors “stability, variety and pleasure” in turbulent times, which had accelerated a growing trend, said the report.
Another positive trend, according to Jacobs, is a new openness – particularly in the UK – to the idea of New World wines (those that come from outside Europe, the UK and the Middle East) offering an alternative to the dominant classic wines, which are the standard-bearers of certain long-established wine-making regions and styles. “Consumers were always happy to experiment a little, but now, all of a sudden, Bordeaux, for example, is losing a little of its glamour,” he says. “People look at the numbers, and if a serious critic rates a South African wine on a par with a classic wine at 100 points – or even 95 points –they are willing to taste and experiment for themselves. I don’t’ think minds were open to that 10 years ago.”
Question #1: What about the secondary market?
When it comes to investing in a “passion asset” like wine – or art, or classic cars –the question is always: how real is the prospect of finding a buyer if you want to
WEALTH•INVESTMENT•PROSPERITY PERSONAL FINANCE | 1 ST QUARTER 2021 35
liquidate your asset?
By going into a joint venture with Strauss & Co, Wine Cellar is taking responsibility for developing the secondary market that will get investors the premiums their wines are worth at (or near) maturity. Strauss & Co Executive Chairperson Frank Kilbourn believes “the time is right to elevate South African wines to the same degree of collectability as the visual and decorative arts”.
Wine Cellar provides four years of cellaring free of charge (it currently has 450 000 bottles in its cellars in Cape Town), after which investors can remove their wines for future drinking, or trade them – privately, or through Wine Cellar. Wine Cellar charges a brokerage fee of 5 percent and a commission of 10 percent on all sales.
While Wine Cellar is confident that its investment portfolios will fuel a steady turnover of wine in the secondary market, it is very early days, and there is no doubt that this is an additional risk factor for would-be investors. Fridjhon is certainly sceptical – “not because the wines are not good, but because the market has yet to be developed,” he says. “The first few
sales did not show stellar prices across the board. A few collectibles did well, quite a few wines hovered around low estimate, and quite a few more were only sold by negotiation after the sale. So far, they haven’t created a safe space for investors to exit,” he says.
One sure thing is the way the wine market is going: in 2019 the venerable 45-yearold Nederburg Auction rebranded itself as the Cape Fine & Rare Wine Auction, in collaboration with British auction house Christie’s. Its mission is to “create an industry-led platform that will showcase the finest and rarest South African wines locally, and provide unique buying opportunities for wine enthusiasts, investors and collectors worldwide”.
Question #2: What makes wine increase in value?
“Part of the appeal of wine is that it is a natural product, which, once released, slowly but surely diminishes in quantity because people drink it. It’s not like a piece of art that exists permanently; there is less and less of it in the world,” says Pietersen. “As a wine gets older, you get less fruit showing through; you have a wine that
has moved on in character. It often softens (sometimes it needs to soften a bit more), you have a colour depreciation and your wine tends to move to a more savoury kind of spectrum. What is crucial when buying older wines is that you develop your palate.”
Question #3: What guarantee is there that a wine is as good as it should be when you buy it?
“There is no guarantee; fine wine sales have been based on trust for hundreds of years and they still are in the UK, the biggest fine wine market,” says Peens.
Today, you get much more certainty about the cork, but you have to make sure wine has been stored correctly and that you store it correctly. Then, if you do purchase, make sure you do so from a top seller. When we, at Wine Cellar, come across a parcel of older wine and put it on auction, it means we’ve tasted extensively and we’ve vetted the seller before we put our names to it. It certainly doesn’t guarantee the wine is going to be excellent, but it is about as good as you’re going to get, and we believe in it. That’s important.”

WEALTH•INVESTMENT•PROSPERITY 36 PERSONAL FINANCE | 1 ST QUARTER 2021
MONEY MARKET FUNDS SOME ARE MORE EQUAL THAN OTHERS
What could be more uniform, predictable and secure than money market funds? Samantha
Steyn says their uniformity is an illusion, and it’s dangerous to only rely on yield as the basis for comparison.
Money market funds offer a useful parking bay for cash, allowing you to earn better returns than bank rates with good liquidity. But when it comes to picking money market funds, investors tend to focus on one metric only: yield. By implication, this over-simplistic approach assumes that, aside from yield, all money market funds are equal – a common mistake which could place your investment at greater risk than you may have thought.
This focus on yield is especially problematic in today’s times, as a tough economic environment could see more business closures, which could directly affect the returns of money market funds that carry high levels of corporate debt. Given the current uncertain environment, it is therefore crucial to understand the nuances between various funds in order to ensure that you have selected the right money market fund for your needs. With that in mind, here is a simple guide to understanding and selecting a money market fund.
The basics
Beyond simply investing in cash, money market funds may also invest in other financial instruments, such as bank paper, corporate debt, state-owned entity debt and government treasury bills. However, these funds are also specifically limited to investing in short-term debt with a limit of 13 months and a weighted maturity not exceeding 90 days. Investment risk is therefore generally lower than income funds, which are able to invest in highduration debt, which increases the chance of a default given the longer investment horizon.
So how are some money market funds able to offer more attractive yields than others? There are essentially two options:
1. Getting the forecasts on interest rates right; and
2. Including a higher ratio of lower-rated debt.
Analysing which of these two themes may be at play is key to better understanding and ultimately selecting a money market fund.
Option 1: Making the right interest rate call
The underlying investments in money market funds can either take the shape of floating instruments linked to the Johannesburg Interbank Average Rate (Jibar), which is South Africa’s money market rate, or they can be fixed-interest instruments. Whether the portfolio is tilted towards fixed or floating rate investments will then depend on the portfolio manager’s interest rate view. The outlook of interest rates (and inflation for that matter) is an ever-changing reality, and is directly linked to money market funds’ yield.
For example, going into 2020, very few people – if any – could have predicted that interest rates would fall by three percent This meant that money market funds that had exposure to more floating rate investments would have immediately experienced a reduction in yield. By contrast, funds with more fixed rate investments would have been able to better protect themselves – at least temporarily – against the aggressive interest rate cuts.
37 PERSONAL FINANCE | 1 ST QUARTER 2021
WEALTH•INVESTMENT•PROSPERITY
The Cannon Money Market H4 Fund, for instance, had 75% fixed rate investments going into 2020, which gave the fund a considerable yield advantage.

As can be seen from the graph, money market yields have fallen considerably since December 2019. Not only that, but the yield curve has also flattened out as well, with the 12-month differential declining by 90 basis points over the course of 2020.
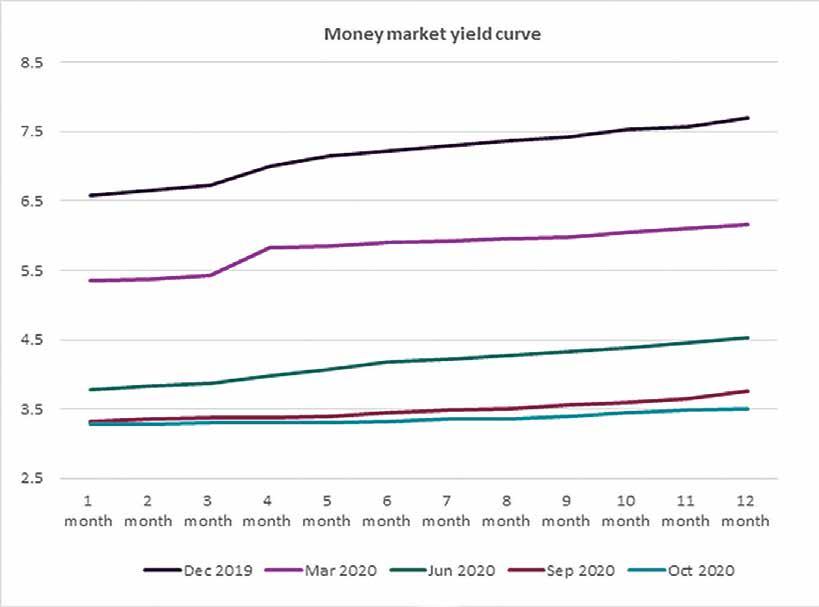
Understanding the nature of the underlying investments will therefore shed further light on the yields when comparing funds.
Also important to note is that as investments mature, fund managers are being forced to reinvest at today’s lower yields. The question on each manager’s mind is, therefore, when will interest rates start increasing? Getting this timing right will result in a relatively more attractive yield until the next interest rate move, and so the cycle continues.
Option 2: Introducing a higher ratio of lower-rated debt
Lower-rated debt carries a higher risk of default or non-payment, and therefore offers higher yields to investors as compensation for the additional risk at play. Corporate and state-owned entity investments, for instance, naturally come with higher yields in order to compensate investors for the higher associated investment risk.
So the allocation of fixed-rate versus floating-rate investments can cause a significant difference or dispersion in fund yields (especially when a black-swan event such as a pandemic sees a 300 basis point cut in interest rates within the space of a few months). But, overall, if you see a money market fund offering a relatively high yield, you would be wise to generally exercise some caution. While the yield may appear attractively high, this may be accompanied by increased risk.
When choosing a money market fund, investors should first analyse the fund’s minimum disclosure documents in order to assess the allocation of the fund’s investments to more risky entities.
This is especially important in current times where companies are experiencing a drop-off in revenues and cash flows, potentially leading to more business closures, a rising number of defaults and the inability to service debt. In a default scenario, it is not impossible for money market funds to experience capital loss.
Ultimately, money market funds are a great place to save for the short-term. Just be sure you understand the underlying make-up of the fund you have selected, and that you are satisfied with the nature of the investments and the amount of investment risk involved.
Samantha Steyn is the Chief Investment Officer, Cannon Asset Managers
38 PERSONAL FINANCE | 1 ST QUARTER 2021
Money market yield curve, December 2019 to October 2020
WEALTH•INVESTMENT•PROSPERITY
Source: Cannon Asset Managers
WHAT TO KNOW ABOUT LIFE ANNUITY GUARANTEES

A life annuity, also called a guaranteed annuity, is a pension you buy from a life insurance company that pays an income until you die. In the case of one with a guaranteed term, it pays out for a stipulated number of years, even if you die within that period. Linda Blom and Yusuf Moosa explain further.
In an ever-changing environment, the need for certainty during retirement has become more urgent and has resulted in a general shift to conventional life annuities among people entering retirement. Understandably, retirees are looking for the highest level of guaranteed income that their savings can buy, as well as needing their income to keep up with inflation. Most importantly, retirees want to ensure that their monthly income needs are met without added risks.
How will your income be determined?
Many factors determine the initial guaranteed income of a life annuity, such as:
• Your age;
• Your gender;
• Your life expectancy;
• The mortality rate in your particular insurance risk pool;
• Interest rates;
• Your desired income for a single or joint life;
• Your choice of growth in income (0-7 percent or CPI); and the
• The guaranteed term that you choose (0, 5, 10, 15 or 20 years).
What does “guaranteed term” mean?
A life annuity provides a guaranteed income until you die, irrespective of the
age you reach. The term on a life annuity determines the minimum years of guaranteed payment if you pass away within the guaranteed term. This ensures that your beneficiaries will receive an income for the remainder of the guaranteed term you chose when you took out the policy – either five, 10, 15 or 20 years. The higher the guaranteed term, the lower the initial income and vice versa.
If you choose not to have a guaranteed term, there will be no income payments to your beneficiaries when you pass away. This option will provide the highest initial income, but higher doesn’t necessarily mean that it’s better.
WEALTH•INVESTMENT•PROSPERITY
PERSONAL FINANCE | 1 ST QUARTER 2021 37 PERSONAL FINANCE | 1 ST QUARTER 2021 39
Bob’s story
Bob retires at 65 and invests R1 million in a life annuity with a five-percent annual increase in income. His initial monthly income for the various available guaranteed terms is illustrated in the table below:
As you can see, the initial income decreases as the guaranteed term increases. So, it may seem that the value of the shorter guaranteed term is the better option, as the income is higher, but this would depend on your individual circumstances and needs.
Let’s say Bob decides on the 20-year guaranteed term and then passes away in the fifth year. His beneficiaries will receive a monthly income with an annual escalation of five percent per year for the next 15 years.
Essentially, the chosen guaranteed term of 20 years means that the insurer must pay an income for at least this period. A starting income of R6 367 pm, escalating by five percent per year over a period of 20 years, equals total of income payments by the insurer of R2 526 371. This is more than 2.5 times the amount he invested.
If Bob lives longer than 20 years, he will still receive a guaranteed income until he dies. The risk of his longevity, therefore, is carried by his insurer.
Should I choose a shorter or longer guaranteed term?
Your choice depends on your individual circumstances. You need to know the answers to the following questions:
1. Have you saved enough for retirement? In other words, can you afford to leave an income legacy to your beneficiaries, or do you need the highest possible income during retirement?
2. Who is financially dependent on your income? Do you have an elderly parent who will need an income for the next 10 years if you pass away suddenly? You might have a disabled dependant in which case you could consider the highest guaranteed term possible that will provide an income for your dependant after your death. You could also consider a product that leaves a possible lump sum legacy. If you have no dependants, you won’t need to leave an income legacy and, therefore, you could opt for the higher income that comes without having a guarantee.
3. What is your medical history and current
health status? If your life expectancy is shorter due to ill health, you could consider the following:
• A longer guaranteed term to provide income for dependants after your death; or
• A product that will pay an income to you during your lifetime as well as a predetermined lump sum to your dependants after your death; or
• A product such as a living annuity where you have the freedom to determine the level of your income but that could leave a lump sum for your dependants after your death if any underlying capital has been preserved.
If you are healthy with a longer life expectancy, consider a shorter guaranteed term for higher income in combination with other income-, growth- and legacy-creating products. Your best solution could be a combination of products, not just a single life annuity.
One size doesn’t fit all
As we’ve illustrated, retirees’ varied income requirements set the scene for a wellrounded, diversified retirement income portfolio that could consist of multiple products. A single product or solution may not tick every box for you. So, combining retirement income products and features can ensure the best outcome for your retirement. Your financial intermediary should be able to blend a solution based on financial goals that are unique to your specific needs.
Guarantee term Initial gross income 0 R7474 5 R7298 10 R6938 15 R6617 20 R6367 WEALTH•INVESTMENT•PROSPERITY 38 PERSONAL FINANCE | 1 ST QUARTER 2021 40 PERSONAL FINANCE | 1 ST QUARTER 2021
Linda Blom and Yusuf Moosa are business development managers at Glacier by Sanlam.
LEAVING SOUTH AFRICA?
THIS IS WHAT YOU MUST KNOW ABOUT TAX
If you are planning on leaving South Africa, or have already left, there are key issues to consider regarding your South African tax status. And in a country with such a complicated, residencebased tax system, it pays to be informed.
William Louw elaborates.
PERSONAL FINANCE | 1 ST QUARTER 2021 41
WEALTH•INVESTMENT•PROSPERITY
Tax emigration differs from financial emigration. There is often confusion between the two concepts, and you'll sometimes fall into the trap of incorrectly assuming what actually applies to you.
In a nutshell, if you’re planning on relocating, or have already moved abroad, financial emigration from South Africa can help you access and transfer your financial assets out of the country. However, this type of formal emigration does not mean that you are automatically considered a nonresident for tax purposes. The South African Revenue Service (SARS) has its own criteria to determine your tax residency status and whether or not you should be paying tax in South Africa. SARS will examine factors such as how much time you spend in South Africa and where your family and assets reside. However, if you are indeed financially emigrating, the process can be used as additional proof of your intention to settle overseas.
Tax emigration means informing SARS that your tax status has changed, and that indicates how you should, or should not, be taxed in South Africa. The most important thing to note here is that, as a South African tax resident, you pay tax based on your worldwide income and your worldwide asset base. If you are not a tax resident, you only pay tax on your South African sourced income and South African sourced asset base.
Typically, you will engage with the South African government in three ways:
• SARS will determine how you’ll get taxed.
• The South African Reserve Bank (SARB) will regulate how yo ur money moves in and out of the country.
• Home Affairs will document your citizenship status and rights in and out of South Africa.
Taxpayer or tax resident?
There is a difference between being a South African taxpayer and a South African tax resident. A South African tax payer is someone who has to pay tax on or disclose income streams from South Africa. A South African tax resident is someone who has to
pay tax on their worldwide income in South Africa.
What are the steps needed to be taken for tax emigration?
Your tax residency status defines how you get taxed in South Africa and what you have to pay tax on to SARS. However, filing a tax return is determined by whether you need to pay tax and not on tax residence. Currently, there are three ways to change your tax status:
The ordinarily resident test
The first avenue involves the ordinarily resident test. This concept is relatively subjective. You'll usually be seen as ordinarily resident if your permanent home, to which you normally return, is in South Africa. However, the courts have held that anyone considered ordinarily resident includes:
• Those living in a place with some degree of permanence
• Those with a permanent home
• Those who have their belongings stored
• Those who regularly return to a place following temporary absences
If you are able to showcase the contrary to be true, this test will prove to SARS that your intention is not to be a South African tax resident but to reside elsewhere permanently.
The physical presence test
The second way is the physical presence test. This concept is entirely time-based and is only applicable to someone who was not at any stage during the relevant tax year considered ordinarily resident in South Africa. It’s important to take note: If your intention is to show that you no longer want to be a South African tax resident, you could be caught by the number of days you spend in the country. To be deemed tax resident, you will have been physically present in South Africa for a period, or periods, exceeding:
• 91 days in aggregate during the tax year under consideration;
• 91 days in aggregate during each year of the five tax years preceding the tax year
under consideration; and
• 915 days in aggregate during the above five preceding tax years. The third condition amounts to an average of 183 days a year. If you don’t meet all three requirements, you will be considered a non-resident.
Double taxation agreements
Double taxation agreements (DTAs) are internationally agreed-upon legislation between South Africa and another country. South Africa holds dozens such agreements with various countries and the main purpose of a DTA is to ensure that each country subject to the agreement knows what taxing rights they hold against relevant taxpayers.
A DTA will ensure that you are not unfairly taxed in both South Africa and the corresponding country. It provides a defense to double taxation and will determine where you must pay taxes on income received.
A DTA becomes relevant if you are earning an income in South African as well as abroad, or if you are a tax resident in South Africa (but have no income from a South African source) and you are earning income from a foreign source. This type of situation often gives rise to confusion as to where you can or should be taxed, especially taking into account that a South African tax resident is subject to tax in South Africa on their worldwide income.
What are the consequences?
Keep in mind, the onus falls on you to inform SARS once your tax status has changed and you are meant to do this during the tax year in which the change occurs.
I f you don’t notify SARS of the change, they have the right to assume that you are a South African tax resident, which entitles them to raise assessments and tax you when they shouldn’t. If there is tax due upon changing your tax status, SARS is allowed to levy administrative penalties for non-declaration and non-payment. These penalties can go up to 200% depending on the case in question.
42 PERSONAL FINANCE | 1 ST QUARTER 2021
WEALTH•INVESTMENT•PROSPERITY
When should tax emigration be reported?
Tax emigration should be reported in the tax return covering the period you change your tax status. As it is, you might be reporting to SARS much later than the actual event (given tax year cycles). However, it’s important to be aware of the changes that will apply retroactively when filing.
Reporting the change at a later date entitles SARS to demand you pay tax on the asset base you have at the time you make the change notification, not when it actually happened.
When would the taxes be due?
The day before you become a non-resident for tax purposes, you will be deemed to dispose of your worldwide asset base at market value. This triggers a Capital Gains Tax (CGT) event – also known as an exit charge.
back – all for tax purposes. However, any fixed property situated in South Africa is excluded from this equation as it is always subject to South African tax.
When you change your tax status, SARS will deem there to be an additional period of assessment due during the tax year. This will require a provisional tax return to be done if your taxable income exceeds R1 million in that tax year. If that is the case, your taxes will be due on the day you leave, even if the tax year hasn’t ended. If you fail to pay at this stage, and you do your return at a later time within the same period, SARS can go back to the date you left and claim a late penalty.

What happens when you change your South African tax residency?
The day before you become a non-resident for tax purposes, you will be deemed to dispose of your worldwide asset base at market value. This triggers a Capital Gains
• On the day of the change, you may have to report and pay tax on your South African sourced income
• After you become a non-resident, you are no longer required to submit a South African tax return, unless you still have assets left in the country that are generating streams of income.
It is imperative to understand that changing your tax residency does not mean that you automatically undergo financial emigration, and you may not even benefit from applying for financial emigration.
How to tax emigrate from South Africa
Changing your tax residency status is a laborious and admin-intensive process. You need to deal with several different parties. There are also a number of complexities to be aware of in advance when making decisions to change your tax residency. As
PERSONAL FINANCE | 1 ST QUARTER 2021 43
HOW DO OFFSHORE ASSETS FIT INTO YOUR ESTATE PLANNING?
When you own assets offshore, how you arrange to bequeath them to your heirs can get complicated, writes Willem van der Merwe.
While most people understand the importance of having a valid will in place as part of the effective execution of their estate planning wishes after their death, statutory requirements often become a little less clear for people who hold assets in different jurisdictions as part of their estate.
The complexity stems from the fact that we live in a world where, for the most part, borders have become little more than grey lines separating countries on a map. As such, it can be tempting to believe that the freedom of testation that South Africans enjoy, which affords you the right to leave your assets to whomever you please, applies everywhere. However, not all countries have the same rules as South Africa when it comes to dealing with the distribution of assets after death.
For this reason, if you hold assets in other jurisdictions, it is essential when drawing up your will that you seek advice about the estate planning regulations of those countries where the assets are held. It’s important to have a clear understanding of the global mobility of heirs and legatees and what is legally required to ensure the smooth transition of assets to your heirs.
Given that there is no one-size-fits-all solution, personal advice is the best course of action. However, there are a few basic principles that underpin all successful multi-jurisdiction estate plans.
The first concern is to make sure you have a clear understanding of whether each of the countries in which you hold assets offers the same freedom of testation as South Africa. Not all countries have similar rules to South Africa and some provisions in your will might not be enforceable in such a country.
If you hold assets in a country with forced heirship rules, these will provide specific guidelines on precisely how your assets must be distributed. In such instances, having a separate will dealing specifically with the assets held in each such country may be the most appropriate approach. This is particularly important if you want to avoid lengthy estate administration delays and even the need for possible legal battles by your heirs.
Where a separate will is not executed in the foreign jurisdiction, and the South
WEALTH•INVESTMENT•PROSPERITY
44 PERSONAL FINANCE | 1 ST QUARTER 2021
African letters of executorship are not deemed acceptable in terms of dealing with a foreign asset, the South African will would need to go through an onerous and often costly validation process before it could be accepted as enforceable in that country. On the other hand, having a separate will in place that aligns with the succession rules of the country concerned would streamline the process and allow the offshore assets and those of the South African estate to be dealt with simultaneously.
That said, simply having separate wills covering assets in various jurisdictions is not a guarantee of a smooth and simple estate administration process. It is imperative that these separate wills are aligned, otherwise the process can become incredibly complex and frustrating. At their most basic level, these wills should never be seen to contradict, supersede or replace one another. One of the most effective ways to avoid this is to look at the revocation clause in each of the wills, as well as any reference made to a specific jurisdiction.
It may also be necessary to amend some of the clauses in certain wills to clearly

indicate exactly which offshore assets or jurisdictions are dealt with in that specific will. This will ensure that none of the other wills are accidentally replaced or revoked.
It is essential that all the wills are thoroughly assessed to ensure they are not contradictory and align with the rules and regulations of each jurisdiction.
When drawing up a will, or wills, for assets held in multiple jurisdictions, being able to check off the following five considerations is a good starting point:
1. Have you carefully considered the types of assets? Although it might in certain cases be sufficient to have a single will drafted in the domicile of the testator when only movable assets are involved, it would definitely be advisable to consider a will in each of the jurisdictions when immovable property forms part of the assets.
2. Have you gathered all relevant information on the offshore asset types and values? Obtain clear information regarding the type and value of the asset. Some asset classes might have certain limitations or restrictions applicable, which might affect the transfer thereof at your death.
3. Have you confirmed who the owner of
the asset is? Consider what the possible impact would be on transfer of the asset if there is joint ownership, as well as the impact of your marital regime on its distribution.
4. Have you investigated the possible impact of any forced heirship laws in the countries where you hold assets?
5. Have you thought about any other potential challenges to the execution of your will/s? For example, execution may be affected by the impact of language barriers and the potential for instructions to be 'lost in translation'?
Ultimately, a failure to understand the full implications of holding assets in other jurisdictions and ensuring that the laws of those jurisdictions are complied with when drafting one or more wills, could result in significant challenges and delays for those whom you want to beneits from your estate on your death. As such the advantages of seeking help from an adviser well versed in foreign succession laws cannot be too strongly recommended.
Willem van der Merwe is a global solutions specialist, FNB Wealth and Investments.
WEALTH•INVESTMENT•PROSPERITY PERSONAL FINANCE | 1 ST QUARTER 2021 45
Having separate wills covering assets in various jurisdictions is not a guarantee of a smooth and simple estate administration process.
THERE’S MORE TO SECTION 12J INVESTING THAN THE TAX BREAK
As the renewal of South Africa’s Section 12J tax dispensation draws closer, investment specialist Renier de Wit appraises the current landscape and makes a case for higher investment allocations to this alternative asset class.
The government’s tax-incentive to boost economic growth – Section 12J of the Income Tax Act – gives investors more than a mere tax benefit.
Investors and wealth managers advising their clients could diversify their portfolios by including private equity-like investments. As with any other decisions to allocate capital, investors should scrutinise the managers who hold guardianship over their funds.

Let us remind ourselves why the Section 12J tax incentive exists. The dispensation was introduced by National Treasury in 2009. Investors, whether natural persons or
companies, may claim the amount invested in venture capital companies (VCCs) against their taxable income, thereby reducing their tax bill. Treasury’s aim with VCCs was for them to invest onwards in small- and medium-sized businesses, providing much-needed access to capital to create jobs. Treasury recently capped the annual Section 12J tax deductions at R2.5 million for natural persons and trusts, and R5 million for companies. The Section 12J dispensation is up for extension in June 2021 when Treasury will decide whether to continue with it.
The Section 12J VCCs raised about R9 billion since its introduction more than
a decade ago, with the bulk raised during the last three tax years. That relates to less than R3 billion rand per year. Why have retail investors not flocked to benefit from the tax deductions or to diversify their portfolios?
One reason may be that managers of Section 12J VCCs have punted the tax benefit too hard and lost sight of the allimportant benefit of portfolio diversification. Sound investment decisions are based on who you invest with and in what you invest. A Section 12J investment does reduce an investor’s capital at risk to say 55 percent of the amount invested, depending on their tax rate; however, there is R55 of every R100
46 PERSONAL FINANCE | 1 ST QUARTER 2021
WEALTH•INVESTMENT•PROSPERITY
at risk of loss. Therefore, it is vital to do a thorough due diligence of the team and its ability to generate the expected returns on capital when investing.
Effective capital deployment
This leads to a second point: the effective deployment of capital by VCC managers. When National Treasury considers the extension, it will inevitably ask how the capital was used to meet the aims of the dispensation. Thus, how much of the R9 billion remains uninvested in moneymarket funds awaiting investment into real businesses? Investors in VCCs should also ask this when deciding which Section 12J managers to entrust with their money. Has the manager been able to deploy the capital according to its mandate, or is the capital lying in a bank account earning a two-percent return after fees?
The deployment of capital is easy and there are two ways Section 12J managers should go about it. The first is where they raise the capital, park it in a bank or money-market account and hunt for potential investments. Having stellar marketing skills to lure capital for a VCC does not mean a manager is good at identifying and concluding investment destinations for those raised funds. The second is where an investment pipeline is prepared – after careful due diligence by the fund manager and eventual selection –followed by a subsequent capital raise. The latter approach will lead to capital working sooner with the possibility of higher returns.
It takes time and dedication to construct a portfolio of high-quality assets; typically six months from identifying a potential investment to when the VCC makes an investment. It is necessary to identify businesses with a proven track record and the ability to do more of what they do well with the fresh capital. Seeking stable and predictable returns from high-quality assets will limit downside risk and protect investors, which should be the aim of a Section 12J manager and not only the generation of fees. Where a manager is unable to deploy the capital within three
years, the tax advantages may be reversed to the investor’s detriment. Managers must do the work upfront by identifying viable assets, ensuring VCC investors benefit fully.

Performance fees
The fee structure that a Section 12J manager charges should be transparent, inclusive and fair with no hidden costs. Managers should not earn performance fees above the so-called ‘risk capital’. In such cases, performance fees are earned once 55 percent of the capital has been returned since these managers regard this as part of the return to investors and they share in the capital.
Investors in a Section 12J company need to retain their shares for at least five years to benefit fully from the dispensation, leaving them with an illiquid investment. With South Africa’s risk-free return currently around seven percent a year, investors should ask whether a hurdle rate – the minimum return above which the manager will share in the performance – of 10 percent a year is appropriate and an incentive for managers to outperform.
Alternative necessity
A final point is the necessity of private equity-like assets in a portfolio. Many retail investors consider alternative assets – Section 12J VCCs, hedge funds and infrastructure – because of lacklustre returns on traditional assets: equities, interest-bearing instruments and property. Alternative assets provide uncorrelated market returns and resultant diversification. If equity markets experience a downturn – such as March’s Covid-19-related stock market crash – alternative assets may not experience the same movement; they may experience no effect or a positive move. By including alternative assets in a portfolio, investors can stabilise returns through cycles in the economy. They are crucial to diversify portfolios and should form part of financial planning.
This diversification is best shown in the underlying assets that Section 12J VCCs target for investment. Infrastructure –especially renewable energy – and primary
agricultural enterprises (such as those in our funds) are not readily accessible as investment assets on the stock market. These businesses are high-quality profit generators with long-term returns. They create sustainable job opportunities over an extended period, the crux of the Section 12J dispensation.
The spirit of Section 12J is to boost our economy by providing much-needed startup or growth capital to small and medium enterprises. In turn, jobs will be saved and created.
Renier de Wit is the managing director of Gaia Fund Managers and Gaia Venture Capital, an approved financial services provider and Section 12J venture capital company.
WEALTH•INVESTMENT•PROSPERITY
47 PERSONAL FINANCE | 1 ST QUARTER 2021
I’m no money or investment professional. I am, as us millennials say, a “creative”. We have portfolio managers and financial advisers for a reason. I don’t have time to be a professional at two things.
But what I’ve learned in the past couple of years is that one’s relationship with money is an extremely personal one. It’s not as black and white as a balance sheet, and managing your money is not as simple as the way they make it look in TV advertisements.
The reality is that we’ve all been brought up differently, been exposed to different things. And so the way we frame this concept of “money”, and the way that we bond or clash heads with it is unique to each of us.
What I liked about 2020 is that it levelled the playing field for the most part. “Tenderpreneurs” aside, we were all caught off guard by the vicious pinch that the Covid-19 pandemic brought with it. In short, 2020 was an intervention. And this is what we learned.
We need to get more intimate with our money I’d never successfully created a budget before 2020. Suddenly, I found myself eager to review my account weekly, calculate what my expense risks would be, and determine what I could – and couldn’t – spend my money on.
Things got even more intimate when it came to spending that money. I held onto it lovingly and thoughtfully. Perhaps the dread of returning from the shops to my home office played a part, but I became more aware than ever of the value, quality and price of any given item on the shelf.
My bad spending habits stuck out like a sore
thumb. Once I understood why I spent money the way I did, I was able to shift my old perspectives on money to a healthier, more aware place.
We need to put in the work
2020 gave me the push I needed to really get excited about my investments, my income protection and savings vehicles. Like many people, I felt everything was spinning out of control, including my job and financial security.
Suddenly, I found myself scouring all corners of the internet to concoct the perfect safety net that would hold my money and keep it safe. This would be a financial survival bunker that would shelter my net worth from inevitable future tsunamis.
No matter how much I wanted to avoid wearing the finance hat, it had to be done – and I’m better for it. Heading into 2021, I know that whatever the coming year or decade may throw at me, I’ll be prepared.
We need to be grateful
MILLENNIAL VIEW HOW 2020 CHANGED MY RELATIONSHIP WITH MONEY

We’re all dreamers, and maybe we needed a bit of a wake-up call. In many ways, 2020 has been a game of “Imagine if…” Imagine if we had kids, and school fees to pay. Imagine if we were paying off fancy cars. On the flip side, imagine if we had medical aid, or a rainy-day fund. As a millennial, I still have time to think through these questions – and I still get to choose the method to my own money madness.
When all is said and done, I consider myself fortunate. Despite the doom and gloom, 2020 has made my relationship with money stronger than ever, sparking new curiosity, new beliefs, and new approaches that will redefine the way I feel about – and use – my money going forward.
MELISSA VAN ACHTERBERGH
WEALTH•INVESTMENT•PROSPERITY 48 PERSONAL FINANCE | 1 ST QUARTER 2021
Melissa van Achterbergh is a PR Consultant at ByDesign Communications
THE ABSA INFLATION BEATER FUND
The Absa Inflation Beater Fund is a conservatively managed low-equity multi-asset fund, targeting a stable, above-inflation return for its investors. It achieved that admirably over the five years to the end of 2020, delivering 7.82% a year and beating its benchmark of Consumer Price Index inflation plus 3% (4.63% + 3% = 7.63%).
The fund’s performance won it the Raging Bull Award for the Best South African Multi-asset Equity Fund on a Risk-adjusted Basis and the Raging Bull Certificate for the Best South African Multi-asset Low-equity Fund on a Riskadjusted Basis (for performance over five years to December 31, 2020).
Although a handful of multi-asset low-, medium- and high-equity funds delivered higher returns over the period, none achieved this level of return at such low risk – the biggest monthly drawdown the fund had over the five-year period was
1.1%, while the average maximum monthly drawdown among its peers was 8.1%.
The fund invests across the asset classes, but equities are limited to 20% of the portfolio, and there is a strong focus on maintaining consistently positive returns.
At the end of last year, according to the fund fact sheet, 1.82% of the portfolio was in listed equities. Three-quarters (76.58%) was in floating-rate bonds, another 12% in fixed-rate bonds, and 7.85% in moneymarket instruments.
The fund is managed by Eben Maré, who also heads the Absa Absolute Return Franchise at Absa Investments, and Kanyisa Ntontela. Personal Finance asked them about their strategy and asset selection.


Please outline your investment philosophy/strategy regarding the
Inflation Beater Fund, taking into account asset allocation and the macroeconomic backdrop.
We are active, pragmatic value investors aiming to consistently deliver excess risk-adjusted returns. Our investment approach seeks value and rewarded risk. Furthermore, we place significant emphasis on risk-adjusted returns and the quality of our investment outcomes. During (and before) the pandemic, the domestic market suffered from a lack of economic growth. This has had a direct impact on growth assets, such as equities and listed property. We consequently maintained an underweight allocation to property and equity.
To what do you attribute your fund's outperformance over the past few years, and specifically during the pandemic?
The fund’s performance is attributable to
FUND FOCUS
Kanyisa Ntontela
PERSONAL FINANCE | 1 ST QUARTER 2021 49
Eben Mare
CUMULATIVE PERFORMANCE SINCE INCEPTION TO DECEMBER 2020
our remaining true to our investment philosophy and process. Our aim has always been to build flexible portfolios that consistently yield significant positive real returns with minimal risk. As a result, during the pandemic we had a very low exposure to equity and property, which meant we escaped some of the brutal drawdowns in those markets. On a longer-term basis, we hold a measured approach to assumption of risk, and place a lot of emphasis on consistency and risk management.
Were there any standouts in the equity portion of the portfolio?
When we entered 2020 we had a very low exposure to equity and property. The positions we had went through a rigorous process where we focused on:
• Quality, low-volatility value type shares.
• Low price-to-earnings ratios, high dividend yields and shares trading at
discounts to net asset value.
• No index tracking. We further limited our stock exposure based on risk. We were looking for companies that we believed would recover as the economy recovered, and exposed the fund to SA Inc (companies predominantly operating in South Africa). In our opinion, SA Inc is in value territory, and we believe the opportunity exists for meaningful long-term returns. Some of the domestic counters that we built positions in were shares such as Bidvest Group, Imperial Holdings, Pick n Pay and Tiger Brands. We even took a view to build a property position, which benefited us towards the later part of 2020. In short, there was no particular standout: the SA Inc theme was the only dominant feature in our stock selection.
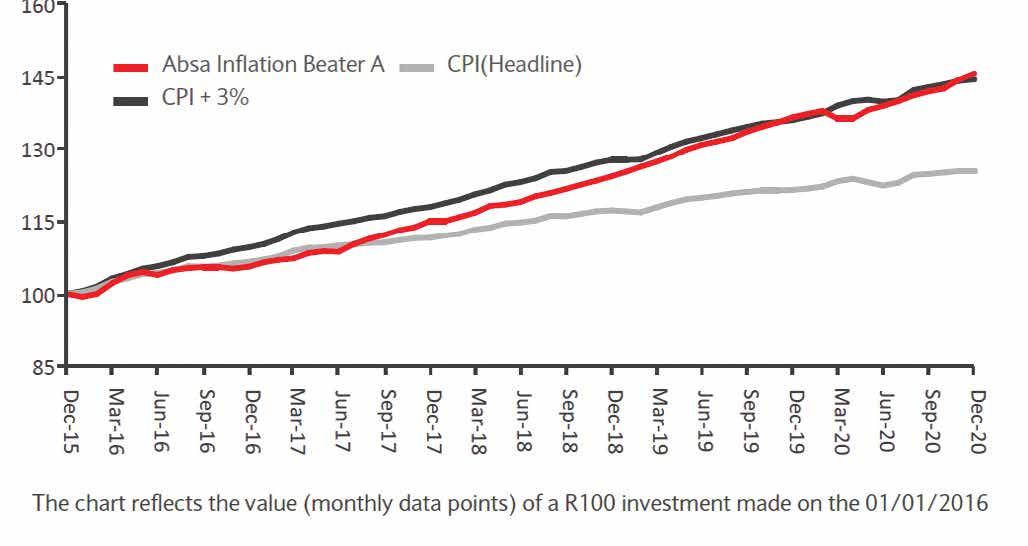
How are you positioning the fund for the year ahead, considering the
ongoing effects of the pandemic and other local and global opportunities and risks?
We believe that domestic cash is a proxy for inflation, while international cash holds no value. Domestic bonds offer attractive real returns, with fiscal risks “reasonably” priced in, and again we view international bonds as hugely unattractive. There is upside in domestic equities. We question whether international equities are appropriately priced for risk. Property is a decimated asset class – we believe it could hold significant upside for a domestic recovery. Our short- to medium-term view is that markets have discounted all the good news and we find limited upside in risk markets. Even with vaccines, the pandemic will require time to be worked out of the system. The economic carnage, in the meantime, warrants a careful and measured approach to risk taking.
FUND FOCUS
50 PERSONAL FINANCE | 1 ST QUARTER 2021
ABSA Investments
The importance of human emotions in investment decision-making is firmly established. It is often said that the drivers of stock market returns are fear and greed, and this is especially true in the current environment. In fact, perhaps the best investment resolution you can make this year is to commit to managing the impact of your emotions better, so that they don’t impact negatively on your financial decisions. But for those looking for more practical guidance, here are five resolutions I believe will set you up for a better 2021.
I will remember that the future may look different to the past
When times are tough, people tend to think things will continue this way indefinitely. Being aware of this tendency and recognising it in yourself if it arises, may help to keep you focused on your long-term plan. One thing history tells us about the markets is that the good times don’t last forever – but neither do the bad ones. A key aspect we often overlook is that during tough times, good companies respond by becoming leaner and more efficient. Once demand returns to the market, the impact is really felt in the earnings recovery.
I will avoid the trap of buying ‘failsafe’ shares at any price
Margin of safety is the difference between a company's prevailing market value (its share price) and its intrinsic or fair value. Sometimes investors get caught up in positive hype about a company and believe it is worth buying at any price, thus further driving up the share price. However, once the price moves up to a point where it does not compensate you for the risk that you inevitably take when buying a share, it is time to sell. Currently, investors seem to be pinning their hopes on the technology sector to deliver the outperformance they need. They may be well served to remember that we have been here before. At the time, we called it the dotcom bubble, and the share prices of even the best-quality tech companies fell substantially and took time to recover. Although some of these companies thrived after the collapse of
many of their peers, their share prices suffered because they were too expensive to start with. If I change my strategy, it will be based on facts, not fear
While it is important to avoid getting swept up in prevailing hype or gloom, it is equally important not to ignore the narrative altogether. That said, some of the best investment opportunities can arise from strong negative narratives. In fact, they are often a necessary precondition to finding quality companies at attractive valuations. Before you throw in the towel at a point of deep pessimism, make sure you understand why you are doing so, and why you have greater confidence in your alternative option delivering the long-term returns you require. A far better response is a measured rebalancing programme, working towards balancing the longer-term building blocks of your portfolio. For instance, rebalancing an underweight position in your equity portfolio (even to a small extent) after a significant market fall through selective purchases, has a higher probability of success than liquidating the entire portfolio and applying a cash strategy with a wait-and-see approach.
I will strive to keep my emotions in check
ON THE CONTRARY INVESTMENT RESOLUTIONS FOR A NEW WORLD

Emotions drive financial behaviour, and our emotions are often based on the extent to which our expectations are met or exceeded. Nobody expected a global pandemic, and very few investors will feel that their expectations were met. The best thing to do in uncertain times is to control the ‘controllables’. Unfortunately, market performance is not one of them. But your behaviour is.
I will commit to keeping a long term focus
Many investment gurus remind us that it takes time for a strategy to work, and some of the most admired investment businesses have been built over 30 years or longer. When you review their histories, there were times of uncertainty and hardship. Despite this, those businesses that stuck to their well-proven processes lasted and flourished. Any long-term investment strategy will be tested over time. A key component is how you, as an investor, will respond.
ANET AHERN
Anet Ahern is the CEO of PSG Asset Management.
WEALTH•INVESTMENT•PROSPERITY
DATABANK

52 PERSONAL FINANCE | 1 ST QUARTER 2021 DATABANK
WHERE TO GET HELP
With BANKING problems:
The Ombudsman for Banking Services is Reana Steyn.
ShareCall: 0860 800 900 or Telephone: 011 712 1800
Fax: 011 483 3212
Post: PO Box 87056, Houghton, 2041
Email: info@obssa.co.za
Website: www.obssa.co.za
With COMMUNITY-SCHEME-RELATED problems: The Community Schemes Ombud Service is a statutory dispute-resolution service for owners and residents of community schemes, including sectional-title schemes share-block companies, homeowners’ associations and schemes for retired persons. The Acting Chief Ombud is Advocate Ndivhuo Rabuli.
Telephone: 010 593 0533
Fax: 010 590 6154
Post: 63 Wierda Road East, Wierda Valley, Sandton, 2196
Email: info@csos.org.za
Website: www.csos.org.za
With CONSUMER-RELATED problems: The Acting National Consumer Commissioner is Ebrahim Mohamed.
Toll-free: 0860 003 600
Telephone: (complaints) 012 428 7000 or (switchboard) 012 428 7726
Fax: 086 758 4990
Post: PO Box 36628, Menlo Park, 0102
Email: complaints@thencc.org.za
Website: www.thencc.gov.za
The Consumer Goods and Services Ombud is Magauta Mphahlele. This is a voluntary dispute-resolution scheme that only has jurisdiction over retailers, wholesalers and manufacturers that subscribe to the Consumer Goods and Services Industry Code of Conduct.
ShareCall: 0860 000 272
Fax: 086 206 1999
Post: PO Box 3815, Randburg, 2125
Email: info@cgso.org.za
Website: www.cgso.org.za
With CREDIT TRANSACTION problems:
The Acting Credit Ombud is Howard Gabriels.
MaxiCall: 0861 662 837
Telephone: 011 781 6431
Fax: 086 674 7414
Post: PO Box 805, Pinegowrie, 2123
Email: ombud@creditombud.org.za
Website: www.creditombud.org.za
With DEBT COUNSELLING problems: The National Credit Regulator also deals with disputes that are not resolved by the Credit Ombud. The Chief Executive Officer is Nomsa Motshegare.
ShareCall: 0860 627 627
Telephone: 011 554 2600
Fax: 011 554 2871
Post: PO Box 209, Halfway House, 1685
Email: complaints@ncr.org.za or (debt counselling complaints) dccomplaints@ncr.org.za
Website: www.ncr.org.za
With FIDUCIARY problems:
The Fiduciary Institute of Southern Africa (FISA) is a selfregulating body in fiduciary matters such as wills, trusts and estate planning.
Telephone: 082 449 2569
Post: PO Box 67027, Bryanston, 2021
Email: secretariat@fisa.net.za
Website: www.fisa.net.za
With FINANCIAL ADVICE problems:
The Ombud for Financial Services Providers is Nonku Tshombe.
Telephone: 012 470 9080 or 012 762 5000
Fax: 086 764 1422, 012 348 3447 or 012 470 9097
Post: PO Box 74571, Lynnwood Ridge, 0040
Email: info@faisombud.co.za
Website: www.faisombud.co.za
With INVESTMENT problems:
The Financial Sector Conduct Authority, which is headed by Dube Tshidi, regulates the financial services industry.
ShareCall: 0800 110 443 or 0800 202 087
Telephone: 012 428 8000
Fax: 012 346 6941
Post: PO Box 35655, Menlo Park, 0102
Email: info@fsb.co.za
Website: www.fsb.co.za
With LIFE ASSURANCE problems:
The Ombudsman for Long-term Insurance is Judge Ron McLaren.
ShareCall: 0860 103 236 or Telephone: 021 657 5000
Fax: 021 674 0951
Post: Private Bag X45, Claremont, 7735
Email: info@ombud.co.za
Website: www.ombud.co.za
With MEDICAL SCHEME problems:
The Council for Medical Schemes is a statutory body that supervises medical schemes. The Acting Registrar of Medical Schemes is Dr Sipho Kabane.
MaxiCall: 0861 123 267
Fax: (enquiries) 012 430 7644 or (complaints) 086 673 2466
Post: Private Bag X34, Hatfield, 0028
Email: complaints@medicalschemes.com or information@medicalschemes.com
Website: www.medicalschemes.com
With MOTOR VEHICLE problems:
The Motor Industry Ombudsman of South Africa is an independent institution that resolves disputes between the motor and related industries and their customers. The Ombudsman is Johan van Vreden.
MaxiCall: 0861 164 672
Fax: 086 630 6141
Post: Suite 156, Private Bag X025, Lynnwood Ridge, 0040
Email: info@miosa.co.za
Website: www.miosa.co.za
With RETIREMENT FUND problems:
The Pension Funds Adjudicator is Muvhango Lukhaimane.
ShareCall: 0860 662 837
Telephone: 012 748 4000 or 012 346 1738
Fax: 086 693 7472
Post: PO Box 580. Menlyn, 0063
Email: enquiries@pfa.org.za
Website: www.pfa.org.za
With SHORT-TERM INSURANCE problems: The Ombudsman for Short-term Insurance is Judge Ron McLaren.
ShareCall: 0860 726 890 or Telephone: 011 726 8900
Fax: 011 726 5501
Post: PO Box 32334, Braamfontein, 2017
Email: info@osti.co.za
Website: www.osti.co.za
With TAX problems:
The Tax Ombud is Judge Bernard Ngoepe.
ShareCall: 0800 662 837 or Telephone: 012 431 9105
Fax: 012 452 5013
Post: PO Box 12314, Hatfield, 0028
Email: complaints@taxombud.gov.za
Website: www.taxombud.gov.za
DATABANK NOT SURE WHERE TO TAKE YOUR COMPLAINT? Call 0860 OMBUDS (662837) and you will be directed to the correct ombud or adjudicator. PERSONAL FINANCE | 1 ST QUARTER 2021 53
PLEXCROWN RANKING OF MANAGEMENT COMPANIES

DOMESTIC MANAGEMENT
PERFORMANCE OF DOMESTIC SUB-CATEGORIES TO 31 DECEMBER 2020
PERFORMANCE OF OFFSHORE SUB-CATEGORIES TO 31 DECEMBER 2020
PERFORMANCE OF DOMESTIC FUNDS TO 31 DECEMBER 2020
WHAT DO THE PLEXCROWN FUND RATINGS TELL YOU?
The last column in the collective investment scheme performance tables on pages 56 to 67 shows the PlexCrown rating of a fund if it qualifies for a rating. The PlexCrown Fund Ratings system encompasses the different quantitative measures used in calculating investment performances in one number and makes it easy for investors to evaluate fund managers on the basis of their long-term risk-adjusted returns.
The PlexCrown Fund Ratings enable investors to know at a glance how a unit trust fund has fared over time on a risk-adjusted return basis, compared with the other funds in its Association for Savings & Investment SA subcategory. Therefore, the ratings assist investors in determining whether or not a fund manager is adding value to their unit trust investments, given the manager’s mandate and the amount of risk he or she is taking.
The PlexCrown Fund Ratings are unbiased and objective because they are based on quantitative measures; no
subjectivity is brought into the research methodology.
In calculating risk-adjusted returns, the methodology accepts that various quantitative formulae each have their unique drawbacks. In order to overcome this, up to five different risk measures are used:
• Total risk (Sharpe Ratio);
• Downside risk (Sortino Ratio and Omega Risk/Reward Measure); and
• Manager’s skill (Jensen’s Alpha and Treynor).
The research method ensures that the unit trust funds under evaluation are exposed to similar risks; therefore, the subcategories for unclassified funds and money market funds are excluded.
The PlexCrown rating system is a measure of consistency because ratings are done over three and five years and are time weighted, with the emphasis on the longer period of measurement. Funds within a unit trust subcategory are ranked only if there are at least five funds in that subcategory with a
track record of at least five years. To qualify for a rating, a fund must have an official track record of at least five years.
Each qualifying unit trust fund is awarded a certain number of PlexCrowns ranging from one to five, with the top-performing funds allocated the highest rating of five.
The PlexCrown ratings distinguish between poor performers and excellent performers, but are based on historical data and should be used only as a first step in the construction of a unit trust portfolio. It remains the responsibility of investors together with their financial advisers, to make sure that the funds they choose suit their risk profiles and that their investment plans include an appropriate level of diversification.
Visit www.plexcrown.com for a full description of the PlexCrown Fund Ratings system.
DATABANK
BEST SUB-CATEGORIES RETURN FOURTH QUARTER South African Real Estate General 21.70% ONE YEAR Worldwide Equity Unclassified 41.93% THREE YEARS Worldwide Equity Unclassified 37.80% FIVE YEARS South African Equity Resources 24.05% WORST SUB-CATEGORIES RETURN FOURTH QUARTER Regional Interest Bearing Short Term -11.86% ONE YEAR South African Real Estate General -33.09% THREE YEARS South African Real Estate General -19.72% FIVE YEARS South African Real Estate General -8.91%
BEST SUB-CATEGORIES RETURN FOURTH QUARTER UK Equity General 7.49% ONE YEAR US Equity Varied Specialist 33.90% THREE YEARS US Equity Varied Specialist 19.19% FIVE YEARS Far East Equity General 10.93% WORST SUB-CATEGORIES RETURN FOURTH QUARTER Europe Equity Varied Specialist -17.88% ONE YEAR Europe Equity Varied Specialist -13.89% THREE YEARS UK Equity General -0.03% FIVE YEARS UK Fixed Interest Money Market -2.66%
BEST FUNDS RETURN FOURTH QUARTER Plexus Wealth BCI Flexible Property Income (A) 32.67% ONE YEAR IP Global Momentum Equity (A) 98.19% THREE YEARS IP Global Momentum Equity (A) 43.33% FIVE YEARS Coronation Resources (P) 31.57% WORST FUNDS RETURN FOURTH QUARTER Cloud Atlas AMI Real Estate ex-SA ETF -11.43% ONE YEAR Select BCI Property Fund (A) -46.58% THREE YEARS Nedgroup Investments Property Fund (A) -24.67% FIVE YEARS Nedgroup Investments Property Fund (A) -13.72%
BEST FUNDS RETURN FOURTH QUARTER Contrarius Global Equity 30.13% ONE YEAR Baillie Gifford Worldwide LT Global Growth 111.03% THREE YEARS Franklin Technology 38.92% FIVE YEARS Franklin Technology 26.17% WORST FUNDS RETURN FOURTH QUARTER Ninety One GSF Global Gold Acc -18.56% ONE YEAR Sanlam African Frontier Markets -21.11% THREE YEARS Sanlam African Frontier Markets -9.44% FIVE YEARS Sanlam African Frontier Markets -4.96%
PERFORMANCE OF OFFSHORE FUNDS TO TO 31 DECEMBER 2020 COMPANY RATINGS AS AT 31 DECEMBER, 2020 Management company PlexCrowns Ninety One 4.176 Mi-Plan 4.032 H4 Collective Investments 3.726 Prescient 3.518 Allan Gray 3.489 Coronation 3.482 Discovery 3.381 Alexander Forbes 3.327 Stanlib 3.260 PSG 3.233 Boutique 3.207 Absa 3.195 Nedgroup Investments 3.106 Momentum 2.828 Ashburton 2.700 Marriott 2.663 Old Mutual 2.625 Prudential 2.614 IP Management Company 2.409 Oasis 2.397 Bridge Collective Investments 1.150 OFFSHORE MANAGEMENT COMPANY RATINGS AS AT 31 DECEMBER, 2020 Management company PlexCrowns T. Rowe Price 4.050 Marriott 3.750 Nedgroup Investments 3.625 Coronation 3.500 Foord 3.500 Investec World Axis PCC 3.500 Sarasin 3.417 Momentum 3.250 PineBridge 3.250 VAM Global SA 3.167 Ninety One GSF 3.125 Alexander Forbes Investments 3.000 Allan Gray 3.000 Stanlib 2.967 Schroders 2.875 Sanlam 2.563 Ashburton 2.500 Oasis 2.333 Franklin Templeton 2.288 PSG 2.250 Standard Bank 2.250 Lloyds 2.167 Orbis 2.000 Prescient 1.333
54 PERSONAL FINANCE | 1 ST QUARTER 2021
Information in the above tables was provided by PlexCrown Fund Ratings and ProfileData
COLLECTIVE INVESTMENT SCHEME PERFORMANCE TO DECEMBER 30, 2020
ABOUT THE LISTINGS
• Results are based on the performance of a lump-sum investment over four periods that ended on DECEMBER 30, 2020. In each of the periods, there is a percentage (to two decimal places) by which an investment would have grown or shrunk, and the fund’s position or rank relative to other funds.
• Returns for the three- and five-year periods are annualised (that is, the percentage represents the average performance in a year). As unit trust funds are medium- to long-term investments, the most important performance periods are those of three years or longer.
• INITIAL COSTS have not been taken into account and can have an effect on returns.
• ANNUAL MANAGEMENT FEES are included in the returns.
• DIVIDENDS have been reinvested on the ex-dividend date (the day after they are declared) at the price at which the units are sold to you.
• INDICES normally supplied as benchmarks reflect percentage changes and take into account dividends and interest. In the case of new indices, a history is not yet available.
• The PLEXCROWN RATING indicates how a fund has fared over time compared with the other funds in its subcategory on a risk-adjusted return basis. Turn to page 55 for more information about the ratings.
WHAT DOES THE * INDICATE?
The asterisk (*) before a fund’s name indicates that the fund complies with the investment requirements of Regulation 28 of the Pension Funds Act. Funds suitable for retirement savings must comply with Regulation 28, which lays down guidelines about Inv. in different categories of assets. To reduce the risk and volatility of a fund, the Act restricts exposure to equities to a maximum of 75 percent of the fund and its exposure to property to 25 percent.
HOW FUNDS ARE CLASSIFIED
The Association for Savings & Investment SA’s classification system categorises unit trust funds according to their investment universe: where they invest, what they invest in and their main investment focus.
The first tier of the classification system categorises funds as South African, global, worldwide or regional.
South African funds must invest at least 70 percent of their assets in South African investment markets at all times. They may invest a maximum of 25 percent in foreign markets and a maximum of five percent in African (excluding South African) markets.
Global funds must invest a minimum of 80 percent of their assets outside SA. Worldwide funds do not have any restrictions on where they may invest but they typically allocate between South African and foreign markets in line with the manager’s outlook for local versus foreign assets.
Regional funds must invest at least 80 percent of their assets in a specific geographic region, such as Asia or Africa, excluding South Africa, or a country such as the United States. Regional funds may invest a maximum of 20 percent of their assets in South Africa.
The second tier of the classification system categorises funds according to the asset class in which they predominantly invest. At this level, funds are categorised as equity funds, interest-bearing funds, real estate funds or multi-asset funds.
Equity funds must invest at least 80 percent of the net asset value of a fund.
Interest-bearing funds invest in bonds, fixed interest and money-market instruments.
Real estate funds must invest at least 80 percent of their assets in shares in the real estate sector of the JSE or a similar sector of an international stock exchange. A fund may invest a maximum of 10 percent in property shares that are not classified in the real estate sector.
Multi-asset funds save you the trouble of deciding how to allocate your assets between shares, bonds, property or cash. The managers of multi-asset funds decide, for you, which asset classes they believe will produce the best returns and then, within those classes, which securities will perform the best. Some funds have a fixed allocation to the different asset classes whereas others change the mix of asset classes in line with their views of how the different classes or securities will perform.
DATABANK
NAME 3 MONTHS 1 YEAR 3 YEARS 5 YEARS PLEX CROWNS % RANK % RANK % RANK % RANK SOUTH AFRICAN EQUITY GENERAL FUNDS Fairtree Equity Prescient (A1) 14,03 18 19,81 1 10,47 1 11,74 1 5 36One BCI Equity (A) 5,02 151 18,94 2 10,03 2 6,72 17 5 Rezco Equity (A) 10,49 67 18,29 3 9,87 3 7,74 10 5 Truffle SCI General Equity (A) 14,16 16 13,07 10 8,56 4 6,07 22 5 Counterpoint SCI Value (A1) 11,42 51 18,22 4 7,95 5 6,35 20 4 Kagiso Equity Alpha (A) 17,43 1 3,46 67 6,75 6 9,49 6 5 SIM Top Choice Equity (A1) 11,67 49 6,36 45 6,61 7 7,01 13 5 Dynasty Ci Wealth Accumulator (A2) 4,64 157 8,87 28 5,84 8 6,73 16 4 Kagiso Islamic Equity (A) 12,31 43 5,22 56 5,79 9 9,12 8 5 Ninety One Equity (R) 9,71 81 10,93 14 5,61 10 5,95 23 APS Ci Equity (A1) 8,58 109 12,08 11 5,55 11 6,34 21 4 Kruger Ci Equity (A) 6,38 143 9,67 19 5,54 12 Ninety One Value (R) 11,04 60 -7,01 149 5,54 12 11,16 2 Element Islamic Equity SCI (A) 7,28 131 5,28 55 5,43 13 8,61 9 5 Coronation Equity (A) 13,00 29 14,15 7 5,35 14 7,28 12 5 Methodical BCI Equity (B1) 1,26 164 14,39 6 5,15 15 Autus Prime Equity (A) 4,86 153 10,04 17 4,66 16 3,81 47 3 Absa Prime Equity (A) 10,30 71 3,04 75 4,59 17 5,87 25 4 Obsidian SCI Equity (B3) 13,62 21 5,32 54 4,56 18 5,23 30 4 36One BCI SA Equity (C1) 9,54 90 9,13 26 3,91 19 CoreShares Top50 ETF 10,26 73 7,20 39 3,79 20 6,88 14 Momentum Trending Equity (A) 7,02 135 6,00 48 3,79 20 Stanlib Equity (R) 5,68 147 8,01 34 3,73 21 3,62 51 Coronation Top 20 (A) 12,85 34 9,00 27 3,50 22 9,14 7 4 PortfolioMetrix BCI SA Equity (B2) 12,32 42 4,46 57 3,41 23 4,38 38 4 Ashburton Multi Manager Equity (B1) 11,72 48 8,24 33 3,33 24 5,09 31 4 1nvest Sector Neutral Momentum Ind. Trkr (A) 4,92 152 9,56 22 3,30 25 Sanlam IM General Equity (R) 9,63 85 4,26 58 3,29 26 4,87 34 Trésor SCI Equity (B1) 11,34 53 9,27 23 3,19 27 Stonehage Fleming SCI Equity (A1) 6,67 139 11,06 13 3,16 28 Ninety One SA Equity (E) 12,36 41 6,84 40 3,16 28 Gryphon All Share Tracker (A) 8,12 124 9,21 25 3,12 29 5,86 26 27four Shariah Active Equity Prescient (A1) 8,27 121 7,87 36 3,09 30 2,95 62 3 Oasis Crescent Equity (D) 2,05 163 2,25 83 3,07 31 3,86 44 3 Stanlib M-M Diversified Equity FoF (B1) 9,42 94 5,54 52 2,97 32 4,52 37 PPS Equity (A2) 13,25 26 9,98 18 2,88 33 5,93 24 Sasfin BCI Equity (A) 5,20 149 9,66 20 2,80 34 1,43 80 3 FG IP Mercury Equity FoF (A) 10,49 67 8,34 31 2,77 35 4,01 42 4 African Alliance Equity Prescient (A1) 5,24 148 11,31 12 2,75 36 3,16 57 3 Discovery Equity (A) 9,25 95 10,52 16 2,72 37 5,77 27 4 Warwick BCI Equity (B) 4,35 159 6,78 41 2,71 38 1,30 82 3 Satrix Alsi Index (A3) 9,56 89 6,30 47 2,45 39 5,65 28 BlueAlpha BCI Equity (A) 3,84 161 2,37 80 2,40 40 4,35 39 3 Prudential Equity (A) 12,60 36 9,23 24 2,33 41 5,39 29 4 IFM Technical (A) -0,60 166 5,97 49 2,21 42 -0,94 100 2 Aylett Equity Prescient (A1) 7,29 130 -0,74 111 2,12 43 6,73 16 4 Sanlam Private Wealth Equity (A1) 9,48 92 4,06 61 2,01 44 3,68 50 3 Colourfield BCI Equity (B) 11,21 57 5,97 49 1,98 45 Satrix DIVI ETF (A) 15,93 7 3,63 65 1,88 46 10,73 3 Community Growth Equity (A) 8,78 104 0,68 96 1,83 47 3,42 54 3 Citadel SA Multi Factor Equity H4 (B1) 10,55 64 5,78 50 1,81 48 4,87 34 4 Prudential Dividend Maximiser (A) 9,97 77 3,97 62 1,77 49 4,22 41 4 Sygnia DIVI Index (A) 16,17 6 3,64 64 1,77 49 10,45 4 Denker SCI Equity (A) 11,31 55 1,61 89 1,76 50 2,53 68 3 Alexander Forbes Inv. Equity FoF (A) 10,11 76 2,34 81 1,72 51 7,51 11 4 Mi-Plan IP Beta Equity (B2) 9,18 98 3,44 68 1,64 52 4,67 35 4 Analytics Ci Managed Equity (A) 12,52 38 6,65 43 1,55 53 4,91 33 4 PERSONAL FINANCE | 1 ST QUARTER 2021 55
MONEY MARKET YIELDS
The third tier of the classification system categorises funds according to their main investment focus.
WHAT DOES THE ‘R’ OR ‘A’ MEAN?
These indicate the annual management fees a unit trust company can charge and depend partly on the class of units you buy.
Before June 1998, the fees charged on funds were regulated with a maximum annual management fee of one percent a year plus VAT. Funds launched before this date have the letter “R” behind the fund name and can only change their fees after a ballot of all unit trust holders. Many unit trust companies have closed their “R” class funds to new investments and launched new fund classes.
Funds and fund classes launched after June 1998 can charge any fees. Typically, fees range from 0.25 percent to 2 percent, excluding VAT. Funds with unregulated fees can be “A”, “B”, “C” or “D” class funds.
Typically, “A” class funds are offered to retail investors while cheaper “B” class funds are for institutional investors who invest in bulk. Only the institutional funds available to you through a linked-investment services provider (Lisp) are published here.
The different classes of a single fund are managed collectively and the difference in performance between them is purely a result of the difference in management fees.
Most recently what are known as all-in-fee classes (“C” or “D” classes) have been introduced. These funds charge a single fee covering the management fee, the broker fee and the administration (or Lisp) fee.
Performance figures supplied by ProfileData

Telephone: 011 728 5510
Email: unittrust@profile.co.za
Website: www.fundsdata.co.za
Disclaimer: Although all reasonable efforts have been made to publish the correct data, neither ProfileData nor Personal Finance can guarantee the accuracy of the information on the unit trust fund performance pages.
DATABANK
FUND NAME ANNUALISED YIELD TO 31 DECEMBER 2020 CLASS Absa Money Market Fund 4,25 A ACI Money Market Fund 4,14 A1 Afena Money Market Prescient Fund 3,43 A1 Allan Gray Money Market Fund 4,33 A Ashburton Money Market Fund 3,90 B1 BCI Money Market Fund 3,96 A Cadiz Money Market Fund 4,35 A Cannon Money Market H4 Fund 3,76 A Cartesian BCI Money Market Fund 3,98 A Citadel SA Money Market H4 Fund 3,70 B1 Coronation Money Market Fund 3,85 A Counterpoint SCI Money Market Fund 4,26 A Discovery Money Market Fund 3,62 A Fairtree Money Market Prescient Fund 3,77 A1 Glacier Money Market Fund 3,74 A Granate SCI Money Market Fund 3,80 B Gryphon Money Market Fund 4,46 A Hollard Prime Money Market Fund 4,16 B Ninety One Money Market Fund 3,78 R Marriott Money Market Fund 3,81 A Momentum Money Market Fund 3,75 A Nedgroup Investments Money Market Fund 3,67 R Oasis Money Market Fund 3,16 A Old Mutual Money Market Fund 3,85 A Old Mutual Multi-Managers Money Market Fund 3,69 A Prescient Money Market Fund 4,02 A Prime Money Market Fund 5,57 A Prudential Money Market Fund 3,78 A PSG Money Market Fund 3,23 A Satrix Money Market Fund 3,42 A1 SIM Money Market Fund 3,85 R SNN Money Market Fund 3,86 A1 Stanlib Money Market Fund 3,77 R Stanlib Money Market Fund 7,04 R NAME 3 MONTHS 1 YEAR 3 YEARS 5 YEARS PLEX. % RANK % RANK % RANK % RANK Coronation SA Equity (A) 13,64 20 8,81 29 1,48 54 4,59 36 4 Satrix Dividend + Index (A1) 15,91 8 3,38 69 1,46 55 10,28 5 Select Manager BCI Equity (C) 6,85 138 3,17 74 1,43 56 PSG Wealth Creator FoF (A) 11,32 54 5,41 53 1,36 57 4,23 40 M1 Capital Equity Prescient (A1) 7,66 129 8,31 32 1,09 58 2,02 75 3 Sentio SCI Hikma Shariah General Equity (B1) 8,05 126 0,77 94 1,05 59 Select BCI ESG Equity (A) 6,96 136 6,32 46 0,94 60 2,27 70 3 Prime South African Equity (A) 9,23 96 1,79 88 0,94 60 Lynx Prime Opportunities FoF (A1) 8,62 107 6,38 44 0,85 61 2,93 63 Optimum BCI Equity (A) 9,06 101 3,28 71 0,81 62 3,57 53 3 Momentum Core Equity (A) 11,74 47 2,13 84 0,61 63 Stanlib Enhanced Multi Style Equity (A1) 12,90 33 -0,55 108 0,52 64 Absa Select Equity (A) 8,80 103 1,44 90 0,50 65 3,77 48 3 Personal Trust Equity (A) 10,50 66 2,66 78 0,28 66 3,08 59 3 Caleo BCI Equity (A) 8,44 116 13,84 8 0,23 67 Old Mutual RAFI 40 Index (A) 10,15 75 -2,86 123 0,14 68 6,75 15 Satrix RAFI 40 Index (A1) 10,30 71 -2,94 124 0,07 69 6,71 18 Sygnia Itrix SWIX 40 ETF 8,77 105 5,32 54 0,05 70 Maestro Equity Prescient (A) 6,88 137 10,79 15 0,04 71 -0,40 92 2 Satrix RAFI 40 ETF (A) 10,32 70 -3,09 126 -0,03 72 6,58 19 Denker SCI SA Equity (B1) 13,42 23 -0,64 109 -0,05 73 Sygnia Equity (A) 9,79 80 3,22 73 -0,11 74 2,53 68 3 Dotport BCI Equity (B) 6,28 145 -2,96 125 -0,14 75 1nvest Sector Neutral G&Q Index Tracker (A) 9,19 97 7,94 35 -0,29 76 Old Mutual Albaraka Equity (A) 9,00 102 -0,21 102 -0,30 77 2,09 74 3 Aluwani Top 25 (R) 6,63 142 3,34 70 -0,36 78 3,36 55 Integral BCI Equity (A) 7,14 133 8,51 30 -0,39 79 Prescient Core Equity (A2) 9,79 80 2,62 79 -0,43 80 Laurium Equity Prescient (A1) 12,41 40 0,01 99 -0,45 81 2,24 72 3 Aeon Smart Multi-Factor Equity Prescient (A1) 8,77 105 2,86 76 -0,54 82 3,75 49 3 Anchor BCI Equity (A) 8,54 112 -1,20 114 -0,59 83 -0,70 97 2 BCI Best Blend Specialist Equity (C) 8,20 122 -1,52 117 -0,59 83 2,44 69 3 Momentum Equity (A) 8,43 117 -0,29 104 -0,64 84 3,14 58 3 Momentum Value Equity (A) 17,21 3 -2,26 120 -0,64 84 Hollard Prime Equity (B) 9,59 86 2,69 77 -0,71 85 2,83 64 3 All Weather BCI Equity (B2) 12,84 35 3,44 68 -0,77 86 1nvest Index (R) 9,52 91 1,86 87 -0,78 87 3,20 56 N-e-FG BCI Equity (A) 8,20 122 3,47 66 -0,82 88 5,03 32 3 Allan Gray Equity (A) 9,67 83 -0,25 103 -0,89 89 3,83 45 3 Sygnia SWIX Index (A) 9,87 79 2,04 86 -0,93 90 3,82 46 H4 Focused Wealth (A1) 8,59 108 -5,98 143 -1,16 91 -0,07 89 2 Melville Douglas Stanlib High Alpha (A) 10,55 64 -1,33 115 -1,42 92 2,11 73 3 Absa Smart Alpha Equity (A) 8,31 119 2,11 85 -1,46 93 1,94 76 3 Old Mutual M-M Equity FoF (A) 12,56 37 3,27 72 -1,57 94 2,57 67 3 Ashburton Equity (B1) 5,11 150 -0,74 111 -2,05 95 1,47 79 2 Bateleur Equity Prescient (B4) 10,37 69 2,32 82 -2,06 96 1,42 81 2 Visio BCI General Equity (A) 8,16 123 0,83 93 -2,16 97 0,54 86 2 Visio BCI SA Equity (B)8 9,71 81 -1,59 118 -2,42 98 Counterpoint SCI Dividend Equity (A1) 5,74 146 -11,82 163 -2,44 99 1,55 78 2 Absa SA Core Equity (A) 8,09 125 -4,19 137 -2,47 100 Satrix Capped Swix ALSI (A1) 11,18 58 -0,52 107 -2,48 101 Old Mutual Capped SWIX Index (A) 10,77 63 -0,67 110 -2,58 102 Oasis General Equity (D) 7,28 131 -5,55 141 -2,78 103 3,00 61 2 Cadiz BCI Equity (A) 4,36 158 -11,62 162 -2,81 104 2,26 71 3 Satrix Momentum Index (A1) 9,52 91 -4,47 140 -2,83 105 3,59 52 Excelsia Equity ACI (A1) 15,07 12 -0,38 105 -2,85 106 Marriott Dividend Growth (R) 4,27 160 -6,55 146 -2,93 107 1,14 83 2 Huysamer Equity Prescient (A) 8,46 114 -0,83 112 -2,96 108 -0,91 99 2 Foord Equity (A) 11,25 56 -0,95 113 -3,09 109 -0,55 95 Prudential SA Equity Class F 12,04 46 -4,15 135 -3,11 110 ClucasGray Equity Prescient (A1) 15,90 9 -9,07 157 -3,11 110 3,04 60 3 56 PERSONAL FINANCE | 1 ST QUARTER 2021
NAME 3 MONTHS 1 YEAR 3 YEARS 5 YEARS PLEX. % RANK % RANK % RANK % RANK NAME 3 MONTHS 1 YEAR 3 YEARS 5 YEARS PLEX. % RANK % RANK % RANK % RANK Nedgroup Inv. Private Wealth Equity (A) 14,22 15 0,44 98 -3,15 111 -0,64 96 2 Sentio SCI General Equity (B2) 12,25 45 -1,46 116 -3,17 112 Satrix Quality South Africa ETF 14,06 17 -3,72 131 -3,18 113 Allan Gray SA Equity (A) 11,43 50 -4,20 138 -3,18 113 2,72 65 3 Satrix Quality Index (A1) 13,93 19 -4,10 134 -3,65 114 4,87 34 Old Mutual Managed Alpha Equity (A) 9,68 82 0,71 95 -3,68 115 0,55 85 2 Element Earth Equity SCI (A) 8,45 115 -12,89 164 -3,72 116 3,94 43 3 Benguela Equity ACI (A1) 9,58 87 -2,80 121 -3,85 117 FNB Momentum Growth (A) 8,32 118 -3,81 133 -3,93 118 0,32 87 2 Mergence Equity Prime (A1) 10,53 65 -2,81 122 -4,08 119 -0,09 90 2 Stanlib SA Equity (R) 9,65 84 -2,20 119 -4,23 120 -0,52 94 Nedgroup Inv. Value (R) 12,91 32 -8,09 152 -4,34 121 0,79 84 Old Mutual Investors (R) 8,51 113 -10,01 158 -4,38 122 -0,80 98 IP High Conviction Equity (A) 6,64 141 -3,79 132 -4,41 123 -0,19 91 2 1nvest Sector Neutral Value Index Tracker (A) 16,23 5 -5,60 142 -4,49 124 Integrity Equity Prescient (A1) 10,16 74 -14,70 165 -4,49 124 Cannon Equity H4 (A) 17,38 2 -6,15 145 -5,17 125 -1,27 101 1 Perpetua SCI Equity (A) 10,26 73 -7,07 150 -5,30 126 1,73 77 2 Northstar SCI Equity (A) 9,44 93 -8,34 153 -5,31 127 Harvard House BCI Equity (A) 7,12 134 0,66 97 -5,34 128 -2,06 103 1 Ampersand SCI Equity (B) 8,57 110 -8,99 156 -5,57 129 -0,41 93 2 Nedgroup Inv. Rainmaker (A) 4,65 156 -7,40 151 -5,76 130 -0,91 99 2 CoreShares Scientific Beta MF Index (A) 7,72 128 -8,58 155 -6,17 131 PSG Equity (A) 14,49 14 -3,71 130 -6,45 132 2,61 66 Mazi Asset Management Prime Equity (A) 9,57 88 -6,56 147 -6,46 133 -1,30 102 1 First Avenue SCI Equity (B1) 8,76 106 -4,18 136 -7,30 134 -2,92 104 1 CoreShares SA Dividend Aristocrats ETF 12,97 31 -15,00 167 -8,13 135 -0,05 88 Steyn Capital Equity Prescient (A1) 16,24 4 -10,38 159 -8,21 136 First Avenue SCI Focused Quality Equity (A) 7,26 132 -3,30 127 -8,58 137 -3,71 106 1 Bridge Equity Income Growth (A) 13,20 27 -15,03 168 -9,18 138 -2,06 103 1 Nedgroup Inv. Growth (R) 12,43 39 -24,06 171 -9,72 139 -2,94 105 Fairtree Select Equity Prescient (A1) 13,33 24 14,57 5 Select BCI Blended Equity Strategy (A) 11,39 52 13,61 9 Absa Top 40 Index (A) 8,80 103 9,63 21 BCI Shariah Equity (C) 6,30 144 7,80 37 Prescient Core All Share Equity (A2) 9,56 89 7,40 38 Ngwedi Equity SNN Class I1 10,29 72 6,74 42 Foundation BCI Equity (A) 13,26 25 5,70 51 Aeon Active Equity Prescient (A1) 8,55 111 4,15 59 Absa Dividend Plus Index (A) 15,87 10 4,07 60 Ngewdi Active Equity SNN Class I1 8,28 120 3,78 63 X-Chequer BCI Equity (B) 10,43 68 1,43 91 Satrix Smartcore Index (A1) 12,27 44 1,11 92 Prescient Core Capped Equity (A2) 11,08 59 -0,12 100 Momentum Capped SWIX Index (A) 10,83 62 -0,17 101 Mianzo Equity ACI (A1) 13,08 28 -0,42 106 Dalebrook Equity Prescient (A3) 0,55 165 -3,51 128 Lima Mbeu SCI Equity (A1) 9,94 78 -3,70 129 Satrix Momentum ETF (A) 9,54 90 -4,27 139 Global & Local SNN Equity (A) 4,79 155 -6,14 144 Old Mutual Equity (A) 6,65 140 -6,70 148 CoreShares Scientific Beta Multi Factor ETF 7,86 127 -8,35 154 NewFunds Value Equity ETF 14,88 13 -11,18 160 Global & Local SNN Low Volatility Equity (A) 3,27 162 -11,20 161 Satrix Mid Cap Index (A1) 13,45 22 -14,89 166 Amity BCI Equity Income (A) 9,08 100 -16,83 169 NewFunds Low Volatility Equity ETF 4,81 154 -18,15 170 Oyster Catcher RealFin Equity (A) 15,43 11 Differential Neural Equity Prescient (A1) 12,98 30 Old Mutual ESG Equity (A) 10,97 61 Vunani BCI Equity (A) 9,12 99 Arithmetic Average 9,79 1,35 0,14 3,52 FTSE/JSE All Share index (J203) 9,75 7,00 3,12 6,36 INDUSTRIAL FUNDS SIM Industrial (R) 9,92 1 25,96 1 4,69 1 4,08 1 Satrix Capped INDI ETF (A) 7,51 4 12,64 3 -0,16 2 2,46 2 Coronation Industrial Class P 7,86 3 10,27 4 -0,94 3 2,01 3 Momentum Industrial (A) 8,80 2 15,06 2 -1,04 4 1,09 4 Arithmetic Average 8,75 16,00 0,75 2,25 FTSE/JSE Industrial index (J257) 7,38 12,00 0,19 2,86 LARGE-CAP FUNDS NewFunds Shari’ah Top 40 Index ETF 9,07 5 4,71 16 7,85 1 7,96 1 Kagiso Top 40 Tracker (R) 8,76 11 13,43 1 4,69 2 6,36 2 Ashburton Top40 ETF 8,88 7 9,82 3 4,17 3 6,35 3 Satrix 40 ETF (A) 8,82 8 9,67 5 4,10 4 6,28 4 Sygnia Itrix Top 40 ETF 8,79 9 9,52 6 3,94 5 Prescient Equity Top 40 (A1) 8,56 15 9,41 7 3,93 6 6,15 6 4 1nvest ALSI 40 (A) 8,97 6 10,22 2 3,92 7 6,17 5 1nvest Top 40 ETF (A) 8,82 8 9,72 4 3,63 8 6,05 7 Satrix Top 40 Index (A1) 8,67 14 9,04 10 3,48 9 5,78 9 Momentum Top 40 Index (A) 8,31 18 9,11 8 3,47 10 5,79 8 Old Mutual Top 40 Index (A) 8,41 16 9,06 9 3,42 11 5,60 11 Sygnia Top 40 Index (A) 8,67 14 8,88 11 3,33 12 5,69 10 NewFunds Equity Momentum ETF 5,35 19 -2,27 20 1,13 13 5,28 12 Citadel SA 20/20 Equity H4 (B1) 8,35 17 5,55 12 0,19 14 Satrix SWIX TOP 40 ETF (A) 8,71 12 5,29 15 -0,07 15 4,03 14 1nvest Swix 40 ETF (A) 8,78 10 5,42 13 -0,18 16 4,07 13 Satrix Swix Top 40 Index (A1) 8,70 13 5,30 14 -0,24 17 3,84 15 Satrix Equally Weighted Top 40 Index (A1) 12,10 3 4,46 17 -0,61 18 1,90 16 NewFunds S&P GIVI SA Top 50 ETF 4,15 20 -5,03 21 -1,91 19 -2,46 20 Prescient Equity (A1) 13,20 1 0,87 18 -2,77 20 1,23 18 Integre Large Cap Prescient (A1) 13,03 2 -2,11 19 -3,59 21 1,56 17 2 Saffron SCI Large Cap (A) 9,38 4 -7,97 22 -4,78 22 0,28 19 2 Arithmetic Average 8,95 5,55 1,59 4,40 FTSE/JSE ALSI 40 index (J200) 8,88 9,97 4,26 6,54 MID- AND SMALL-CAP FUNDS Coronation Smaller Companies (R) 19,62 1 5,15 1 -0,28 1 5,32 1 5 Momentum Mid and Small Cap Index (A) 14,91 4 -10,58 6 -4,06 2 Ashburton MidCap ETF 13,46 5 -15,02 7 -4,33 3 3,24 2 Ninety One Emerging Companies (R) 11,76 7 -15,96 8 -5,06 4 -5,89 7 SIM Small Cap (R) 19,51 2 -2,51 3 -5,21 5 -3,39 6 Momentum Small Mid-Cap (A) 15,14 3 3,81 2 -5,22 6 2,41 3 4 Old Mutual Mid & Small-Cap (R) 12,05 6 -9,46 5 -6,46 7 -2,23 5 Nedgroup Inv. Entrepreneur (R) 9,67 8 -6,07 4 -6,74 8 -1,09 4 Arithmetic Average 14,62 -6,38 -4,50 -0,29 FTSE/JSE Mid Cap index (J201) 13,69 -14,37 -3,68 4,01 RESOURCE FUNDS Ninety One Commodity (R) 9,00 3 28,37 2 30,22 1 28,11 2 SIM Resources (A) 8,74 4 20,81 4 25,06 2 24,17 4 3 Coronation Resources Class P 19,27 1 30,34 1 23,88 3 31,56 1 4 Nedgroup Inv. Mining & Resource (R) 10,30 2 20,08 5 22,73 4 24,39 3 Satrix RESI ETF (A) 7,63 5 19,73 6 20,13 5 21,17 5 Momentum Resources (A) 5,89 6 25,21 3 13,79 6 17,82 6 1 Arithmetic Average 10,17 24,00 22,67 24,50 FTSE/JSE RESI 10 index (J210) 7,85 21,11 21,36 21,90 UNCLASSIFIED FUNDS Krugerrand Custodial Certificates ETF -12,02 2 29,79 1 19,37 1 10,24 1 *Bridge Diversified Preference Share (A) 13,19 1 -10,18 2 7,34 2 6,91 2 SOUTH AFRICAN MULTI ASSET HIGH EQUITY FUNDS *Long Beach Managed Prescient (A1) 12,76 3 28,24 1 12,66 1 10,47 1 5 *Gryphon Prudential (B) 3,48 155 21,45 4 11,31 2 9,86 2 5 PERSONAL FINANCE | 1 ST QUARTER 2021 57
DATABANK
DATABANK NAME 3 MONTHS 1 YEAR 3 YEARS 5 YEARS PLEX. % RANK % RANK % RANK % RANK NAME 3 MONTHS 1 YEAR 3 YEARS 5 YEARS PLEX. % RANK % RANK % RANK % RANK Fairtree Balanced Prescient (A1) 9,58 15 20,71 5 11,24 3 *Nedgroup Inv. Balanced (A) 9,90 12 11,47 13 9,10 4 5,60 25 4 *Nedgroup Inv. Managed (R) 11,62 7 8,49 38 7,86 5 *Rezco Managed Plus (A) -2,46 188 8,83 33 7,47 6 3,99 72 3 *Ninety One Managed (R) 3,45 156 9,56 26 7,44 7 7,63 8 *Rezco Value Trend (A) -1,77 187 9,51 27 7,31 8 4,23 69 3 *Ninety One Opportunity (R) 1,68 180 10,74 16 7,23 9 6,33 13 *Financial Fitness IP Balanced FoF (A) 1,35 183 6,26 70 6,75 10 *CS BCI Prudential FoF (C) 5,79 97 8,73 34 6,72 11 *CS BCI Aggressive Prudential FoF (C) 6,33 77 11,70 11 6,63 12 *Rowan Capital BCI Balanced FoF (A) 4,76 128 8,65 35 6,63 12 Kagiso Islamic Balanced (A) 9,90 12 8,17 45 6,30 13 7,66 7 5 *Kagiso Balanced (A) 12,14 5 2,17 145 6,03 14 8,47 3 5 *Prescient Living Planet (A1) 6,95 55 12,29 9 6,01 15 6,11 17 4 *Multi Asset IP Balanced Plus (B1) 5,64 103 8,99 30 6,01 15 5,70 23 4 *H4 Diversified (B1) 3,42 158 5,73 79 6,00 16 6,78 10 5 *Warwick BCI Balanced (B) 2,44 174 7,84 48 5,98 17 3,45 91 3 Alexander Forbes Inv. Agg. Passive (A1) 6,51 72 10,71 17 5,95 18 *IP Active Beta (A) 2,86 169 10,56 19 5,89 19 5,29 33 4 Sygnia Skeleton Balanced 70 (A) 6,02 89 9,22 29 5,84 20 6,19 15 5 *SIM Managed Moderate Aggressive FoF (A1) 5,98 90 5,54 83 5,81 21 6,12 16 5 *Stanlib Balanced (R) 5,82 96 9,78 23 5,79 22 4,82 49 *NFB Ci Managed (A) 4,89 125 7,67 52 5,75 23 6,68 12 5 *Southern Charter BCI Growth FoF (A) 7,67 39 11,66 12 5,68 24 5,14 37 4 Obsidian SCI Balanced (B1) 10,82 9 6,49 67 5,67 25 6,01 20 4 *Prescient Wealth Balanced FoF (A1) 4,71 129 9,63 25 5,66 26 6,23 14 5 *Flagship IP Balanced (A) 2,98 168 13,58 7 5,62 27 3,12 97 3 *SIM Managed Aggressive FoF (A1) 6,80 60 5,29 90 5,54 28 5,95 21 4 *Sasfin BCI Prudential (A1) 3,98 148 6,01 73 5,53 29 4,61 56 3 *FG IP Neptune Growth FoF (A) 6,86 58 7,56 54 5,51 30 5,77 22 4 *Centaur BCI Balanced (A) 11,79 6 11,44 14 5,33 31 7,71 6 5 Denker SCI Balanced (A) 6,49 73 5,77 78 5,28 32 *Ashburton MM Prudential Flexible (B1) 8,79 21 5,94 76 5,26 33 5,33 31 4 *Sygnia CPI + 6% (D) 6,29 79 8,27 41 5,20 34 4,88 46 4 Sanlam MM Balanced FoF (A2) 8,20 30 7,32 56 5,14 35 5,16 36 4 Aylett Balanced Prescient (A1) 4,97 124 4,97 98 5,13 36 7,88 5 5 *Autus Prime Balanced (A) 1,67 181 12,97 8 5,10 37 2,48 111 2 *Prescient Balanced (A2) 8,50 25 8,21 43 5,10 37 6,87 9 4 *Roxburgh Ci Balanced Plus FoF (A) 6,04 87 8,26 42 5,06 38 *Select BCI Balanced (A) 9,88 13 4,65 106 5,06 38 4,66 54 4 *Foord Balanced (A) 4,30 137 8,53 37 5,04 39 4,16 70 3 *Red Oak BCI Balanced (A) 6,49 73 7,00 59 5,03 40 *PPS Balanced FoF (A2) 5,84 95 4,36 111 4,94 41 5,03 42 *Stanlib M-M Balanced (B1) 7,48 44 6,94 60 4,92 42 5,42 28 *Sanlam MM Aggressive FoF (A1) 8,19 31 8,02 46 4,88 43 6,03 19 4 *Wealth Associates BCI Balanced FoF (A) 6,18 81 4,76 104 4,87 44 *Instit BCI Managed FoF (A) 0,96 185 4,54 108 4,86 45 Discovery Aggressive Dyn. Asset Opt. FoF (A) 8,73 23 10,29 21 4,85 46 5,67 24 4 *ADB BCI Flexible Prudential FoF (A) 8,39 28 9,22 29 4,84 47 5,17 35 4 *Point3 BCI Balanced FoF (A) 5,68 100 7,46 55 4,84 47 *Olympiad BCI Managed FoF (A) 1,17 184 1,81 150 4,83 48 2,80 106 2 *Element Islamic Balanced SCI (A) 3,31 163 2,75 136 4,77 49 8,11 4 4 *Coronation Balanced Plus (A) 9,04 20 8,87 32 4,76 50 5,43 27 4 *WellsFaber Balanced SCI FoF (A) 3,66 152 2,50 138 4,73 51 *Sanlam MM Moderate FoF (A1) 4,51 133 5,53 84 4,72 52 5,16 36 4 *Celtis BCI Managed FoF (A) 4,67 130 10,17 22 4,64 53 5,53 26 4 *Northstar SCI Managed (A1) 3,07 166 5,24 94 4,50 54 4,40 64 3 *S BRO BCI Managed FoF (A) 6,59 68 7,60 53 4,48 55 Sentio SCI HIKMA Shariah Balanced (B1) 5,61 105 5,26 93 4,48 55 *Methodical BCI Balanced (A) 3,34 162 8,61 36 4,47 56 4,27 67 3 *Chrome Ci Growth (A) 5,38 113 8,19 44 4,46 57 Melville Douglas Stanlib Balanced (A) 5,61 105 5,87 77 4,37 58 4,93 45 4 *4D BCI Moderate FoF (A) 4,64 132 5,99 75 4,35 59 3,87 78 3 *Simplisiti BCI Managed Protector FoF (A) 6,36 76 6,73 64 4,30 60 4,84 48 4 *Sanlam MM Moderate Aggressive FoF (A1) 7,46 46 5,37 87 4,28 61 5,04 41 4 *Discovery Balanced (A) 6,89 56 5,22 95 4,18 62 4,78 50 4 *Bovest BCI Managed FoF (A) 5,88 93 8,31 40 4,15 63 5,08 40 3 Oasis Crescent Balanced High Equity FoF (D) 1,43 182 3,49 126 4,13 64 4,46 62 3 Alexander Forbes Inv. Performer Managed (A) 6,73 63 7,20 57 4,11 65 5,34 30 4 Sage SCI Long Term Solution FoF (A2) 7,30 48 8,90 31 4,10 66 4,23 69 3 *AssetMix Ci Balanced (A) 5,45 110 5,61 81 4,10 66 4,32 65 3 *Absa MM Passive Growth (B) 5,60 106 3,89 119 4,09 67 *IP Prudential Equity (A) 3,41 159 6,94 60 4,05 68 *Stanlib M-M Medium-High Equity FoF (B1) 8,24 29 5,34 88 4,04 69 5,11 38 *Warwick BCI Balanced FoF (C) 3,04 167 9,31 28 4,03 70 3,32 95 2 *AS Forum BCI Aggressive FoF (A) 5,66 101 7,99 47 4,03 70 3,51 88 3 *Stanlib M-M Shar'iah Balanced FoF (A) 7,19 49 5,27 92 3,99 71 5,09 39 3 Nedgroup Inv. Core Diversified (B) 6,53 70 6,80 63 3,97 72 5,31 32 4 *27four Shariah Balanced Prescient FoF (A1) 5,29 116 5,40 86 3,97 72 3,94 75 2 Cordatus Balanced Prescient (A1) 6,09 86 10,35 20 3,95 73 *Personal Trust Managed (A) 4,46 134 8,61 36 3,93 74 4,85 47 3 *PBi BCI Balanced FoF (A) 5,76 98 4,43 109 3,92 75 4,97 44 3 *Adviceworx Old Mutual Infl. + 4-5% FoF (B1) 6,17 82 7,78 50 3,87 76 5,26 34 4 *Citadel Balanced H4 (B1) 2,49 173 2,30 142 3,83 77 4,78 50 3 Sanlam Private Wealth Balanced Fund 2,57 171 2,69 137 3,71 78 3,62 86 2 *Alexander Forbes Inv. Balanced FoF (A) 7,08 52 6,34 68 3,60 79 4,59 58 3 *Trésor SCI Balanced (B1) 5,48 109 6,08 71 3,60 79 2,72 107 2 *Optimum BCI Managed Growth (A) 5,07 121 3,30 130 3,58 80 3,97 73 3 *Personal Trust Prudent FoF (A) 5,62 104 4,40 110 3,52 81 4,98 43 3 *Hollard Prime Strategic Assertive FoF (B) 6,62 66 5,28 91 3,51 82 4,78 50 3 *Absa Prudential FoF (A) 6,59 68 4,18 112 3,51 82 4,60 57 3 27four Asset Select Prescient FoF (A1) 5,86 94 4,06 115 3,49 83 4,05 71 3 CoreShares OUTmoderate Index (O) 7,57 40 4,78 103 3,41 84 *Noble PP Stanlib Wealth Creator FoF (A) 2,31 175 2,33 141 3,40 85 3,96 74 2 *BCI Prudential FoF (3B1) 7,52 42 7,20 57 3,36 86 3,92 76 3 *Moore Ci Growth FoF (A) 4,21 141 4,96 99 3,36 86 3,69 84 3 *Graviton SCI Balanced (A1) 6,85 59 4,86 101 3,33 87 4,41 63 3 *ClucasGray Equilibrium Prescient (A1) 9,12 19 -0,25 171 3,32 88 5,39 29 4 *Stanlib M-M High Equity FoF (B1) 8,43 27 6,32 69 3,20 89 4,59 58 *Counterpoint SCI Balanced Plus (A1) -2,87 189 -2,34 178 3,19 90 3,17 96 2 *JBL SCI Managed FoF (B1) 5,30 115 2,03 147 3,14 91 *Lynx Prime Balanced FoF (A1) 6,89 56 7,08 58 3,11 92 3,64 85 *Old Mutual Balanced (R) 7,49 43 4,17 113 3,10 93 4,75 52 *Anchor BCI Managed (A) 5,39 112 6,07 72 3,06 94 2,89 105 2 *Investhouse Ci Balanced (A) 3,38 161 6,58 66 3,05 95 *Oasis Balanced Unit Trust (D) 3,50 154 1,39 154 3,03 96 2,90 104 1 *Old Mutual M-M Balanced FoF (A) 7,47 45 6,73 64 3,00 97 4,74 53 3 *PrivateClient BCI High Equity (B) 4,71 129 3,90 118 3,00 97 *Seed Balanced (A1) 3,85 151 1,88 148 2,96 98 3,57 87 3 *Cinnabar SCI Balanced Plus FoF (A) 5,12 118 5,05 97 2,89 99 3,77 81 2 *APS Ci Managed Growth (A) 5,64 103 5,42 85 2,84 100 3,89 77 3 *PWS BCI Moderate FoF (A) 4,77 127 4,63 107 2,81 101 *Wealthworks Prime Managed FoF (A) 6,47 75 6,68 65 2,77 102 4,25 68 3 Satrix Balanced Index (A1) 8,50 25 4,96 99 2,77 102 6,09 18 FNB Growth FoF (B1) 5,92 91 5,32 89 2,76 103 *PFPS Ci Balanced FoF (A) 5,50 108 4,86 101 2,76 103 4,62 55 3 *Rebalance BCI Balanced FoF (A) 4,77 127 5,24 94 2,71 104 3,06 99 2 *Old Mutual M-M Agg. Balanced FoF (A) 8,19 31 6,85 62 2,62 105 4,60 57 3 *Deton Prime Managed FoF (A) 4,25 139 3,36 129 2,53 106 3,70 83 2 *Old Mutual Core Balanced (A) 6,57 69 3,52 125 2,52 107 4,77 51 3 58 PERSONAL FINANCE | 1 ST QUARTER 2021
NAME 3 MONTHS 1 YEAR 3 YEARS 5 YEARS PLEX. % RANK % RANK % RANK % RANK NAME 3 MONTHS 1 YEAR 3 YEARS 5 YEARS PLEX. % RANK % RANK % RANK % RANK *Signature BCI Balanced FoF (A) 5,02 123 4,74 105 2,50 108 *Allan Gray Tax-Free Balanced (A) 6,14 84 4,07 114 2,50 108 *Ashburton Balanced (A) 4,18 144 3,12 132 2,50 108 3,46 90 2 Absa MM Core Growth (C) 5,42 111 3,11 133 2,48 109 Anchor BCI Diversified Growth (A) 6,03 88 2,41 140 2,48 109 *Prudential Balanced (A) 6,97 54 2,30 142 2,47 110 4,56 59 3 Sentio SCI Balanced (B2) 7,45 47 3,91 117 2,44 111 *Prescient Absolute Balanced (A1) 9,73 14 0,35 167 2,44 111 3,33 94 2 *Marriott Balanced FoF (A) 1,81 178 0,90 159 2,37 112 3,49 89 2 *Absa MM Growth FoF (A) 5,58 107 4,91 100 2,34 113 4,54 60 3 *Allan Gray Balanced (A) 6,29 79 3,58 123 2,30 114 4,78 50 3 Octagon SCI Growth FoF (B1) 6,23 80 2,42 139 2,23 115 Alexander Forbes Inv. Real Return Focus (A) 7,12 51 1,28 155 2,23 115 4,52 61 3 *Assetbase CPI + 6% Prescient FoF (A1) 4,40 135 0,56 164 2,17 116 2,94 103 2 *Median BCI Balanced FoF (A) 6,65 64 2,81 135 2,13 117 *PSG Wealth Moderate FoF (A) 6,60 67 3,65 122 2,09 118 3,81 79 Momentum Target 6 FoF (A) 5,30 115 1,25 156 2,03 119 PPS Balanced Index Tracker (A2) 8,17 32 4,03 116 2,00 120 4,62 55 *Skyblue BCI Cumulus Moderate FoF (A) 5,08 120 5,59 82 1,99 121 3,09 98 2 *Kanaan BCI Balanced FoF (A) 2,50 172 3,66 121 1,97 122 1,08 115 1 *Analytics Ci Balanced FoF (A) 4,14 145 3,47 127 1,93 123 3,80 80 2 *Nedgroup Inv. Core Accelerated (B) 8,16 33 3,87 120 1,90 124 *Aureus Nobilis BCI Managed (A) 6,15 83 0,68 161 1,89 125 *Affinity Ci Growth (A) 5,35 114 1,50 151 1,87 126 *Sanlam IM Balanced (R) 4,51 133 -1,26 175 1,86 127 4,29 66 *Select Manager BCI Balanced FoF (A) 5,90 92 2,16 146 1,85 128 3,05 100 2 *Amity BCI Managed Select (A) 8,15 34 2,19 144 1,79 129 3,34 93 2 *Dotport BCI Prudential FoF (A) 4,20 142 -1,62 177 1,67 130 2,51 110 1 *Element Balanced SCI (A) 4,22 140 -3,16 180 1,65 131 6,70 11 3 *Amplify SCI Balanced (A1) 6,64 65 2,26 143 1,64 132 *FAL BCI Balanced (A) 4,36 136 1,47 153 1,51 133 *Quattro Ci Growth FoF (A) 5,92 91 3,07 134 1,48 134 3,05 100 1 *Sharenet BCI Balanced (A) 3,65 153 0,79 160 1,46 135 1,36 114 1 *Momentum Focus 6 FoF (A) 6,52 71 1,10 157 1,27 136 GraySwan SCI Aggressive FoF (A) 7,56 41 1,48 152 1,23 137 Momentum Target 7 FoF (A) 6,12 85 0,97 158 1,23 137 *Capita BCI Balanced (A) 6,99 53 -0,93 174 1,17 138 2,12 113 2 NewFunds MAPPS™ Growth ETF 7,68 38 5,65 80 1,07 139 4,46 62 Perpetua SCI Balanced (A) 9,22 18 1,82 149 0,98 140 3,73 82 2 *BCI Best Blend Balanced (C) 7,73 37 -0,05 170 0,90 141 2,21 112 2 *API BCI Managed FoF (A) 7,73 37 0,53 165 0,89 142 3,34 93 2 *Corion Prime Growth (A) 5,65 102 1,39 154 0,87 143 3,39 92 2 *Brenthurst BCI Balanced FoF (A) 0,89 186 -2,68 179 0,86 144 Prime Shiraz Prudential Aggressive FoF (A) 9,52 16 -0,72 172 0,63 145 2,66 108 1 *1nvest High Equity Passive Bal. FoF (A) 7,16 50 0,65 163 0,37 146 *Momentum Focus 7 FoF (A) 6,75 62 0,53 165 0,34 147 2,97 102 2 *Absa Managed (A) 7,83 36 0,14 169 0,26 148 2,55 109 1 *Cadiz BCI Balanced (A) 3,20 165 -3,82 181 -0,05 149 3,03 101 2 *SA Asset Management BCI Managed (A) 3,44 157 3,54 124 -0,26 150 1,36 114 1 Perspective Balanced Prescient (A1) 8,66 24 -0,81 173 -0,34 151 *Caleo BCI Balanced FoF (A) 5,71 99 -1,55 176 -0,94 152 *PSG Balanced (A) 12,97 2 0,67 162 -1,90 153 3,34 93 NMRQL SCI Balanced (A) 3,24 164 3,20 131 -2,93 154 *Ampersand SCI CPI Plus 6 FoF (A) 3,40 160 -8,46 182 -3,74 155 -0,94 117 1 *Imalivest SCI Balanced (A) 3,88 150 -16,25 186 -4,16 156 -3,81 120 1 *Plexus Wealth BCI Balanced (A) 8,78 22 -11,35 184 -5,23 157 -0,38 116 1 *Bridge Balanced (A) 8,48 26 -10,77 183 -5,73 158 -2,08 118 1 *Bridge Managed Growth (A) 13,52 1 -13,40 185 -9,36 159 -2,23 119 1 IP Balanced (A) 5,50 108 24,69 2 *High Street High Equity Prescient (A1) 1,87 177 21,65 3 *Visio BCI Balanced (A) 6,53 70 16,85 6 PPS Managed (A2) 3,90 149 12,02 10 Autus Prime Diversified (A) 6,23 80 11,41 15 *Innovation BCI Balanced FoF (A) 2,10 176 10,70 18 Kruger Ci Balanced (A) 4,66 131 9,70 24 *TRG Balanced Prescient FoF (A1) 6,04 87 8,41 39 *RSA BCI Balanced (A) 5,09 119 8,27 41 *Imali BCI Passive Balanced (A) 4,10 146 7,79 49 PSG M-M Growth FoF (D) 11,05 8 7,73 51 NFB Ci Managed Growth FoF (A) 4,19 143 7,46 55 *Star Prime Balanced (C) 2,82 170 6,89 61 Synergy Ci Growth FoF (A) 4,28 138 6,00 74 *10X High Equity Index (A) 6,30 78 5,59 82 CoreShares Wealth Accumulation (A) 6,95 55 5,06 96 *Celerity Ci Balanced (B) 6,48 74 4,79 102 Ngwedi Global Balanced SNN Class I1 9,41 17 4,06 115 *PMK Managed Prescient FoF (A3) 8,78 22 3,90 118 *Sequoia BCI Managed Growth FoF (A) 6,78 61 3,39 128 *BlueAlpha BCI Balanced (C) 1,76 179 0,39 166 *Stelburg BCI Balanced FoF (A) 6,88 57 0,28 168 *Granate SCI Balanced (B) 12,46 4 *Oyster Catcher RealFin Balanced (A) 10,80 10 *Visio BCI SA Balanced (A) 9,94 11 *Investec W&I BCI Diversified Growth FoF (A) 7,89 35 *Fairtree Invest Strategic Factor Prescient (A1) 5,25 117 *New Road BCI Managed FoF (A) 5,05 122 *Weaver BCI Balanced FoF (A) 4,88 126 *Tantalum BCI Balanced (A) 4,25 139 Thebe Balanced ACI (A1) 4,00 147 Arithmetic Average 5,91 5,24 3,45 4,37 FTSE/JSE All Share index (J203) 9,75 7,00 3,12 6,36 INCOME FUNDS *Sasfin BCI Flexible Income (A) 4,60 6 8,41 8 10,00 1 11,23 1 5 *Mi-Plan IP Enhanced Income (A1) 2,54 37 8,17 10 9,78 2 10,05 2 5 Saffron SCI Active Bond (A) 6,24 2 9,89 4 9,36 3 9,06 6 3 Granate SCI Multi Income (B) 2,84 25 9,33 6 9,03 4 Marriott Core Income (A) 2,31 48 9,83 5 9,01 5 8,84 8 4 Marriott High Income FoF (A) 2,30 49 9,96 3 8,97 6 8,59 11 4 BCI Income Plus (C) 3,52 14 6,51 25 8,88 7 9,20 5 4 Fairtree Flexible Income Plus Prescient (A1) 2,88 24 6,37 30 8,73 8 9,58 4 5 *Saffron SCI Opportunity Income (A) 2,82 26 6,92 20 8,71 9 9,82 3 5 *Amplify SCI Strategic Income (A1) 3,00 23 8,40 9 8,62 10 8,71 10 4 Sharenet BCI Income Plus (A) 2,65 33 7,47 15 8,60 11 8,88 7 5 *Northstar SCI Income (A1) 1,51 79 9,33 6 8,50 12 8,07 17 4 Momentum Income Plus (A) 1,88 69 6,47 26 8,47 13 8,74 9 5 *Nedgroup Inv. Flexible Income (A) 1,89 68 6,41 27 8,46 14 8,24 12 Absa Flexible Income (A1) 1,80 71 7,40 16 8,28 15 Marriott Income (R) 1,73 74 7,57 14 8,12 16 7,99 19 4 Alexander Forbes Inv. Enhanced Income (A) 2,23 53 5,93 41 7,93 17 8,07 17 4 Absa Tactical Income (A) 1,93 66 8,74 7 7,89 18 *Cadiz BCI Absolute Yield (A) 2,40 44 5,81 47 7,81 19 8,21 13 4 *Visio BCI Unconstrained Fixed Interest (A) 4,21 8 7,95 12 7,79 20 *Cadiz BCI Enhanced Income (C) 1,43 80 5,25 56 7,69 21 7,60 30 4 *Select Manager BCI Income FoF (C) 2,66 32 7,00 19 7,66 22 Trésor SCI Income (B1) 3,35 17 6,76 21 7,62 23 7,30 36 2 Anchor BCI Flexible Income (A) 2,16 60 6,54 24 7,60 24 7,72 25 3 *Autus Prime Income Plus (A) 2,49 40 7,31 17 7,56 25 7,82 22 4 *Simplisiti BCI Income Plus FoF (A) 3,27 19 5,87 43 7,51 26 7,39 33 3 *Novare Capital Preserver FoF (A1) 2,61 34 6,34 31 7,50 27 7,69 27 3 *Ninety One Diversified Income (A) 1,93 66 6,13 35 7,50 27 7,60 30 *BCI Best Blend Flexible Income (C) 2,76 29 5,84 45 7,50 27 8,16 14 4 *Oasis Crescent Income (A) -0,11 89 7,04 18 7,49 28 6,50 45 3 PERSONAL FINANCE | 1 ST QUARTER 2021 59
DATABANK
DATABANK NAME 3 MONTHS 1 YEAR 3 YEARS 5 YEARS PLEX. % RANK % RANK % RANK % RANK NAME 3 MONTHS 1 YEAR 3 YEARS 5 YEARS PLEX. % RANK % RANK % RANK % RANK *Stanlib M-M Absolute Income (B1) 2,47 42 5,51 50 7,49 28 8,06 18 *Counterpoint SCI Enhanced Income (A1) 1,81 70 4,46 68 7,40 29 8,08 16 4 *Momentum Diversified Income (B1) 2,50 39 6,02 38 7,39 30 7,72 25 3 Salvo Prime Dyn. Income (A1) 2,58 35 5,85 44 7,37 31 *PortfolioMetrix BCI Income (A) 2,20 56 4,55 66 7,36 32 8,14 15 3 Select BCI Fixed Income (A) 2,18 58 6,39 29 7,33 33 7,09 39 2 PPS Flexible Income (A2) 2,21 55 4,73 64 7,23 34 7,76 24 *Personal Trust Income (A) 2,13 62 6,24 32 7,21 35 7,65 29 3 *Discovery Diversified Income (A) 1,89 68 5,98 39 7,21 35 7,29 37 3 *Hollard Prime Dyn. Income (B) 2,39 45 5,24 57 7,14 36 7,65 29 3 *Graviton SCI Flexible Income (A1) 2,50 39 5,83 46 7,13 37 7,89 20 3 *Prescient Income Provider (A1) 2,40 44 4,98 61 7,13 37 7,70 26 3 *FG IP Jupiter Income FoF (A) 2,30 49 5,35 53 7,10 38 7,72 25 3 *Rowan Capital BCI Income FoF (A) 2,50 39 5,29 55 7,10 38 *PSG Diversified Income (A) 3,43 16 8,16 11 7,06 39 7,66 28 *Old Mutual M-M Enhanced Income FoF (A) 2,77 28 5,67 48 7,02 40 7,57 31 3 *FNB Income FoF (B1) 2,53 38 5,07 59 7,00 41 *Ashburton Multi Manager Income (B1) 2,66 32 4,71 65 6,97 42 7,38 34 2 *Coronation Strategic Income (A) 2,36 46 4,54 67 6,91 43 7,85 21 2 *Caleo BCI Active Income (A) 2,55 36 3,87 75 6,88 44 Absa MM Income (C) 1,42 81 6,14 34 6,87 45 *Cinnabar SCI Income FoF (A) 2,35 47 5,45 52 6,84 46 7,18 38 3 Ashburton Stable (A) 2,01 64 5,01 60 6,84 46 7,31 35 2 CoreShares Preftrax ETF 13,60 1 -13,08 87 6,80 47 6,93 40 *Sanlam IM Active Income (A1) 1,79 72 5,16 58 6,64 48 7,55 32 3 *Prescient SA Income Provider (A1) 2,65 33 2,62 82 6,63 49 7,55 32 2 *27four Shariah Income Prescient (A1) 1,63 78 7,82 13 6,27 50 *Stanlib Flexible Income (A) 4,38 7 7,57 14 6,13 51 7,79 23 2 Momentum Optimal Yield (A) 1,01 84 3,74 77 6,02 52 6,09 47 2 *PSG Wealth Income FoF (A) 2,36 46 4,79 63 5,88 53 6,73 43 *Seed Income (A1) 2,69 30 2,50 84 5,82 54 6,60 44 2 Southchester IP Optimum Income (A) 0,69 87 4,41 70 5,67 55 5,92 48 1 Sanlam Diversified Income FoF (A3) 1,28 82 4,35 71 5,54 56 5,90 49 *Prudential Enhanced Income (A) 2,82 26 4,19 72 5,51 57 6,91 41 2 *Capita BCI Real Income (A) 2,12 63 2,69 81 5,47 58 6,75 42 2 Harvard House BCI Flexible Income (A) 5,35 3 3,79 76 5,42 59 5,64 50 2 Sasfin BCI Optimal Income (A) 1,69 75 5,01 60 5,41 60 Sanlam Alternative Income (A1) 0,76 86 3,91 74 4,84 61 5,12 52 *Ninety One Absolute Balanced (A) 0,59 88 3,39 79 4,27 62 4,56 53 *Element Specialist Income SCI (A) 3,48 15 -0,30 86 3,67 63 6,16 46 2 Bridge High Income (A) 4,12 10 3,55 78 3,50 64 5,34 51 1 Alexander Forbes Inv. Infl. Linked Bond (A) 5,09 4 2,60 83 1,43 65 2,33 55 1 Momentum Inflation Linked Bond (A) 4,98 5 1,97 85 1,15 66 2,63 54 1 Momentum Flexible Income (A) 3,14 21 11,65 1 PSG M-M Multi-Asset Income FoF (D) 3,30 18 10,50 2 *Intellivest BCI Income (A) 4,19 9 7,57 14 *Optimum BCI Income (A) 2,17 59 6,75 22 Ampersand SCI Income (A) 2,88 24 6,59 23 *Dotport BCI Income (A) 1,13 83 6,41 27 *Kagiso Islamic High Yield (A) 3,88 13 6,40 28 *TRG Income Prescient FoF (A1) 1,93 66 6,18 33 *Thyme Wealth IP Income Multi Asset (A) 3,02 22 6,11 36 *Quantum BCI Income (C) 2,25 51 6,09 37 *Ashburton Diversified Income (B) 3,95 12 5,95 40 Prime Flexible Income (A) 1,76 73 5,92 42 *Methodical BCI Income (B1) 2,15 61 5,65 49 Octagon SCI Flexible Income FoF (B1) 2,48 41 5,48 51 *Investec W&I BCI Active Income FoF (A) 1,90 67 5,35 53 Sygnia Enhanced Income (A) 2,24 52 5,33 54 *PMK Income Prescient FoF (B4) 1,67 76 4,96 62 Investec Specialist Inv. BCI Enh. Income (A) 0,94 85 4,42 69 Laurium Income Prescient (A1) 2,29 50 4,01 73 *10X Defensive Index (A) 1,64 77 2,97 80 Dalebrook Multi-Asset Income Prescient (A1) 4,02 11 *New Road BCI Income FoF (A) 3,24 20 Corion Prime Income (A) 2,79 27 *Tantalum BCI Strategic Income (A) 2,68 31 *Financial Fitness Div. Income IP FoF (A) 2,66 32 Prescient Income Plus (A2) 2,42 43 *Sequoia BCI Flexible Income (A) 2,31 48 *Old Mutual Albaraka Income (A) 2,22 54 *Delta 4 BCI Income (A) 2,19 57 *Argon BCI Flexible Income (A) 2,00 65 Arithmetic Average 2,62 5,69 7,07 7,54 LOW EQUITY FUNDS *Amplify SCI Wealth Protector (B5) 6,14 14 10,06 7 10,63 1 *Select BCI Cautious (A) 7,29 8 11,05 3 9,30 2 8,63 1 5 *Nedgroup Inv. Stable (A) 2,67 105 11,63 1 8,54 3 6,56 12 *Rezco Stable (A) -1,64 139 8,76 13 8,47 4 5,13 53 3 Absa Inflation Beater (A) 2,69 104 6,68 38 8,18 5 7,81 2 5 *Financial Fitness IP Stable FoF (A) 1,11 128 7,90 20 8,15 6 *Ninety One Cautious Managed (A) 2,06 117 8,81 12 7,97 7 6,42 16 FNB Stable FoF (B1) 4,16 55 6,90 32 7,43 8 *Multi Asset IP Balanced Defensive (B1) 3,47 75 9,26 8 7,36 9 6,67 10 5 *Sygnia Skeleton Balanced 40 (A) 4,00 60 8,68 14 7,33 10 7,15 6 5 *Discovery Cons. Dyn. Asset Opt. FoF (A) 5,23 22 9,15 9 7,32 11 6,70 9 5 *H4 Stable (B1) 1,18 127 5,61 66 7,11 12 7,09 7 5 *Sanlam MM Defensive FoF (A2) 3,87 64 7,47 24 7,01 13 5,74 33 4 PPS Conservative FoF (A2) 4,17 54 7,13 27 6,96 14 6,53 13 *Montrose BCI Cautious FoF (A) 5,58 16 10,48 5 6,92 15 6,31 22 4 *Absa Smart Alpha Defensive (A) 2,90 98 11,58 2 6,90 16 *Assetbase CPI + 2% Prescient FoF (A1) 2,67 105 5,77 61 6,89 17 6,65 11 4 *Amplify SCI Defensive Balanced (A1) 4,12 56 7,93 18 6,87 18 7,54 3 5 *Sanlam MM Cautious FoF (A1) 3,71 68 6,82 35 6,86 19 6,37 19 4 *Sanlam MM Conservative FoF (A1) 2,75 103 5,77 61 6,71 20 7,17 5 5 *NFB Ci Stable (A) 3,77 65 6,80 36 6,65 21 7,01 8 5 *Instit BCI Stable FoF (A) 0,92 130 6,43 47 6,52 22 *Discovery Cautious Balanced (A) 4,71 36 6,60 39 6,46 23 6,48 14 4 *Platinum BCI Income Provider FoF (A) 0,28 135 5,43 70 6,45 24 5,64 37 4 *Wealth Associates BCI Cautious FoF (A) 3,47 75 4,53 87 6,38 25 *Autus Prime Stable (A) 1,11 128 10,12 6 6,34 26 4,77 65 3 *Mi-Plan IP Inflation Plus 3 (B5) 2,90 98 5,91 59 6,23 27 5,40 42 3 *Roxburgh Ci Conservative FoF (A) 3,08 89 7,92 19 6,19 28 *Stanlib Balanced Cautious (A) 4,77 32 10,75 4 6,13 29 5,36 43 3 *27four Stable Prescient FoF (A1) 4,67 38 5,63 65 6,12 30 6,08 26 4 *S BRO BCI Defensive FoF (A) 3,48 74 8,27 15 6,06 31 6,21 24 4 *Coronation Balanced Defensive (A) 4,75 33 6,43 47 5,91 32 5,87 29 4 *Stanlib M-M Low Equity FoF (B1) 5,38 19 6,84 34 5,90 33 6,31 22 *Nedgroup Inv. Core Guarded (B) 4,39 46 7,22 26 5,81 34 6,36 20 4 *Graviton SCI Low Equity (A1) 3,91 62 5,93 57 5,78 35 5,65 36 3 *IP Diversified Income FoF (A) 1,34 125 7,30 25 5,76 36 5,32 45 3 *Lynx Prime Cautious FoF (A1) 4,33 48 6,49 44 5,75 37 5,04 57 *Optimum BCI Stable (A) 2,61 106 5,93 57 5,75 37 5,90 28 4 *FG IP Venus Cautious FoF (A) 3,02 93 5,85 60 5,74 38 6,40 17 4 *Celtis BCI Conservative FoF (A) 3,11 87 8,20 16 5,70 39 5,98 27 4 *Sanlam IM Inflation Plus (A) 0,70 132 3,88 104 5,67 40 5,98 27 4 *Stonewood AM Ci Guarded (A) -0,25 137 8,20 16 5,66 41 5,13 53 3 Alexander Forbes Inv. Cons. Passive (A1) 4,64 39 7,71 23 5,66 41 *Point3 BCI Conservative FoF (A) 2,69 104 5,35 72 5,61 42 *Anchor BCI Diversified Stable (A) 3,48 74 4,93 80 5,61 42 *4D BCI Cautious FoF (A) 3,04 92 6,52 42 5,60 43 5,31 46 3 *BCI Stable FoF (3B1) 3,72 67 4,08 100 5,55 44 5,77 32 4 60 PERSONAL FINANCE | 1 ST QUARTER 2021
NAME 3 MONTHS 1 YEAR 3 YEARS 5 YEARS PLEX. % RANK % RANK % RANK % RANK NAME 3 MONTHS 1 YEAR 3 YEARS 5 YEARS PLEX. % RANK % RANK % RANK % RANK Denker SCI SA Stable (A) 0,99 129 5,25 74 5,54 45 *SIM Managed Conservative FoF (A1) 2,43 112 4,83 84 5,49 47 6,38 18 4 *Sygnia CPI + 2% (D) 3,43 77 5,92 58 5,45 48 5,41 41 3 *Corion Prime Stable (A) 3,61 71 5,58 67 5,40 49 6,34 21 4 *Adviceworx Old Mutual Infl. + 2-3% FoF (B1) 4,69 37 6,85 33 5,38 50 6,47 15 4 *Noble PP Stanlib Strategic Income FoF (A) 1,80 121 3,70 107 5,36 51 5,22 49 2 *Trésor SCI Stable (B1) 4,21 52 6,46 46 5,34 52 4,16 77 3 *Sasfin BCI Stable (A) 4,74 34 4,47 88 5,33 53 5,72 34 4 Prime Cabernet Stable FoF (A) 4,75 33 3,15 119 5,33 53 4,76 66 3 Octagon SCI Cautious FoF (B1) 4,05 58 5,43 70 5,32 54 *Old Mutual Real Income (A) 2,79 101 3,85 105 5,29 55 6,23 23 3 *Old Mutual Core Conservative (A) 4,75 33 6,95 31 5,27 56 *Kagiso Stable (A) 11,46 1 -3,94 142 5,17 57 7,49 4 4 *PBi BCI Conservative FoF (A) 3,22 84 5,25 74 5,15 58 5,53 40 3 *ABAX SA Absolute Prescient (A1) 3,32 83 3,45 113 5,11 59 *Southern Charter BCI Defensive FoF (A) 4,28 50 8,88 11 5,10 60 4,54 68 3 *Satrix Low Equity Balanced Index (A1) 5,30 21 6,58 40 5,04 61 5,69 35 *Stanlib M-M Defensive Balanced (B1) 4,75 33 6,47 45 5,04 61 5,17 52 3 *Methodical BCI Stable (A) 2,01 118 5,98 56 5,02 62 5,24 47 3 *Hollard Prime Strategic Defensive FoF (B) 4,88 30 5,39 71 5,02 62 5,80 31 3 *Personal Trust Conservative Managed (A) 2,34 113 8,10 17 5,00 63 5,23 48 3 *Old Mutual M-M Cautious FoF (A) 5,16 23 6,08 54 4,99 64 6,13 25 4 *Cinnabar SCI Stable FoF (A) 3,44 76 5,75 62 4,98 65 5,08 55 3 *PrivateClient BCI Low Equity (B) 3,08 89 4,96 79 4,94 66 *AssetMix Ci Conservative (A) 1,41 124 5,74 63 4,88 67 4,59 67 2 *Wealthworks Prime Cautious FoF (A) 4,45 43 5,44 69 4,86 68 5,19 50 3 *Dynasty Ci Wealth Preserver (A2) -0,36 138 1,77 130 4,86 68 5,24 47 3 *Quattro Ci Cautious FoF (A) 2,76 102 5,70 64 4,84 69 4,96 59 3 *Alexander Forbes Inv. Stable FoF (A) 2,94 96 4,88 81 4,83 70 4,83 62 3 CoreShares OUTcautious Index (O) 5,99 15 6,04 55 4,82 71 *PFPS Ci Cautious FoF (A) 3,38 79 5,06 76 4,79 72 5,90 28 3 Prescient Absolute Defensive (A2) 9,59 2 2,01 127 4,78 73 *N-e-FG BCI Income Provider (A) 3,39 78 6,09 53 4,75 74 5,61 38 3 *Counterpoint SCI Cautious (A1) -2,40 140 -0,44 136 4,73 75 4,23 75 2 GraySwan SCI Cautious FoF (A) 4,83 31 3,73 106 4,69 76 *Cadiz BCI Stable (A) 3,15 86 3,92 103 4,64 77 5,54 39 3 *Oasis Crescent Balanced Stable FoF (D) 0,41 134 3,18 117 4,62 78 4,02 80 2 *Moore Ci Stable FoF (A) 1,41 124 4,93 80 4,61 79 4,82 63 2 *Amity BCI Steady Growth (A) 5,08 25 6,96 30 4,58 80 5,18 51 3 *AS Forum BCI Cautious FoF (A) 3,06 91 6,10 52 4,52 81 4,47 72 3 *Brenthurst BCI Cautious FoF (A) 0,73 131 4,25 95 4,49 82 *Aureus Nobilis BCI Cautious (A) 4,69 37 4,14 97 4,49 82 Absa MM Core Preserver (C) 2,84 99 2,33 124 4,49 82 3,56 88 2 *PWS BCI Cautious FoF (A) 3,09 88 6,54 41 4,40 83 *Quantum BCI Capital Plus FoF (A) 2,43 112 3,64 109 4,37 84 4,28 73 2 *Absa MM Preserver FoF (A) 3,36 80 4,86 82 4,30 85 5,03 58 2 *BCI Best Blend Cautious (C) 5,06 26 4,85 83 4,28 86 4,53 69 3 *Allan Gray Stable (A) 4,00 60 3,43 114 4,26 87 5,72 34 3 *Old Mutual Stable Growth (A) 5,41 18 4,26 94 4,19 88 5,33 44 3 *APS Ci Cautious (A) 3,07 90 4,30 93 4,14 89 4,88 61 3 *Bovest BCI Conservative FoF (A) 3,35 81 6,73 37 4,08 90 4,79 64 2 *Rebalance BCI Cautious FoF (A) 3,34 82 4,99 78 4,07 91 4,25 74 2 *Signature BCI Stable FoF (A) 3,63 70 4,25 95 4,06 92 *Affinity Ci Cautious (A) 3,68 69 4,39 90 4,05 93 *Old Mutual Capital Builder (A) 2,32 114 7,10 28 4,04 94 5,07 56 2 Sage SCI Protection Solution FoF (A2) 2,80 100 4,11 99 4,00 95 4,50 71 2 *Analytics Ci Cautious FoF (A) 1,63 123 3,17 118 3,81 96 4,93 60 2 *Dinamika BCI Conservative FoF (A) 3,01 94 4,13 98 3,78 97 3,85 85 2 *Investhouse Ci Cautious (A) 2,00 119 6,30 49 3,74 98 *Stewart BCI Absolute Return Blend FoF (A) 1,93 120 2,02 126 3,61 99 5,12 54 2 *Select Manager BCI Cautious FoF (A) 4,64 39 4,07 101 3,59 100 4,14 78 2 *SA Asset Management BCI Cautious (A) 3,04 92 4,70 86 3,53 101 4,04 79 1 Momentum Target 3 FoF (A) 4,29 49 4,35 92 3,53 101 *Stonewood AM Ci Temperate (A) 0,04 136 2,69 122 3,46 102 3,99 82 2 *Absa Absolute (A) 5,01 27 2,97 120 3,41 103 3,73 86 1 *Element Real Income SCI (A) 4,41 44 -1,08 139 3,33 104 5,84 30 3 *Dotport BCI Cautious FoF (A) 2,09 116 0,61 134 3,25 105 4,01 81 2 *PSG Wealth Preserver FoF (A) 3,92 61 3,53 112 3,20 106 4,16 77 Momentum Defensive Growth (A) 4,34 47 1,94 129 3,15 107 *Argon BCI Absolute Return (A) 2,79 101 1,47 131 3,15 107 *Momentum Focus 3 FoF (A) 4,98 28 3,94 102 2,80 108 4,19 76 2 *Capita BCI Cautious (A) 4,95 29 2,00 128 2,78 109 3,92 84 2 *Edge BCI Cautious FoF (A) 4,72 35 2,28 125 2,73 110 *Seed Stable (A1) 2,10 115 -0,27 135 2,67 111 3,64 87 2 *API BCI Stable FoF (A) 4,52 40 2,82 121 2,59 112 3,93 83 2 NewFunds MAPPS™ Protect ETF 6,23 12 5,54 68 2,31 113 4,54 68 *Oasis Balanced Stable FoF (D) 4,09 57 -0,54 137 2,27 114 2,71 92 1 Momentum SA Defensive Growth (A) 8,30 5 3,37 115 2,23 115 *Skyblue BCI Kimberlite Cautious FoF (A) 3,55 73 5,85 60 1,62 116 3,29 89 1 MFS SCI Cautious FoF (B1) 4,02 59 -1,22 140 1,51 117 *PSG Stable (A) 7,90 6 1,36 132 1,47 118 4,52 70 *BCI Real Return (A) 3,09 88 -5,30 144 1,43 119 4,50 71 2 Allan Gray Optimal (A) 1,68 122 -5,47 145 1,41 120 3,85 85 1 *1nvest Low Equity Passive Balanced FoF (A) 4,20 53 1,33 133 1,13 121 *Ashburton Targeted Return (B4) 6,15 13 -2,21 141 0,94 122 2,84 90 1 *Prudential Inflation Plus (A) 5,33 20 -0,70 138 0,11 123 2,77 91 1 *Ampersand SCI CPI Plus 2 FoF (A) 3,89 63 -4,24 143 -0,66 124 1,41 93 1 *Plexus Wealth BCI Conservative (A) 7,54 7 -8,21 146 -2,80 125 0,99 94 1 *Bridge Stable Growth (A) 9,49 3 -9,63 147 -6,07 126 -0,13 95 1 PSG M-M Cautious FoF (D) 7,03 9 9,12 10 Kruger Ci Prudential (A) 2,46 111 7,78 21 *RSA BCI Cautious (C) 4,27 51 7,72 22 *TRG Stable Prescient FoF (A1) 3,34 82 7,01 29 Autus Prime Cautious (A) 1,22 126 6,51 43 Ginsburg & Selby SCI Stable FoF (A1) 2,55 108 6,31 48 Synergy Ci Conservative FoF (A) 2,69 104 6,25 50 Ngwedi Absolute Return SNN Class I1 5,13 24 6,17 51 *Star Prime Stable (C) 2,60 107 5,92 58 *Celerity Ci Conservative (B) 3,48 74 5,29 73 Constellation Protected Growth Prescient (A1) 2,54 109 5,06 76 *Instit BCI Managed (A) 3,17 85 5,05 77 *NFB Ci Defensive FoF (A) 2,99 95 4,72 85 *PMK Stable Prescient FoF (A3) 5,53 17 4,53 87 *WellsFaber Stable SCI FoF (A) 3,74 66 4,45 89 Mianzo CPI + 3% ACI (A1) 6,66 11 4,38 91 Laurium Stable Prescient (A1) 0,65 133 4,23 96 PPS Defensive (A2) 4,49 41 3,85 105 *10X Low Equity Index (A) 3,01 94 3,67 108 *Sequoia BCI Stable FoF (A) 4,40 45 3,61 110 Absa MM Passive Preserver (A) 2,93 97 3,54 111 *Stelburg BCI Cautious FoF (A) 4,47 42 3,34 116 CoreShares Stable Income (A) 6,74 10 2,57 123 *Oyster Catcher RealFin Stable (A) 9,13 4 *New Road BCI Stable FoF (A) 3,56 72 *Weaver BCI Stable FoF (A) 2,50 110 Arithmetic Average 3,63 4,85 4,79 5,19 MEDIUM EQUITY FUNDS *Foord Conservative (A) 4,18 56 8,99 6 7,55 1 6,01 6 5 *Sasfin BCI Balanced (A) 4,31 54 8,10 11 6,68 2 5,82 11 4 *Platinum BCI Balanced FoF (A) 1,40 83 7,67 14 6,66 3 5,06 25 4 Kagiso Protector (A) 11,82 1 1,85 77 6,64 4 8,28 1 5 *Southern Charter BCI Balanced FoF (A) 6,07 15 11,97 1 6,62 5 5,73 12 5 PERSONAL FINANCE | 1 ST QUARTER 2021 61
DATABANK
DATABANK NAME 3 MONTHS 1 YEAR 3 YEARS 5 YEARS PLEX. % RANK % RANK % RANK % RANK NAME 3 MONTHS 1 YEAR 3 YEARS 5 YEARS PLEX. % RANK % RANK % RANK % RANK *Sygnia Skeleton Balanced 60 (A) 5,13 33 8,82 7 6,49 6 6,65 2 5 *Multi Asset IP Balanced (B1) 4,86 41 8,55 9 6,41 7 5,99 7 5 *Stanlib M-M Real Return (B1) 5,46 26 7,98 12 6,07 8 5,85 10 *Discovery Moderate Dyn. Asset Opt. FoF (A) 7,62 3 10,09 3 6,06 9 6,40 3 5 *Montrose BCI Moderate FoF (A) 6,62 9 11,34 2 5,95 10 5,51 15 4 PPS Moderate FoF (A2) 5,16 32 7,25 20 5,92 11 6,08 4 *Amplify SCI Absolute (A1) 5,44 27 6,57 26 5,90 12 *Wealth Associates BCI Moderate FoF (A) 4,82 42 5,18 49 5,90 12 *Roxburgh Ci Balanced FoF (A) 5,18 30 8,55 9 5,85 13 *SIM Managed Moderate FoF (A1) 6,11 12 4,97 50 5,67 14 6,07 5 4 *Aeon Balanced Prescient (A1) 4,81 43 9,05 5 5,65 15 5,94 8 5 *Mergence CPI + 4% Prime (A1) 4,25 55 7,50 16 5,54 16 5,63 13 4 FNB Moderate FoF (B1) 5,43 28 5,84 35 5,54 16 *Sygnia CPI + 4% (D) 5,44 27 7,79 13 5,46 17 5,11 22 4 *FG IP Saturn Flexible FoF (A) 4,69 45 6,30 28 5,23 18 5,07 24 4 *Melville Douglas Stanlib Med. Equity FoF (A) 5,91 17 5,64 38 5,21 19 5,31 19 4 *Mi-Plan IP Inflation Plus 7 (B5) 2,47 78 5,27 46 5,03 20 4,28 42 3 *Mi-Plan IP Inflation Plus 5 (B5) 3,35 70 5,74 36 4,93 21 4,34 40 3 *Chrome Ci Moderate (A) 4,55 49 8,18 10 4,92 22 *Discovery Moderate Balanced (A) 5,47 25 5,37 44 4,88 23 5,59 14 4 *Prescient Positive Return QuantPlus (A1) 6,07 15 1,60 80 4,81 24 5,27 20 3 *Quattro Ci Moderate FoF (A) 2,72 77 7,17 22 4,80 25 4,79 30 3 *PrivateClient BCI Medium Equity (B) 4,48 50 5,91 34 4,74 26 *Adviceworx Old Mutual Infl. + 3-4% FoF (B1) 5,17 31 7,30 17 4,68 27 5,90 9 4 *Assetbase CPI + 4% Prescient FoF (A1) 3,53 66 4,05 57 4,64 28 4,80 29 3 *Counterpoint SCI Moderate (A1) -4,24 88 1,16 83 4,63 29 3,97 46 3 *Moore Ci Balanced FoF (A) 4,69 45 6,43 27 4,61 30 4,44 37 3 *Optimum BCI Balanced (A) 3,92 58 4,66 53 4,61 30 4,67 33 3 *Foster BCI Moderate FoF (A) 6,16 11 6,22 30 4,60 31 4,22 44 3 *Stanlib M-M Medium Equity FoF (B1) 6,73 7 7,27 19 4,57 32 5,46 17 *ADB BCI Balanced FoF (A) 7,17 5 7,29 18 4,56 33 5,09 23 4 CoreShares OUTstable Index (O) 6,57 10 5,44 42 4,56 33 *Hollard Prime Strategic Balanced FoF (B) 5,76 19 6,07 31 4,51 34 5,47 16 3 *Coronation Capital Plus (A) 6,96 6 6,84 24 4,38 35 4,83 28 3 *27four Balanced Prescient FoF (A1) 5,75 20 4,31 56 4,28 36 4,74 32 4 *Graviton SCI Medium Equity (A1) 4,88 40 5,96 32 4,27 37 4,61 35 3 *AS Forum BCI Moderate FoF (A) 4,36 53 7,19 21 4,26 38 3,79 49 3 *S BRO BCI Balanced FoF (A) 3,87 60 7,79 13 4,23 39 4,85 27 3 *Old Mutual M-M Defensive FoF (A) 6,07 15 6,76 25 4,20 40 5,41 18 4 *Chrome Ci Defensive (A) 3,06 72 7,15 23 4,17 41 *AssetMix Ci Moderate (A) 3,52 67 5,19 48 4,17 41 4,30 41 3 *Novare Balanced (A1) 2,83 75 3,94 58 4,15 42 *Noble PP Stanlib Balanced FoF (A) 1,86 80 3,46 65 4,11 43 4,46 36 1 *Cinnabar SCI Balanced FoF (A) 4,86 41 5,67 37 4,04 44 4,26 43 2 *Anchor BCI Diversified Moderate (A) 4,68 46 3,61 63 3,97 45 *Absa MM Passive Accumulation (B) 3,73 63 3,64 62 3,95 46 *Stanlib Absolute Plus (A) 5,39 29 6,24 29 3,93 47 5,21 21 3 *Oasis Crescent Balanced Prog. FoF (D) 1,59 81 2,40 75 3,71 48 3,70 51 *APS Ci Moderate (A) 4,81 43 4,87 51 3,60 49 4,39 39 3 Absa MM Core Accumulation (C) 3,89 59 2,70 74 3,59 50 3,40 55 2 *Quantum BCI Balanced FoF (A) 2,73 76 3,33 68 3,50 51 3,79 49 2 *Sage SCI Moderate Solution FoF (A2) 5,63 23 4,68 52 3,39 52 3,52 53 2 *Old Mutual Moderate Balanced (A) 7,21 4 3,76 61 3,38 53 4,80 29 3 *Absa MM Accumulation FoF (A) 4,82 42 5,36 45 3,35 54 4,63 34 3 *Old Mutual Albaraka Balanced (A) 4,97 38 3,25 70 3,33 55 4,14 45 2 *Destiny BCI Prudential FoF (A) 4,71 44 4,65 54 3,25 56 3,74 50 2 *Nedgroup Inv. Opportunity (A) 4,89 39 -2,70 88 3,24 57 4,43 38 3 *IP Prudential FoF (A) 1,03 85 4,54 55 3,17 58 3,22 56 1 *Fairtree Flexible Balanced Prescient (A1) 1,90 79 1,36 82 3,07 59 4,77 31 3 *PFPS Ci Moderate FoF (A) 4,37 52 3,80 60 3,06 60 5,01 26 3 *Affinity Ci Moderate (A) 5,57 24 3,48 64 2,86 61 Momentum Target 4 FoF (A) 5,13 33 2,95 72 2,84 62 *Analytics Ci Moderate FoF (A) 3,04 73 2,92 73 2,74 63 4,34 40 2 GraySwan SCI Moderate FoF (A) 5,95 16 1,71 79 2,54 64 *Old Mutual Dyn. Floor (A) 5,08 36 3,32 69 2,36 65 3,80 48 2 *Select Manager BCI Moderate FoF (A) 5,71 21 3,61 63 2,32 66 3,45 54 2 *Momentum Focus 4 FoF (A) 5,86 18 3,61 63 2,31 67 *Absa Balanced (R) 5,09 35 2,22 76 2,24 68 3,92 47 *Amity BCI Prudent FoF (A) 6,68 8 3,41 66 2,08 69 2,72 60 2 *Capstone BCI Balanced (A) 4,99 37 3,91 59 1,94 70 3,20 57 2 Momentum Target 5 FoF (A) 5,70 22 0,73 84 1,86 71 Stonewood AM Ci Diversified Growth (A) 1,06 84 0,27 86 1,75 72 3,62 52 2 *Engelberg IP Balanced (A) 0,66 86 1,82 78 1,53 73 IFM Balanced Value FoF (A) -0,47 87 1,41 81 1,50 74 -1,09 63 1 *SA Asset Management BCI Moderate (A) 3,54 65 3,36 67 1,28 75 2,50 61 1 *MFS SCI Moderate FoF (B1) 3,83 61 -0,66 87 1,09 76 *Momentum Focus 5 FoF (A) 6,08 14 0,58 85 0,74 77 3,16 58 2 *Baroque BCI Moderato FoF (A) 3,17 71 4,97 50 0,53 78 2,77 59 1 *Ampersand SCI CPI Plus 4 FoF (A) 3,38 69 -7,97 89 -3,25 79 -0,33 62 1 *Caleo BCI Moderate FoF (A) 4,56 48 9,58 4 *Methodical BCI Absolute (A) 2,90 74 8,60 8 *TRG Moderate Prescient FoF (A1) 4,65 47 7,58 15 *Old Mutual Core Moderate (A) 6,10 13 5,95 33 Synergy Ci Moderate FoF (A) 3,81 62 5,62 39 *Celerity Ci Moderate (B) 5,10 34 5,57 40 *BCI Multikor Moderate FoF (A) 4,17 57 5,55 41 *PMK Balanced Prescient FoF (A3) 8,97 2 5,40 43 PPS Stable Growth (A2) 3,62 64 5,26 47 Sanlam IM Medium Equity (A1) 1,54 82 3,22 71 *10X Medium Equity Index (A) 5,39 29 2,70 74 *New Road BCI Moderate FoF (A) 4,46 51 *Weaver BCI Moderate FoF (A) 3,51 68 Arithmetic Average 4,61 5,02 4,11 4,55 TARGET DATE FUNDS *Discovery Target Retirement 2015 (A) 5,18 9 5,67 1 4,79 1 5,15 1 *Discovery Target Retirement 2020 (A) 5,10 10 4,76 2 4,33 2 4,82 2 *Discovery Target Retirement 2025 (A) 5,72 7 4,49 3 3,74 3 4,37 3 *Discovery Target Retirement 2030 (A) 5,70 8 2,77 4 2,99 4 3,92 4 *Discovery Target Retirement 2035 (A) 6,35 6 1,67 5 2,29 5 3,46 5 *Discovery Target Retirement 2040 (A) 6,86 5 1,40 7 1,98 6 3,20 6 *Discovery Target Retirement 2050 (A) 7,68 2 1,14 8 1,87 7 2,98 8 *Discovery Target Retirement 2045 (A) 6,94 4 0,80 9 1,63 8 3,15 7 Discovery Target Retirement 2055 (A) 7,53 3 1,41 6 Discovery Target Retirement 2060 (A) 7,77 1 0,67 10 Arithmetic Average 6,60 2,50 3,00 3,75 SOUTH AFRICAN INTEREST BEARING SHORT-TERM FUNDS Truffle SCI Income Plus (A) 3,14 1 6,19 16 9,37 1 PSG Income (A) 1,96 7 9,51 1 8,59 2 8,61 5 Central Fundisa (B)8 1,64 14 7,03 7 8,31 3 8,77 3 Nedgroup Inv. Fundisa (A) 1,65 13 6,98 8 8,28 4 8,74 4 Absa Core Income (A) 1,45 16 7,28 5 8,16 5 *Sanlam IM Enhanced Yield (A1) 1,36 19 6,51 12 8,12 6 8,85 1 3 Old Mutual Income (R) 1,95 8 8,23 2 8,05 7 8,83 2 2 *Absa Income Enhancer (R) 2,34 4 7,69 3 8,02 8 8,44 7 2 Stanlib Income (R) 1,92 9 6,55 11 7,99 9 8,53 6 4 *Alexander Forbes Inv. Income (A) 1,70 11 7,20 6 7,87 10 8,21 8 2 Ninety One High Income (R) 1,19 26 5,57 27 7,81 11 8,06 11 Stanlib M-M Enhanced Yield (B1) 1,73 10 6,62 9 7,72 12 8,03 12 4 PPS Enhanced Yield (A2) 1,18 27 6,16 18 7,69 13 8,06 11 Standard Bank Fundisa (A) 1,48 15 6,40 13 7,68 14 8,14 9 *Momentum Enhanced Yield (A) 1,22 24 6,56 10 7,66 15 8,06 11 4 62 PERSONAL FINANCE | 1 ST QUARTER 2021
WORLDWIDE EQUITY
NAME 3 MONTHS 1 YEAR 3 YEARS 5 YEARS PLEX. % RANK % RANK % RANK % RANK NAME 3 MONTHS 1 YEAR 3 YEARS 5 YEARS PLEX. % RANK % RANK % RANK % RANK *Ashburton Stable Income (A) 1,35 20 5,63 24 7,60 16 7,89 13 3 *Hollard Prime Yield-Plus (B) 1,38 18 6,09 19 7,55 17 7,72 18 3 *Prudential Income (A) 1,24 23 5,14 33 7,52 18 Prime Income Plus (A) 1,07 30 6,17 17 7,46 19 7,84 14 3 Coronation Jibar Plus (A) 0,98 33 6,26 14 7,44 20 7,72 18 4 Citadel SA Income H4 (B1) 1,08 29 5,78 23 7,42 21 7,83 15 4 *Alexander Forbes Inv. Superior Yield (A) 1,21 25 6,01 21 7,40 22 7,79 16 4 Prescient Yield QuantPlus (A1) 1,00 32 5,96 22 7,36 23 7,69 19 5 *Ashburton SA Income (B1) 2,06 6 5,14 33 7,34 24 8,07 10 2 Absa Fundisa (A) 1,33 21 6,07 20 7,18 25 7,73 17 *Nedgroup Inv. Core Income (B) 1,01 31 5,59 25 7,15 26 7,53 21 3 *Ninety One Stefi Plus (A) 0,92 34 5,58 26 7,06 27 7,42 22 Stanlib Enhanced Yield (A) 0,92 34 5,49 28 7,04 28 7,84 14 2 *Stanlib Extra Income (R) 1,14 28 5,45 30 7,02 29 7,73 17 2 Old Mutual Interest Plus (A) 0,72 39 5,46 29 6,94 30 7,42 22 3 *IP Interest Plus (A) 0,87 36 5,20 32 6,87 31 7,58 20 1 PSG Wealth Enhanced Interest (A) 0,89 35 5,33 31 6,84 32 7,18 23 Gryphon Dividend Income (A) 0,73 38 4,47 34 5,87 33 6,16 24 1 Terebinth SCI Enhanced Income (B1) 2,10 5 7,62 4 Sasfin BCI High Yield (A) 2,93 2 6,22 15 *Instit BCI Enhanced Yield (A) 1,25 22 6,16 18 IFM Income (E) 2,42 3 4,20 35 Anchor BCI Core Income (A) 1,66 12 *Vunani BCI Short Term Interest (A) 1,41 17 Abax SA Income Prescient (A1) 0,85 37 Arithmetic Average 1,40 6,19 7,58 8,03 VARIABLE-TERM FUNDS *Absa Bond (A) 6,10 27 11,96 2 10,39 1 11,59 1 5 Citadel SA Bond H4 (B1) 6,10 27 10,26 3 9,57 2 10,90 2 *Allan Gray Bond (A) 5,87 28 7,01 22 9,04 3 10,69 4 5 Nedgroup Inv. Core Bond (A) 6,27 26 9,35 4 8,92 4 10,53 6 4 PortfolioMetrix BCI Bond FoF (A) 6,76 13 9,33 5 8,78 5 10,71 3 4 Prescient Flexible Fixed Interest (A2) 3,16 33 6,91 25 8,68 6 Anchor BCI Bond (A) 6,74 15 7,99 12 8,67 7 *Stanlib Bond (A) 7,13 7 9,24 6 8,57 8 10,65 5 4 Absa Inflation Linked Income (A) 2,65 34 6,98 23 8,38 9 1nvest ALBI (Non-Tr) Index Tracker (A) 6,57 18 8,13 11 8,35 10 9,82 10 *Fairtree ALBI Plus Prescient (A1) 7,65 3 7,55 16 8,31 11 Momentum Bond (A) 6,75 14 7,10 21 8,25 12 9,84 9 3 Satrix Bond Index (A1) 6,56 19 7,84 13 8,24 13 9,80 11 Sygnia All Bond Index (A) 6,61 17 7,82 14 8,23 14 9,72 14 *Oasis Bond (D) 6,39 23 7,67 15 8,18 15 9,52 15 4 SIM Bond Plus (A) 6,96 11 6,90 26 8,18 15 9,97 7 3 *Ashburton Bond (A) 7,08 8 6,69 27 8,15 16 NewFunds GOVI ETF 6,61 17 8,19 10 8,09 17 9,73 13 *Ashburton Multi Manager Bond (B1) 7,17 6 7,48 17 8,06 18 9,79 12 3 Ashburton GOVI Tracker (A) 6,49 22 8,31 8 7,99 19 *Alexander Forbes Inv. Pure Fixed Interest (A) 7,05 9 7,34 18 7,92 20 9,72 14 3 Old Mutual Bond (R) 7,02 10 6,90 26 7,82 21 9,52 15 2 *Melville Douglas Stanlib Bond (A) 6,28 25 7,12 20 7,72 22 9,40 17 2 *Community Growth Gilt (A) 6,70 16 5,90 28 7,57 23 9,50 16 3 Coronation Bond (R) 6,38 24 5,90 28 7,57 23 9,50 16 3 *Prudential High Yield Bond (A) 7,58 4 4,96 31 7,16 25 9,24 18 1 Absa MM Bond (A) 5,26 29 7,20 19 7,10 26 8,12 20 2 Prescient Bond QuantPlus (A1) 8,14 2 4,98 30 6,53 27 9,03 19 2 Satrix ILBI ETF (A) 5,10 31 3,50 32 1,93 28 Ashburton Inflation ETF 5,17 30 3,46 33 1,64 29 2,54 21 NewFunds ILBI ETF 4,92 32 3,27 34 1,63 30 2,53 22 1nvest Inflation Linked Bond Index Tracker (A) 5,26 29 3,05 35 1,34 31 2,13 23 Colourfield BCI Income 2 (A) 6,74 15 -1,04 36 -2,08 32 -0,43 24 1 1nvest SA Bond ETF 9,31 1 17,90 1 Sygnia Enhanced All Bond (A) 6,82 12 8,47 7 Absa Bond Index (A) 6,61 17 8,20 9 Argon BCI Bond (A) 6,54 20 6,92 24 *Vunani BCI Bond (A) 7,38 5 Terebinth SCI Active Bond (B1) 6,57 18 Satrix SA Bond Portfolio ETF (A) 6,52 21 Arithmetic Average 6,48 7,16 7,12 8,85 SOUTH AFRICAN REAL ESTATE GENERAL FUNDS *True North IP Enhanced Property (A) -12,00 43 -26,15 3 -6,67 1 -4,23 3 2 Harvard House BCI Property (A) 24,91 14 -23,64 1 -10,20 2 -2,83 2 5 Catalyst SCI Flexible Property (A) 20,84 29 -25,30 2 -10,40 3 -2,76 1 5 Marriott Property Income (A) 21,23 28 -34,85 27 -14,25 4 -5,77 6 4 Oasis Property Equity (D) 14,08 42 -30,85 15 -15,72 5 -11,29 29 1 Anchor BCI Property (A) 19,97 31 -28,44 7 -16,00 6 -8,73 14 2 Old Mutual SA Quoted Property (A) 27,99 4 -29,40 8 -16,48 7 -7,30 10 4 Sesfikile BCI Property (A1) 20,03 30 -29,80 10 -16,82 8 -5,65 5 4 Hollard Prime Property (B) 18,85 36 -30,73 14 -16,99 9 -5,94 7 3 PortfolioMetrix BCI SA Property (A) 19,88 32 -28,03 6 -17,31 10 -5,56 4 4 Cadiz BCI Property (B) 18,16 37 -26,73 4 -17,97 11 -7,00 9 3 Ashburton Multi Manager Property (B1) 15,94 40 -32,71 18 -19,75 12 -8,25 12 2 MSM Property ACI (A1) 27,52 5 -30,27 12 -19,93 13 Alexander Forbes Inv. Property Equity (A) 19,87 33 -34,09 20 -20,04 14 -8,09 11 3 Ampersand SCI Flexible Property Income (A) 14,36 41 -32,91 19 -20,15 15 -9,27 18 1 Absa Property Equity (A) 22,90 19 -27,96 5 -20,30 16 -6,76 8 5 Metope Property Prescient (A) 24,16 15 -30,06 11 -20,42 17 -8,33 13 4 Discovery Flexible Property (A) 26,31 11 -35,26 31 -20,48 18 -9,43 20 3 Mazi Asset Management Prime Property (A) 22,93 18 -31,35 17 -20,51 19 -9,48 22 2 Plexus Wealth BCI Property (A) 32,16 1 -31,10 16 -20,60 20 -9,44 21 3 Catalyst SCI SA Property Equity (A) 28,76 3 -35,11 29 -20,74 21 -8,77 15 4 Coronation Property Equity (A) 27,39 6 -37,67 38 -20,92 22 -9,43 20 3 Satrix Property Index (A1) 21,92 23 -34,49 22 -21,00 23 -8,88 16 Absa Smart Alpha Property (A) 21,90 24 -30,36 13 -21,09 24 -9,63 24 3 Sygnia Listed Property Index (A) 23,49 17 -34,82 26 -21,14 25 -8,91 17 Momentum Real Growth Property Index (A) 21,74 25 -34,75 25 -21,16 26 1nvest SA Property ETF 22,04 22 -34,70 24 -21,18 27 -8,91 17 Momentum Real Growth Property (A) 19,42 34 -35,51 32 -21,41 28 -9,32 19 2 Citadel SA Property H4 (B1) 25,65 13 -34,94 28 -21,54 29 -9,55 23 2 Prudential Enhanced SA Property Tracker (A) 21,39 27 -35,59 33 -21,58 30 -9,44 21 3 Select BCI Property (A) 27,02 9 -39,66 41 -21,63 31 -9,86 27 3 Ninety One Property Equity (A) 29,37 2 -36,36 36 -21,75 32 -10,03 28 SIM Property (A) 27,20 7 -35,61 34 -21,81 33 -9,74 25 Momentum SA Real Growth Property (A) 19,10 35 -36,78 37 -22,02 34 Ashburton Property (A) 17,61 39 -35,17 30 -22,46 35 Stanlib Property Income (A) 22,14 21 -34,66 23 -22,47 36 -9,84 26 3 Nedgroup Inv. Property (A) 18,00 38 -29,56 9 -23,34 37 -12,57 30 1 Satrix Property ETF (A) 23,73 16 -40,88 42 -23,93 38 1nvest Capped Property Index Tracker (B3) 22,73 20 -38,54 40 -24,08 39 -13,73 31 Absa Property Index (A) 21,68 26 -34,33 21 Metope Property Income Prescient (A) 25,67 12 -36,08 35 CoreShares SA Property Income ETF 26,54 10 -37,68 39 Investec W&I BCI Property (A) 27,14 8 Arithmetic Average 21,91 -32,98 -19,36 -8,38 FTSE/JSE SA Listed Property Index (J253) 22,19 -34,49 -20,68 -8,42
DATABANK
GENERAL FUNDS H4 Worldwide Equity (B1) 3,30 4 11,36 5 8,58 1 6,87 1 Nest Egg BCI Worldwide Equity (A) 0,09 7 17,85 2 8,01 2 BCI Value (B) -0,44 9 14,25 4 5,17 3 Stewart BCI Macro Equity FoF (A) 3,29 5 11,15 6 4,53 4 4,03 2 CoreShares OUTaggressive Index (O) 7,85 2 5,13 7 4,10 5 PERSONAL FINANCE | 1 ST QUARTER 2021 63
DATABANK NAME 3 MONTHS 1 YEAR 3 YEARS 5 YEARS PLEX. % RANK % RANK % RANK % RANK NAME 3 MONTHS 1 YEAR 3 YEARS 5 YEARS PLEX. % RANK % RANK % RANK % RANK Corion Prime Worldwide Equity (A1) 7,32 3 3,95 8 1,87 6 Prime Worldwide Equity (A) 8,19 1 -6,25 9 -7,04 7 Innovation BCI Worldwide Equity (A) -0,19 8 25,80 1 Ashburton Global Leaders ZAR Equity Fdr (A) -3,84 10 16,14 3 Citadel Worldwide Equity H4 (B1) 1,63 6 Arithmetic Average 2,70 11,00 3,71 5,50 FTSE/JSE All Share index (J203) 9,75 7,00 3,12 6,36 UNCLASSIFIED FUNDS Old Mutual Gold (R) -24,98 2 25,38 1 31,29 1 20,17 1 Visio BCI Property (C) 22,02 1 Arithmetic Average -1,50 25,00 31,00 20,00 WORLDWIDE MULTI ASSET Flexible funds Naviga BCI Worldwide Flexible (A) 0,96 48 78,45 1 27,54 1 RCI BCI Flexible Growth Class L 9,02 3 54,65 2 21,50 2 RCI BCI Worldwide Flexible (A) -5,26 91 21,50 8 15,57 3 Select BCI Worldwide Flexible (A) -6,32 93 18,54 13 15,36 4 12,33 1 5 Coronation Optimum Growth (A) -0,75 67 22,34 7 15,34 5 10,98 2 5 Cordatus Worldwide Flexible Prescient (A2) -0,24 61 20,22 12 13,51 6 7,93 3 5 Consilium BCI Worldwide Flexible (A) -4,41 89 21,49 9 13,47 7 4,90 22 4 Quattro Ci Worldwide Flexible FoF (A) -2,68 79 16,04 22 13,41 8 6,60 11 4 Investhouse Ci Global Feeder (A) -5,58 92 17,14 18 13,07 9 Prime Worldwide Flexible (B) 2,13 35 16,03 23 12,33 10 7,91 4 5 Flagship IP Worldwide Flexible (A) 2,34 32 26,42 3 12,18 11 3,48 32 3 JBL SCI Worldwide Flexible FoF (B1) 1,51 41 10,73 47 12,05 12 Flagship IP Worldwide Flexible FoF (A) -3,85 86 21,15 10 11,85 13 4,53 25 3 Cohesive Capital WW Flex. Prescient (A2) 3,54 25 16,58 20 11,37 14 Platinum BCI Worldwide Flexible (A) -3,66 85 8,89 59 10,96 15 7,06 8 5 Providence BCI Worldwide Diversified (B) -1,85 75 13,81 33 10,90 16 7,27 7 4 Rootstock SCI Worldwide Flexible (A) -3,00 82 17,67 14 10,80 17 6,90 10 4 PPS Worldwide Flexible FoF (A2) 5,76 13 17,34 15 10,72 18 7,52 5 CS BCI Worldwide Flexible FoF (C) -0,78 68 13,74 35 10,69 19 Anchor BCI Worldwide Flexible (A) 1,02 46 11,52 42 10,68 20 5,64 16 4 Instit BCI Worldwide Flexible FoF (B) 0,21 56 17,31 16 10,49 21 Montrose BCI Flexible FoF (A) 2,57 30 14,14 31 10,06 22 6,01 13 4 Instit BCI Worldwide Equity (A) -1,19 71 14,39 29 9,97 23 Simplisiti BCI Flexible FoF (A) 1,54 40 22,56 6 9,86 24 5,42 18 4 Brenthurst BCI Worldwide Flexible FoF (A) -0,12 60 13,20 36 9,85 25 Optimum BCI Worldwide Flexible FoF (A) -7,77 95 10,50 52 9,74 26 4,04 29 3 Alexander Forbes Inv. Flexible FoF (A) 2,36 31 12,69 37 9,58 27 Financial Fitness IP Flexible FoF (A) -0,26 62 10,69 48 9,44 28 Signature BCI Worldwide Flexible FoF (A) 1,56 39 17,08 19 9,39 29 Lunar BCI Worldwide Flexible (A) 2,01 36 15,56 25 9,35 30 Sygnia Skeleton Worldwide Flexible (A) 8,00 5 12,69 37 9,11 31 Foord Flexible FoF (A) 2,26 33 14,84 28 9,03 32 5,52 17 3 Chrome Ci Maximum Return (A) 0,83 50 12,31 40 8,91 33 NFB Ci Worldwide Flexible (A) 3,86 21 7,31 66 8,79 34 Ginsburg & Selby SCI Worldwide Flexible (A1) 3,42 26 11,21 45 8,19 35 Cinnabar SCI Worldwide Flexible FoF (A) -0,70 65 13,79 34 8,15 36 4,62 24 3 Innovation BCI Worldwide Flexible (A) 1,20 43 23,58 4 8,14 37 BCI Worldwide Flexible FoF (3B1) 2,72 29 13,85 32 8,12 38 5,42 18 3 Southern Charter BCI WW Flexible FoF (A) 1,14 44 12,53 38 8,10 39 4,22 27 3 Marriott Worldwide FoF (A) -3,36 83 7,54 64 8,00 40 3,80 30 3 Old Mutual M-M Maximum Return FoF (A) 5,74 14 15,31 26 7,92 41 6,96 9 4 Celtis BCI Flexible FoF (A) 0,26 55 16,55 21 7,86 42 4,39 26 3 Nedgroup Inv. Bravata Worldwide Flexible (A) 3,84 22 7,69 63 7,86 42 5,13 19 3 Corion Prime Worldwide Flexible (A1) -0,07 59 10,65 49 7,84 43 Aureus Nobilis BCI Worldwide Flexible FoF (A) 0,01 58 11,43 44 7,82 44 Analytics Ci Worldwide Flexible FoF (A) -1,97 76 6,36 71 7,77 45 4,93 21 3 PWS BCI Worldwide Flexible FoF (A) 0,53 52 11,54 41 7,49 46 Prosperity IP Worldwide Flexible FoF (A) -1,31 72 1,38 85 7,43 47 7,51 6 4 Bovest BCI Worldwide Flexible FoF (A) 1,30 42 14,28 30 6,84 48 4,10 28 3 Autus Prime Worldwide Flexible (A) 3,59 24 15,19 27 6,64 49 3,20 38 3 Citadel Worldwide Flexible H4 (B3) -0,57 64 7,10 68 6,52 50 BCI Flexible (A) 5,95 12 11,17 46 6,48 51 5,84 15 3 Millenium BCI Worldwide Flexible FoF (B) 3,25 28 9,89 54 6,46 52 PrivateClient BCI Worldwide Flexible (B) 0,79 51 6,31 72 6,38 53 H4 Growth (B1) 1,96 38 5,90 77 6,23 54 6,20 12 4 Rebalance BCI Worldwide Flexible FoF (A) 0,53 52 9,77 56 5,68 55 2,89 40 2 Methodical BCI Worldwide Growth FoF (A) 2,25 34 10,21 53 5,61 56 4,67 23 3 Point3 BCI Moderate WW Flexible FoF (A) 3,41 27 7,45 65 5,52 57 API BCI Worldwide Opportunities FoF (A) 2,36 31 5,95 75 5,47 58 3,28 36 2 BCI Best Blend Worldwide Flexible (A) 4,72 18 7,99 62 5,40 59 2,71 41 2 Imalivest SCI WW Flexible (A) 0,30 53 -1,55 91 5,21 60 3,25 37 2 Dinamika BCI Worldwide Flexible (A) -0,46 63 7,22 67 5,16 61 3,30 35 2 4D BCI Aggressive Flexible FoF (A) 0,98 47 6,63 70 5,10 62 3,31 34 2 Old Mutual Maximum Return FoF (A) 6,56 10 8,41 61 5,03 63 4,94 20 3 Octagon SCI Worldwide FoF (B1) 5,13 16 6,26 73 4,97 64 Ninety One Worldwide Flexible (E) 3,83 23 10,61 50 4,85 65 Coronation Market Plus (A) 9,66 2 8,93 58 4,74 66 5,90 14 3 Select Manager BCI WW Flexible FoF (A) 1,98 37 4,55 79 4,38 67 Trésor SCI Flexible (B1) -2,45 78 3,44 81 4,15 68 2,01 43 1 Engelberg IP Global Feeder (A) -6,48 94 8,43 60 3,79 69 Olympiad BCI Worldwide Flexible FoF (A) 1,10 45 0,85 86 3,78 70 1,91 44 2 Cordatus WW Flexible Prescient FoF (A2) 5,74 14 9,88 55 3,14 71 3,78 31 2 PBI BCI Worldwide Flexible FoF (A) 5,57 15 2,79 83 2,88 72 FNB Growth Plus FoF (B1) 5,97 11 2,29 84 2,23 73 Novare Worldwide Flexible FoF (A1) 4,38 19 0,38 88 1,83 74 3,46 33 2 IP Worldwide Flexible FoF (B2) -1,48 73 5,38 78 1,28 75 2,10 42 1 Rock Capital IP Worldwide Flexible (A) 7,48 8 -3,70 92 0,34 76 0,60 46 1 Median BCI Worldwide Flexible FoF (A) 4,78 17 3,24 82 0,17 77 Stonewood BCI Worldwide Flexible (B) 0,92 49 0,23 89 -1,06 78 1,88 45 1 Blue Quadrant WW Flexible Prescient (A) 23,26 1 -0,89 90 -2,60 79 -0,06 48 2 Counterpoint SCI Worldwide Flexible (A) -2,70 80 -12,10 93 -3,25 80 3,17 39 Cadiz BCI Worldwide Flexible (A) -2,03 77 -15,80 94 -3,90 81 0,33 47 1 Instit BCI WW Moderate Aggressive Flex. (A) -4,57 90 23,24 5 Nest Egg BCI Worldwide Flexible (A) -4,29 88 21,02 11 BCI Worldwide Flexible Style (C) 0,29 54 17,15 17 BIP BCI Worldwide Flexible (E) -1,72 74 15,61 24 Red Oak BCI Worldwide Flexible FoF (A) 7,65 7 12,43 39 Harvard House BCI Worldwide Flexible (A) -0,93 69 11,45 43 BIP BCI Moderate Worldwide Flexible (C) 8,84 4 10,58 51 Synergy Ci Worldwide Flexible FoF (A) -3,42 84 9,32 57 Fairtree WW Multi-Strategy Flex. Presc. (A1) 1,56 39 6,76 69 PMK Worldwide Growth Prescient FoF (A3) 7,99 6 6,02 74 Rexsolom WW Flexible Prescient (A1) -2,89 81 5,93 76 Fussell Ci Worldwide Flexible (A) 7,37 9 3,63 80 Instit BCI Worldwide Flexible (A) 4,29 20 0,54 87 IP Worldwide Active Beta (A) 0,09 57 Naviga BCI Worldwide Flexible Growth (A) -0,71 66 Fisher Dugmore Ci Worldwide Flexible (A) -1,16 70 Cratos BCI Worldwide Flexible (A) -3,94 87 Arithmetic Average 1,35 11,71 7,82 4,78 MSCI World index -0,11 19,76 14,97 8,88 GLOBAL EQUITY GENERAL FUNDS IP Global Momentum Equity (A) 6,46 11 98,19 1 43,32 1 Anchor BCI Global Equity Feeder (A) 9,05 7 91,01 2 34,26 2 18,84 1 5 Sygnia Itrix 4th Ind. Rev. Global Equity ETF 18,73 2 68,05 3 31,92 3 Sygnia 4th Ind. Rev. Global Equity (A) 17,55 3 65,20 4 30,19 4 Autus Prime Global Equity Feeder (A) -3,98 78 29,69 9 20,14 5 10,14 6 5 Satrix S&P 500 Feeder ETF -1,73 66 24,29 20 19,94 6 64 PERSONAL FINANCE | 1 ST QUARTER 2021
NAME 3 MONTHS 1 YEAR 3 YEARS 5 YEARS PLEX. % RANK % RANK % RANK % RANK NAME 3 MONTHS 1 YEAR 3 YEARS 5 YEARS PLEX. % RANK % RANK % RANK % RANK CoreShares S&P 500 ETF -2,38 74 22,72 24 19,70 7 PSG Wealth Global Creator Feeder (A) -1,44 63 23,72 22 19,05 8 10,73 5 Stanlib Global Equity Feeder (A) -2,11 69 24,89 18 18,25 9 11,09 3 5 BlueAlpha BCI Global Equity (A) -5,85 87 24,59 19 18,13 10 11,91 2 5 Ninety One Global Franchise Feeder (A) -4,23 79 19,69 43 17,99 11 9,70 11 Melville Douglas Stanlib Global Equity Fdr (A) -2,34 72 20,64 37 17,56 12 Sygnia Itrix MSCI World Index ETF 0,17 47 21,45 31 16,89 13 10,82 4 Nedgroup Inv. Global Equity Feeder (A) -2,09 68 17,27 50 16,85 14 9,81 9 4 Satrix MSCI World Equity Feeder ETF 0,06 49 22,01 26 16,71 15 M1 Capital Global Equity Prescient (A1) 0,21 45 28,36 11 16,61 16 Sygnia Skeleton International Equity FoF (A) 0,70 42 21,83 27 16,06 17 9,96 7 4 ABAX Global Equity Prescient Feeder (A1) 2,14 29 27,31 13 15,80 18 Mi-Plan IP Sarasin Equisar Feeder (B5) 2,81 27 17,91 47 15,57 19 8,77 19 4 Satrix MSCI World Equity Index Feeder (A1) -0,06 51 19,99 42 15,56 20 9,71 10 Foord Global Equity Feeder (A) 1,26 35 27,66 12 15,38 21 9,19 15 Stanlib M-M Global Equity Fdr (A) 3,28 23 20,23 40 15,12 22 9,26 14 4 Fairtree Global Equity Prescient (A1) -0,17 52 25,01 17 15,05 23 Stylo Global Equity Prescient FoF (A1) 0,64 43 20,81 36 14,68 24 Coronation Global Opp. Equity [ZAR] Fdr (A) 8,88 8 20,52 38 14,55 25 8,38 20 3 Alexander Forbes Inv. Global Equity Fdr (A) 1,13 38 20,12 41 14,39 26 9,53 13 4 Absa Global Core Equity Feeder (A) -0,05 50 17,18 51 14,23 27 8,98 17 4 27four Global Equity Prescient Feeder (A1) 1,14 37 15,61 56 14,07 28 7,46 25 3 Gryphon Global Equity (B) -0,62 56 17,10 52 13,93 29 8,35 21 3 Discovery Global Equity Feeder (A) 0,12 48 21,04 34 13,75 30 7,90 23 3 Citadel Global Equity H4 FoF (B1) -1,09 60 16,91 53 13,66 31 9,17 16 3 Coronation Global Equity Select [ZAR] Fdr (A) 3,45 21 17,71 48 13,62 32 9,84 8 4 PortfolioMetrix BCI Global Equity FoF (A) 1,84 31 17,68 49 13,46 33 8,89 18 3 Old Mutual Global Equity (R) 0,62 44 19,23 44 13,45 34 9,60 12 Ninety One Global Strategic Equity Feeder (R) 3,14 25 21,36 32 13,21 35 7,75 24 Select Manager BCI Global Equity FoF (A) -0,50 55 18,39 46 12,79 36 Marriott First World Equity Feeder (A) -5,49 84 12,20 60 11,78 37 4,77 34 2 Satrix MSCI Emerging Markets Feeder ETF 5,09 13 24,22 21 11,71 38 Prudential Global Equity Feeder (A) 1,50 34 15,83 54 11,64 39 8,05 22 3 Sanlam PW Global High Quality Feeder (A1) -4,75 80 10,25 62 11,60 40 Sasfin BCI Global Equity Feeder (A) -1,90 67 13,00 59 11,58 41 Prescient Global Equity Feeder (A1) -0,91 59 15,75 55 11,25 42 6,59 27 3 Oasis Crescent International Feeder (D) -1,26 62 12,20 60 11,20 43 4,50 36 2 Momentum International Equity Feeder (A) 1,00 39 13,38 58 11,06 44 7,25 26 3 Element Global Equity SCI (B) 3,31 22 9,88 64 10,69 45 5,65 29 3 Sanlam Global Equity (R) -2,23 71 11,95 61 10,37 46 5,45 30 BCI Best Blend Global Equity (A) 0,88 41 20,34 39 9,82 47 5,34 31 2 Allan Gray-Orbis Global Equity Feeder (A) 4,20 17 20,91 35 9,52 48 9,71 10 3 Glacier Global Stock Feeder (B3) 7,44 10 9,17 65 9,45 49 Denker SCI Glbl Equity Feeder (A) 0,96 40 8,02 68 8,86 50 5,02 33 2 Element Islamic Global Equity SCI (A) -2,16 70 10,10 63 8,63 51 2,98 38 1 Old Mutual FTSE RAFI All World Index Fdr (A) 4,28 15 7,81 69 8,45 52 6,08 28 Absa Global Value Feeder (R) 10,88 5 -0,73 73 5,16 53 5,19 32 Sanlam Global Emerging Markets Feeder (A1) 2,36 28 14,57 57 3,91 54 Denker SCI Global Dividend Feeder (A1) -1,72 65 -4,40 76 3,80 55 0,50 40 1 Stonewood BCI Global Equity Feeder (A) -2,69 75 -2,68 74 3,41 56 0,62 39 1 Discovery Global Value Equity Feeder (A) 23,90 1 -2,90 75 3,28 57 4,58 35 2 Counterpoint SCI Global Equity Feeder (B) 1,58 32 -5,74 77 2,90 58 -0,56 41 1 PSG Global Equity Feeder (A) 14,11 4 6,52 70 2,32 59 4,08 37 Sygnia FAANG Plus Equity (A) 3,91 19 65,02 5 Anchor BCI Global Technology (A) 3,61 20 53,75 6 Nedgroup Inv. Global Div. Equity Fdr (A) 3,18 24 30,88 7 Nedgroup Inv. Global EM Equity Fdr (A) 8,22 9 30,31 8 Stonehage Fleming SCI Gbl Best Id. Eqty Fdr -4,85 81 28,54 10 BCI Fundsmith Equity Feeder (A) -3,48 76 27,30 14 Mi-Plan IP Global AI Opportunity (B2) -5,84 86 26,11 15 Instit BCI Global Equity (A) -4,99 83 25,52 16 Prescient Sigma Select Gbl Leaders Fdr (A1) 1,97 30 22,89 23 Old Mutual MSCI EM ESG Index Fdr (A) 1,18 36 22,62 25 1nvest MSCI World Index Feeder (A) -0,44 53 21,69 28 CoreShares MSCI ACWI FoF (A) 0,18 46 21,59 29 1nvest MSCI World Index Feeder ETF -0,45 54 21,56 30 Prescient Core Global Equity (A2) -0,88 58 21,33 33 Old Mutual MSCI World ESG Index Feeder (A) -1,61 64 18,62 45 Kagiso Islamic Global Equity Feeder (A) 1,56 33 8,90 66 CoreShares S&P Gbl Div. Aristocrats ETF -2,35 73 8,31 67 Kagiso Global Equity Feeder (A) 9,52 6 6,05 71 Global & Local SNN Offshore Equity (A) -5,82 85 2,05 72 Flagship IP Global Icon Feeder (A) 5,48 12 BCI Credo Global Equity Feeder (A) 4,82 14 Fairtree Global EM Prescient (A1) 4,27 16 Satrix MSCI EM ESG ETF 4,14 18 PPS Global Equity Feeder (A2) 2,86 26 Ashburton Global 1200 Equity FoF ETF 0,12 48 Satrix MSCI World ESG ETF -0,79 57 36One BCI Global Equity Feeder (A) -1,15 61 Investec W&I BCI Global Leaders Equity (A) -1,73 66 Satrix MSCI China Feeder ETF -3,91 77 Benguela Global Equity ACI Feeder (A1) -4,90 82 Sygnia Health Innovation Global Equity (B) -6,92 88 Arithmetic Average 1,32 21,67 14,24 7,69 MSCI World index -0,11 19,76 14,97 8,88 UNCLASSIFIED FUNDS Denker SCI Global Financial Feeder (A1) 15,76 1 -5,53 1 1,69 1 4,63 1 GLOBAL MULTI ASSET FLEXIBLE FUNDS Mi-Plan IP Global Macro (B5) -5,73 35 21,69 5 17,82 1 10,19 2 5 Global IP Opportunity (B5) -5,81 36 20,94 6 17,80 2 9,75 3 5 PSG Wealth Global Flexible Feeder (D) -3,03 20 22,25 4 16,59 3 8,88 4 Northstar SCI Global Flexible Feeder (A) -4,80 30 18,91 8 16,38 4 Northstar SCI Global Flexible (A) -4,73 29 18,06 11 16,23 5 Deton Prime Global Flexible FoF (A) -1,68 11 28,10 2 16,12 6 8,54 5 4 Sygnia International Flexible FoF (A) -2,04 13 19,80 7 14,60 7 8,31 6 4 Skyblue BCI Solar Flexible FoF (A) -1,95 12 29,55 1 14,54 8 7,64 7 4 Assetbase Global Flexible Prescient FoF (A1) -1,58 10 18,08 10 13,69 9 7,27 8 3 Coronation Global EM Flexible [ZAR] (A) 5,88 2 27,29 3 13,11 10 13,08 1 4 Nedgroup Inv. Global Flexible Feeder (R) 2,21 5 14,07 18 12,49 11 6,12 9 3 Marriott International Growth Feeder (A) -6,03 38 11,20 26 12,05 12 5,95 10 BCI UBAM MF Flexible Allocation Feeder (A) -3,58 24 13,74 20 11,80 13 PSG Wealth Global Moderate Feeder (A) -4,05 26 14,74 16 11,32 14 4,32 16 Warwick BCI International FoF (C) -8,26 40 9,77 28 10,22 15 2,15 20 1 Foord International Feeder (A) -4,63 28 11,38 25 10,02 16 3,95 17 Kruger Ci International Flexible Feeder (A) -5,62 33 12,06 24 9,89 17 5,12 12 3 Lynx Prime Global Diversified FoF (A1) -3,19 22 9,16 30 9,50 18 3,50 18 2 Bridge Global Managed Growth Feeder (A) -2,51 16 2,24 34 9,47 19 3,05 19 2 FG IP International Flexible FoF (A) -3,78 25 9,73 29 9,26 20 5,00 13 3 APS Ci Global Flexible Feeder (B) -6,57 39 9,03 31 9,23 21 Select Manager BCI Global Moderate FoF (A) -2,70 17 13,73 21 9,15 22 5,17 11 3 IP Foreign Flexible Feeder (A1) -4,90 31 11,15 27 7,82 23 3,05 19 1 Amity BCI Global Diversified FoF (A) 0,34 7 14,54 17 6,91 24 4,38 15 2 PSG Global Flexible Feeder (A) 10,90 1 12,90 23 5,11 25 4,65 14 Methodical BCI Global Flexible FoF (A) -3,50 23 18,72 9 Celerity Ci International Growth FoF (B) -0,05 8 15,91 12 PMK Global Flexible Prescient FoF (A3) -2,46 15 15,13 13 Chrome Ci Global Maximum Return Fdr (A) -2,42 14 15,08 14 Quantum BCI Worldwide Flexible FoF (A) -2,72 18 14,77 15 Rozendal Global Prescient Feeder (A) 2,50 4 13,93 19 Point3 BCI Global Flexible FoF (A) 1,12 6 13,70 22 Rezco Global Flexible Feeder (A) -11,52 41 5,86 32 Thyme Wealth IP Global (A) -2,99 19 2,80 33 PERSONAL FINANCE | 1 ST QUARTER 2021 65
DATABANK
DATABANK NAME 3 MONTHS 1 YEAR 3 YEARS 5 YEARS PLEX. % RANK % RANK % RANK % RANK NAME 3 MONTHS 1 YEAR 3 YEARS 5 YEARS PLEX. % RANK % RANK % RANK % RANK Counterpoint SCI Global OM Flexible Fdr (B) -0,08 9 -2,45 35 Flagship IP Global Flexible Equity (B) 5,23 3 Wealth Associates BCI Flex. Growth FoF (A) -3,09 21 ClucasGray Global Flexible Prescient (A1) -4,46 27 Vunani BCI Global Macro (A) -5,11 32 Cadiz BCI Global Flexible FoF (A) -5,66 34 Salvo Global Managed Prime Feeder (B) -5,85 37 Arithmetic Average -2,76 14,57 12,00 6,14 MSCI World index -0,11 19,76 14,97 8,88 HIGH EQUITY FUNDS Stanlib Global Balanced Feeder (A) -4,85 15 18,68 2 14,64 1 7,22 3 4 Nedgroup Inv. Core Global Feeder (A) -3,12 8 16,59 3 13,66 2 PPS Global Balanced FoF (A2) -1,95 6 15,89 4 13,57 3 7,46 2 AF Inv. Strategic Global Balanced Feeder (A) -2,50 7 15,02 6 12,85 4 7,50 1 4 Ninety One Global Strategic Managed Fdr (A) -1,57 5 20,03 1 12,45 5 6,61 5 Coronation Global Managed [ZAR] Feeder (A) -1,41 4 14,83 7 11,70 6 6,65 4 3 Momentum International Balanced Feeder (A) -3,31 11 13,70 9 11,02 7 5,79 6 3 Sanlam Global Balanced FoF (A) -4,01 12 11,81 11 10,44 8 4,66 8 3 Prime Renaissance Global Best Ideas Fdr (A) -3,29 9 11,75 12 9,85 9 3,32 9 2 Ashburton Global Flexible (A1) -3,30 10 12,69 10 9,84 10 3,24 10 Sharenet BCI Global Balanced FoF (C) -4,10 13 9,14 14 9,31 11 Allan Gray-Orbis Global FoF (A) 1,71 1 13,93 8 6,30 12 5,48 7 3 Discovery Global Multi-Asset (A) -4,14 14 0,59 15 1,78 13 0,21 11 1 Seed Global Prescient Feeder (A1) -5,12 16 15,62 5 Prudential Global Balanced Feeder (A) -1,06 3 10,45 13 Prescient Global Balanced Feeder (A2) 0,03 2 Arithmetic Average -2,50 13,53 10,62 5,27 MSCI World index -0,11 19,76 14,97 8,88 INCOME FUNDS Coronation Gbl Strat. USD Inc. [ZAR] Fdr (A) -10,39 3 6,49 3 8,01 1 0,69 2 Prescient Global Income Provider Feeder (A1) -8,17 2 9,14 2 7,06 2 1,34 1 BCI Fairtree Global Income Plus Feeder (A) -2,44 1 13,42 1 Arithmetic Average -6,67 9,33 7,50 1,00 LOW EQUITY FUNDS Stanlib Global Balanced Cautious Feeder (A) -7,25 9 15,42 1 11,92 1 4,01 2 5 Absa Global Multi Asset Feeder (A) -6,54 5 9,52 7 11,49 2 PSG Wealth Global Preserver Feeder (D) -6,92 8 9,83 5 9,98 3 Sanlam Global Cautious FoF (A) -6,82 6 11,99 3 9,92 4 3,14 5 3 Prudential Global Inflation Plus Feeder (A) -4,00 1 11,36 4 9,88 5 4,13 1 4 Ninety One Global M-A Income Feeder (A) -8,08 10 9,60 6 9,75 6 Coronation Global Capital Plus [ZAR] Fdr (A) -6,83 7 8,19 8 9,75 6 3,44 4 3 Momentum International Conservative Fdr (A) -6,12 4 12,97 2 9,38 7 3,49 3 3 Nedgroup Inv. Global Cautious Feeder (A) -9,08 11 7,31 9 7,85 8 1,71 6 2 Oasis Crescent Int. Balanced Low Eqty Fdr (D) -5,87 3 5,87 10 7,01 9 Allan Gray-Orbis Global Optimal FoF (A) -4,55 2 2,21 11 -0,97 10 -1,89 7 1 Arithmetic Average -6,64 9,45 8,73 2,43 Morgan Stanley Capital Value index 1,26 1,25 5,60 3,19 GLOBAL INTEREST BEARING SHORT TERM FUNDS Marriott Global Income (A) -10,78 3 5,57 3 7,40 1 0,59 2 Old Mutual Global Currency Feeder (A) -9,92 2 8,85 1 6,43 2 0,92 1 Momentum International Income (A) -9,30 1 8,63 2 6,05 3 -1,47 3 Arithmetic Average -10,00 8,00 6,33 0,33 VARIABLE TERM FUNDS Stanlib Global Bond Feeder (A) -3,59 1 18,73 1 11,51 1 4,03 1 Prudential Global Bond Feeder (A) -7,32 2 14,20 5 10,36 2 3,49 2 Alexander Forbes Inv. Gbl Fixed Inc. Fdr (A) -8,99 3 15,15 2 10,02 3 2,77 3 Stylo Global Bond Prescient FoF (A1) -9,29 4 13,16 7 9,64 4 Ashburton World Government Bond ETF -9,52 5 14,71 3 1nvest Global Govt Bond Index Fdr ETF -10,32 8 14,50 4 1nvest Global Govt Bond Index Fdr (A) -10,39 9 14,02 6 PortfolioMetrix BCI Global Bond FoF (A) -9,76 6 Satrix Global Aggregate Bond Feeder ETF -10,15 7 Arithmetic Average -8,78 14,86 10,50 3,33 GLOBAL REAL ESTATE GENERAL FUNDS Reitway BCI Global Property Feeder (A) -5,20 12 17,44 1 13,13 1 5,80 1 5 Absa Global Property Feeder (A) -5,48 15 6,80 2 12,24 2 Sesfikile BCI Global Property (A1) -4,60 10 3,37 3 10,60 3 Portfoliometrix BCI Global Property FoF (A) -5,35 13 1,20 4 9,78 4 Catalyst SCI Global Real Estate Feeder (B) -5,64 16 -0,57 6 9,29 5 2,62 2 4 Nedgroup Inv. Global Property Feeder (A) -6,94 19 1,13 5 9,05 6 Fairtree Global Real Estate Prescient (A1) -5,37 14 -5,85 13 7,82 7 Meago Enhanced Global Prop. Prescient (A1) -1,88 6 -4,21 11 6,94 8 Sygnia Itrix Global Property ETF -5,66 17 -2,24 7 6,67 9 CoreShares S&P Global Property ETF -5,71 18 -2,97 8 6,57 10 Stylo Global Real Estate Prescient FoF (A1) -2,73 7 -3,48 10 6,53 11 Marriott International Real Estate Feeder (A) -1,63 5 -6,18 15 6,14 12 2,26 3 4 Discovery Global Real Estate Sec. Fdr (A) -4,71 11 -6,98 17 5,73 13 -0,15 6 3 Stanlib Global Property Feeder (A) -8,22 20 -5,96 14 5,21 14 -1,03 7 2 Mi-Plan IP Global Property Feeder (B5) -3,22 8 -2,98 9 4,69 15 0,05 5 3 BCI Best Blend Global Property (A) -4,50 9 -7,38 19 4,56 16 1,31 4 3 Oasis Crescent Int. Property Equity Feeder (D) -1,02 4 -5,47 12 1,53 17 -2,10 8 1 Bridge Global Property Income Feeder (A) 3,11 1 -17,44 20 0,06 18 -3,46 9 2 1nvest Global Reit Index Feeder ETF -0,18 2 -6,83 16 1nvest Global Reit Index Feeder (A) -0,32 3 -7,03 18 Arithmetic Average -3,80 -2,75 7,17 0,67 REGIONAL EQUITY GENERAL FUNDS Sygnia Itrix MSCI US Index ETF -0,66 8 26,29 4 20,71 1 13,41 1 Sygnia Itrix S&P 500 ETF -1,42 10 23,75 5 20,26 2 Sygnia Itrix MSCI Japan ETF 1,22 5 19,79 8 11,91 3 6,72 3 Stanlib European Equity Feeder (A) 0,50 7 17,93 9 11,21 4 5,06 6 Sygnia Itrix Eurostoxx50 ETF 2,08 4 10,22 12 9,47 5 5,56 4 Sanlam India Opportunities Feeder (A) 8,43 1 15,76 10 9,04 6 7,18 2 Sanlam Pan Europe (A) 0,88 6 9,40 13 8,20 7 2,60 7 Sanlam Asia Pacific FoF (A) 2,65 3 14,00 11 6,93 8 5,27 5 Absa Africa Equity Feeder (A) -5,65 16 -0,06 15 5,46 9 0,56 9 Mazi AM Prime Africa Equity (A) -3,36 15 -5,21 18 4,58 10 Sygnia Itrix FTSE100 ETF 2,86 2 -4,87 17 3,47 11 1,15 8 Rudiarius BCI Africa Equity (C) -8,40 17 -4,06 16 1,26 12 -1,11 10 Cloud Atlas AMI Big50 ex-SA ETF -23,18 19 -30,24 19 -13,26 13 Satrix Nasdaq 100 ETF -0,98 9 56,09 1 1nvest S&P 500 Info Tech Index Feeder ETF -2,40 11 49,89 2 1nvest S&P 500 Info Tech Index Feeder (A) -2,47 12 48,31 3 1nvest S&P 500 Index Feeder ETF -2,70 13 23,04 6 1nvest S&P 500 Index Feeder (A) -2,73 14 22,33 7 Ashburton India Equity Opp. Fdr (A) -10,30 18 1,83 14 Arithmetic Average -2,32 15,47 7,54 4,70 REGIONAL MULTI ASSET FLEXIBLE FUNDS Prescient China Balanced Feeder (A1) 1,38 2 35,98 1 14,55 1 6,18 1 Anchor BCI Africa Flexible Income (A) 4,00 1 9,76 3 10,52 2 Laurium Africa USD Bond Prescient (A1) -0,73 3 14,45 2 Arithmetic Average 1,33 20,00 13,00 6,00 REGIONAL INTEREST BEARING SHORT TERM FUNDS Stanlib USD Currency FoF (A) -11,57 1 5,80 1 7,32 1 -1,08 2 Alexander Forbes Inv. US Dollar Feeder (A) -12,15 2 4,93 2 7,19 2 -0,26 1 Arithmetic Average -12,00 5,50 7,00 -0,50 REGIONAL REAL ESTATE GENERAL FUNDS Cloud Atlas AMI Real Estate ex-SA ETF 0,74 1 -14,21 1 66 PERSONAL FINANCE | 1 ST QUARTER 2021
TAXES AND DEDUCTIONS FOR THE 2020/21 TAX YEAR
INCOME TAX RATES FOR INDIVIDUALS AND SPECIAL TRUSTS*
benefit of disabled people and testamentary trusts
for the benefit of minor children. All other trusts pay income tax at a flat rate of
PROVISIONAL TAX
A provisional taxpayer is any person who earns income by way of remuneration from an unregistered employer income that is not remuneration or an allowance or an advance payable by his or her employer. You are exempt from the payment of provisional tax if you do not carry on any business and your taxable income:
• Will not exceed the tax threshold for the tax year; or
• From interest, dividends, foreign dividends and the rental of fixed property and remuneration from an unregistered employer will be R30 000 or less for the tax year.
Deceased estates are not provisional taxpayers.
CAPITAL GAINS TAX
INCLUSION RATES
DEDUCTIONS FOR RETIREMENT FUND CONTRIBUTIONS
Amounts contributed to pension, provident and retirement annuity (RA) funds are deductible by fund members. Amounts contributed by employers and taxed as fringe benefits are treated as contributions by the individual employee. The deduction is limited to 27.5% of the greater of remuneration for PAYE purposes or taxable income (both excluding retirement fund lump sums and severance benefits). The deduction is further limited to the lower of R350 000 or 27.5% of taxable income before the inclusion of a taxable capital gain. Any contributions that exceed the limits are carried forward to the next tax year and deemed to be contributed in that year. The amounts carried forward are reduced by contributions set off when determining taxable retirement fund lump sums or RAs.
DEDUCTIONS FOR MEDICAL AND DISABILITY EXPENSES
All taxpayers: If you contribute to a medical scheme, you are entitled to a tax rebate (referred to as a medical scheme contributions tax credit) of up to R319 each for the individual who paid the contributions and the first dependant on the medical scheme and up to R215 a month for each additional dependant.
Additional tax credit for taxpayers under 65 years: You are entitled to a tax credit of 25% of an amount equal to your qualifying medical expenses plus an amount by which your medical scheme contributions exceed four times the medical scheme contribution tax credit for the tax year, limited to the amount that exceeds 7.5% of taxable income (excluding severance or retirement fund lump sums).
Additional tax credit for taxpayers with a disability and/or with a disabled family member or taxpayers over 65 years: You are entitled to a tax credit of 33.3% of your qualifying medical expenses plus 33.3% of the amount by which your medical scheme contributions exceed three times the medical scheme contribution tax credit for the tax year.
TAX ON LOCAL AND FOREIGN DIVIDENDS
Dividends received by individuals from South African companies are generally exempt from income tax, but dividends tax at a rate of 20% is withheld by the entities paying the dividends to individuals. Dividends received by resident individuals from real estate investment trusts (Reits) are subject to income tax. Non-residents in receipt of those dividends are subject only to dividends tax. Most foreign dividends received by individuals from foreign companies (a shareholding of less than 10% in the foreign company) are taxable at a maximum effective rate of 20%.
CALCULATE REAL AFTER-TAX RETURNS ON INTEREST-BEARING INVESTMENTS
CPI INFLATION RATE: 3.1% IN DECEMBER 2020
The real rate of return on money you invest is affected not only by inflation, but also by the rate at which you are taxed. The lower the inflation rate, the better your real rate of interest is likely to be. To calculate your real return, first work out what your after-tax return will be and then subtract the inflation rate. The table provides the marginal tax brackets and the interest rates at which you will start to receive a real (after-tax) rate of return on your money if it is taxed at that rate. The calculations ignore the fact that in the 2020/21 tax year, the first R23 800 (R34 500 if you are over 65 years of age) you earn in interest is tax-free. Any interest you receive above the exempt amount is taxed at your marginal tax rate.
• Individuals special trusts and individual policyholder funds: 40% • Other taxpayers: 80%
MAXIMUM EFFECTIVE RATES
• Individuals and special trusts: 18%
• Other trusts: 36% • Companies: 22.4%
SOME OF THE EXCLUSIONS
• R2 million gain/loss on disposal of primary residence
• Annual exclusion of R40 000 to individuals and special trusts
• R300 000 in the year of death (instead of the annual exclusion)
• Retirement benefits
• Most personal use assets
• Payments in respect of original long-term insurance policies
• R1.8 million for individuals (at least 55 years of age) when a small business with a market value that does not exceed R10 million is disposed of.
ESTATE DUTY
Rate: 20% on the first R30m; 25% on estates above R30m. Amounts in an estate up to R3.5m are not taxed. For the second-dying spouse, amounts up to R7m less the exemption used by the first-dying spouse are not taxed.
TAX-FREE SAVINGS ACCOUNTS
No income tax on interest, dividends withholding tax or capital gains tax. Contributions are limited to R33 000 a year, up to R500 000 over your lifetime. Contributions that exceed the limits will be taxed at 40%.
DONATIONS TAX
• Donations tax payable by the donor is levied at a rate of 20% on property donated with a value up to R30 million. The rate on property with a value of more than R30 million is 25%.
• The first R100 000 of property donated in each year to a natural person is exempt from donations tax.
• Donations between spouses are exempt from donations tax.
• Tax deductions on donations to approved public benefit organisations are limited to 10% of taxable income before deducting medical expenses (excluding retirement fund lump sums and severance benefits).
DATABANK
EXEMPTIONS ON LOCAL INTEREST Individuals under 65 R23 800 a year Individuals 65 and over R34 500 a year R1 - R205 900 18% of taxable income R205 901 - R321 600 R37 062 + 26% of taxable income above R205 900 R321 601 - R445 100 R67 144 + 31% of taxable income above R321 600 R445 101 - R584 200 R105 429 + 36% of taxable income above R445 100 R584 201 - R744 800 R155 505 + 39% of taxable income above R584 200 R744 801 - R1 577 300 R218 139 + 41% of taxable income above R744 800 R1 577 301 and above R559 464 + 45% of taxable income above R1 577 300 * Trusts established
the
for
established
45%.
TAXABLE INCOME RATE OF TAX TAX THRESHOLDS REBATES Primary (applies to all taxpayers) R14 958 Secondary (persons 65 and older) R8 199 Tertiary (persons 75 and older) R2 736 Below age 65 R83 100 Age 65 to below age 75 R128 650 Age 75 and over R143 850
MARGINAL TAX BRACKET MARGINAL TAX RATE BREAKTHROUGH POINT R0 to R205 900 18% 3.8 R205 901 to R321 600 26% 4.2 R321 601 to R445 100 31% 4.5 R445 101 to R584 200 36% 4.8 R584 201 to R744 800 39% 5.1 R744 801 to R1 577 300 41% 5.3 R1 577 301 and above 45% 5.6
PERSONAL FINANCE | 1 ST QUARTER 2021 67
RETIREMENT FUND LUMP-SUM WITHDRAWAL BENEFITS
LUMP SUM RATE OF TAX
R0 to R25 000 0% of taxable income
R25 001 to R660 000 18% of taxable income above R25 000
R660 001 to R990 000 R114 300 plus 27% of taxable income above R660 000 R990 001 and above R203 400 plus 36% of taxable income above R990 000
Retirement fund lump-sum withdrawal benefits consist of lump sums from a pension, pension preservation provident, provident preservation or retirement annuity fund on withdrawal (including assignment in terms of a divorce order).
The tax on a retirement fund lump-sum withdrawal benefit (X) is equal to:
• The tax determined by applying the tax table to the aggregate of lump sum X plus all other retirement fund lump-sum withdrawal benefits accruing from March 2009, all retirement fund lump-sum benefits accruing from October 2007 and all severance benefits accruing from March 2011; less
• The tax determined by applying the tax table to the aggregate of all retirement fund lump-sum withdrawal benefits accruing before lump-sum X from March 2009, all retirement fund lump-sum benefits accruing from October 2007 and all severance benefits accruing from March 2011.
RETIREMENT FUND LUMP-SUM BENEFITS OR SEVERANCE BENEFITS
LUMP SUM RATE
R0 to R500 000
TRAVELLING ALLOWANCES
Rates per kilometre, which may be used in determining the allowable deduction for business travel against an allowance or advance where actual costs are not claimed, are determined by using the following table:
Note:
• 80% of the travelling allowance must be included in the employee’s remuneration for the purposes of calculating PAYE. The percentage is reduced to 20% if the employer is satisfied that at least 80% of the use of the motor vehicle for the tax year will be for business purposes.
R500 001 to R700 000
of taxable income above R500 000 R700 001 to R1 050 000 R36 000 plus 27% of taxable income above R700 000 R1 050 001 plus R130 500 plus 36% of taxable income above R1 050 000
Retirement fund lump-sum benefits consist of lump sums from a pension, pension preservation, provident, provident preservation or retirement annuity fund on death retirement or termination of employment due to attaining the age of 55 sickness accident injury incapacity redundancy or termination of the employer’s trade.
Severance benefits consist of lump sums from or by arrangement with an employer due to relinquishment, termination, loss, repudiation, cancellation or variation of a person’s office or employment.
Tax on a retirement fund lump-sum benefit or a severance benefit (Y) is equal to:
• The tax determined by applying the tax table to the aggregate of lump-sum or severance benefit Y plus all other retirement fund lump-sum benefits accruing from October 2007 and all retirement fund lump-sum withdrawal benefits accruing from March 2009 and all other severance benefits accruing from March 2011; less
• The tax determined by applying the tax table to the aggregate of all retirement fund lumpsum benefits accruing before lump-sum Y from October 2007 and all retirement fund lump-sum withdrawal benefits accruing from March 2009 and all severance benefits accruing before severance benefit Y from March 2011.
DUTY RATES
SARS INTEREST RATES
RATES OF INTEREST FROM 1 FEBRUARY 2020:
Fringe benefits - interest-free or low-interest loan (official rate): 7.25% a year
RATES OF INTEREST FROM 1 NOVEMBER 2019:
Late or underpayment of tax: 10% a year
Refund of overpayment of provisional tax: 6% a year
Refund of tax on successful appeal or where the appeal was conceded by the South African Revenue Service: 10% a year
Refund of VAT or late payment of VAT: 10%
WHO DOES NOT HAVE TO SUBMIT A TAX RETURN?
You do not have to submit a return if: your total pre-tax earnings from one employer were less than R500 000 for the tax year, you have no other sources of income (for example rental or interest) and there are no deductions that you want to claim.
• No fuel cost may be claimed if the employee has not borne the full cost of fuel used in the vehicle and no maintenance cost may be claimed if the employee has not borne the full cost of maintaining the vehicle (for example the vehicle is covered by a maintenance plan).
• The fixed cost must be reduced on a pro-rata basis if the vehicle is used for business purposes for less than a full year.
• The actual distance travelled during a tax year and the distance travelled for business purposes substantiated by a logbook are used to determine the costs that may be claimed against a travelling allowance.
Alternative simplified method:
Where an allowance or advance is based on the actual distance travelled by the employee for business purposes no tax is payable on an allowance by an employer to an employee up to the rate of 398 cents per kilometre regardless of the value of the vehicle. However, this alternative is not available if other compensation in the form of an allowance or reimbursement (other than for parking or toll fees) is received from the employer in respect of the vehicle.
FRINGE BENEFITS: EMPLOYER-OWNED VEHICLES
• The taxable value is 3.5% of the determined value (the cash value including VAT) a month of each vehicle. Where the vehicle is:
– The subject of a maintenance plan when the employer acquired the vehicle, the taxable value is 3.25% of the determined value; or
– Acquired by the employer under an operating lease, the taxable value is the cost incurred by the employer under the operating lease plus the cost of fuel.
• 80% of the fringe benefit must be included in the employee’s remuneration for the purpose of calculating PAYE. The percentage is reduced to 20% if the employer is satisfied that at least 80% of the use of the vehicle for the tax year is for business purposes.
• On assessment the fringe benefit for the tax year is reduced by the ratio of the distance travelled for business purposes (substantiated by a logbook) divided by the actual distance travelled during the tax year.
• On assessment further relief is available for the cost of the licence, insurance, maintenance and fuel for private travel if the employee has borne the full cost thereof and if the distance travelled for private purposes is substantiated by a logbook.
SUBSISTENCE ALLOWANCES AND ADVANCES
If you are obliged to spend at least one night away from your usual place of residence on business and you receive an allowance or advance for accommodation in South Africa, which is to pay for:
• Meals and incidental costs: R452 a day is deemed to have been spent; or
• Incidental costs only: R139for each day is deemed to have been spent.
Where the allowance or advance is for accommodation outside South Africa, a specific amount per country is deemed to have been spent. Refer to www.sars.gov.za > Legal counsel > Secondary legislation > Income tax notices > 2018.
TURNOVER TAX FOR MICRO BUSINESSES
Financial years that end on any date between March 1 2019 and February 28 2020.
DATABANK Information on pages 70 and 71 taken from the South African Revenue Service’s Tax Guide.
VALUE OF THE VEHICLE FIXED COST FUEL COST MAINTENANCE (INCLUDING VAT) PER YEAR PER KM COST PER KM Up to R95 000 R31 332 105.8c 37.4c R95 001 to R190 000 R55 894 118.1c 46.8c R190 001 to R285 000 R80 539 128.3c 51.6c R285 001 to R380 000 R102 211 138.0c 56.4c R380 001 to R475 000 R123 955 147.7c 66.2c R475 001 to R570 000 R146 753 169.4c 77.8c R570 001 to R665 000 R169 552 175.1c 96.6c Exceeding R665 000 R169 552 175.1c 96.6c
The information on these pages is from the South African Revenue Service’s (SARS) 2020 Budget Tax Guide.
TRANSFER
R1 - R1 000 000 0% R1 000 001 - R1 375 000 3% of the value above R1 000 000 R1 375 001 - R1 925 000 R11 250 + 6% of the value above R 1 375 000 R1 925 001 - R2 475 000 R44 250 + 8% of the value above R 1 925 000 R2 475 001 - R11 000 000 R88 250 +11% of the value above R2 475 000 R11 000 001 and above R1 026 000 + 13% of the value above R11 000 000 Transfer duty is payable on transactions that are not subject to VAT. VALUE OF PROPERTY RATE
Up to R335 000 0% of turnover R335 001 to R500 000 1% of taxable turnover above R335 000 R500 001 to R750 000 R1 650 plus 2% of taxable turnover above R500 000 R750 001 and above R6 650 plus 3% of taxable turnover above R750 000
TURNOVER RATE
TAX
TAXABLE
OF
OF TAX
0%
of taxable income
18%
68 PERSONAL FINANCE | 1 ST QUARTER 2021
ANNUITY RATES
Rates valid for February 1, 2021. Information supplied by the relevant life assurance companies.
COMPULSORY ANNUITIES
ABOUT THE TABLES
These tables show initial monthly pensions guaranteed for 10 years and then for life if, at the ages listed, you buy a life annuity (see definition below) with R1 million. In these tables. the amount escalates at a rate of 6 percent a year.
WHAT IS AN ANNUITY?
An annuity is a payment you receive annually. The life assurance industry has adapted the word to mean any amount you receive regularly (normally monthly) from an investment, usually in the form of a pension, when you retire.
COMPULSORY PURCHASE ANNUITY
VOLUNTARY ANNUITIES
COMPULSORY JOINT LIFE AND SURVIVORSHIP ANNUITIES
This must be bought with at least two-thirds of the benefits you receive from your pension fund or retirement annuity when you retire (provident funds are excluded from this requirement). If you are a member of a defined-benefit pension fund, the annuity is normally provided to you without any choice.
VOLUNTARY ANNUITY
This is an investment you choose to make with a lump sum from any source. With voluntary annuities, you can invest for a fixed period. For example, for 10 years – or for life. Note that compulsory and voluntary annuities are taxed differently, both on the investment itself and on your income from it. This is because you buy a compulsory annuity with pre-tax savings whereas you buy a voluntary annuity with after-tax savings.
TRADITIONAL (LIFE) ANNUITY
VOLUNTARY JOINT LIFE AND SURVIVORSHIP ANNUITIES
You buy this type of annuity from a life assurance company. You are guaranteed a fixed income for life, which may or may not escalate annually at a certain rate, depending on whether you have a level or escalating annuity. In the initial years, you will receive less from an escalating annuity than from a level annuity but the level annuity will be eroded over the years by inflation. Because the life assurance company takes on your longevity risk, your investment normally dies with you. You can, however, buy an annuity “guaranteed for X years and then for life”, which means your nominated heir will receive the income if you die before the X years are up. After X years, the annuity dies with you. Joint life annuities are based on a pension being paid to the surviving spouse after the death of his or her partner.
LIVING (INVESTMENT-LINKED) ANNUITY
You buy this type of annuity from an asset manager and can choose the underlying Inv. You must decide each year how much of your investment you want to draw down as a pension with a minimum of 2.5 percent and a maximum of 17.5 percent. When you die, what is left of your investment is passed on to your heirs. However, you take the risk of outliving your capital.
OFFSHORE ALLOWANCES
HOW MUCH YOU CAN TAKE OUT OF SOUTH AFRICA
Offshore investment allowance: R10 million each year
Discretionary allowance for adults: R1 million each year
Travel allowance for children under 18: R200 000 each year
The tax on international air travel is R190 per passenger or R100 for flights to Southern African Customs Union countries.
COMPANY MONTHLY ANNUITY RATE Age 55 Age 60 Age 65 Age 70 MALE Liberty R4.492.54 R4.871.85 R5.460.45 R6.276.83 Metropolitan R5.064.74 R5.399.04 R5.812.35 R6.344.86 Momentum R4.637.08 R5.215.67 R5.938.21 R6.735.04 Old Mutual R5.184.60 R5.540.09 R6.005.46 R6.569.80 Sanlam R4.644.37 R5.040.23 R5.542.05 R6.146.84 FEMALE Liberty R4.069.49 R4.407.27 R4.908.87 R5.650.19 Metropolitan R4.378.02 R4.697.32 R5.121.18 R5.658.01 Momentum R4.221.54 R4.716.34 R5.340.33 R6.130.17 Old Mutual R4.727.86 R5.048.68 R5.465.92 R5.994.84 Sanlam R4.107.56 R4.391.46 R4.786.32 R5.295.14
COMPANY MONTHLY ANNUITY RATE Age 55 Age 60 Age 65 Age 70 MALE Liberty R4,492.54 R4,871.85 R5,460.45 R6,276.83 Metropolitan R5,064.74 R5,399.04 R5,812.35 R6,344.86 Momentum R4,534.25 R5,086.35 R5,777.79 R6,608.52 Old Mutual R5,184.60 R5,540.09 R6,005.46 R6,569.80 Sanlam R4,644.37 R5,040.23 R5,542.05 R6,146.84 FEMALE Liberty R4.069.49 R4.407.27 R4.908.87 R5.650.19 Metropolitan R4.378.02 R4.697.32 R5.121.18 R5.658.01 Momentum R4.136.32 R4.607.22 R5.200.49 R5.957.67 Old Mutual R4.727.86 R5.048.68 R5.465.92 R5.994.84 Sanlam R4.107.56 R4.391.46 R4.786.32 R5.295.14
COMPANY MONTHLY ANNUITY RATE Age 55 Age 60 Age 65 Age 70 MALE & FEMALE Liberty Metropolitan R4.067.13 R4.313.84 R4.649.03 R5.128.40 Momentum R3.858.04 R4.277.03 R4.814.00 R5.528.26 Old Mutual R4.363.94 R4.629.63 R4.987.99 R5.464.75 Sanlam R3.798.66 R4.098.56 R4.501.42 R5.054.23
COMPANY MONTHLY ANNUITY RATE Age 55 Age 60 Age 65 Age 70 MALE & FEMALE Liberty Metropolitan R4.067.13 R4.313.84 R4.649.03 R5.128.40 Momentum R3.786.97 R4.185.39 R4.692.95 R5.370.79 Old Mutual R4.363.94 R4.629.63 R4.987.99 R5.464.75 Sanlam R3.798.66 R4.098.56 R4.501.42 R5.054.23
DATABANK 69 PERSONAL FINANCE | 1 ST QUARTER 2021