
Figure 1: Sequential Steps of KDD Process IJTSRD50568
I. INTRODUCTION Data Mining is the process of exploring the patterns with the help of various techniques in the data gathered from the various sources [1]. Data Mining also involves selection of the relevant data from the database, preprocessing of the relevant data, transformation in the suitable form, data mining and evaluation of the data and afterwards online updating and visualization [1]. It is the analysis step of the “KnowledgeDiscovery” process. The actual task of the Data Mining is semi-self-regulating or selfregulating investigation of the large batches of the dataset for extracting the previously unknown, unusual records and dependencies [1]. Knowledge Discovery process includes various selection steps which helps in the efficient extraction of the useful datafrom thelargedatasets.Thesestepsaresequential steps and they are repeated in iterative sequential manner until the useful information is not extracted. Data Mining is one of the essential steps in the KDD process [2].
Comparative analysis of different Classification Algorithms have been done using various criteria’s like accuracy, execution time (in seconds) and how much instances are correctly classified or not classified correctly.
"Comparative Analysis of Classification Algorithms using Weka" Published in International Journal of Trend in Scientific Research and Issue-5,6470,(ijtsrd),DevelopmentISSN:2456-Volume-6|August2022, pp.858-869,
Data Mining is the process of drawing out the useful information from the raw data that is present in various forms. Data Mining is defined as study of the Knowledge Discovery in database process or KDD. Data mining techniques are relevant for drawingouttheuseful information from the huge amount of raw data that is present in various forms. In this research work different types of classification algorithms accuracies are calculated which are widely used to draw the significant amount of data from the huge amount of raw data.
International Journal of Trend in Scientific Research and Development (IJTSRD) Volume 6 Issue 5, July-August 2022 Available Online: www.ijtsrd.com e-ISSN: 2456 – 6470 @ IJTSRD | Unique Paper ID – IJTSRD50568 | Volume – 6 | Issue – 5 | July-August 2022 Page 858
Step 1: Selection Step: In the first step suitable data for the investigation task is fetched from the database [3]. On the basis of the extraction of suitable data objective dataset is formed [2].
AttributiontermsdistributedOpenJournal.ScientificInternationalCopyrightwww.ijtsrd.com/papers/ijtsrd50568.pdfURL:©2022byauthor(s)andJournalofTrendinResearchandDevelopmentThisisanAccessarticleundertheoftheCreativeCommonsLicense(CCBY4.0) (http://creativecommons.org/licenses/by/4.0)
KEYWORDS: Data Mining, J48, Random Tree, Naïve Bayes, MultilayerPerceptron,WEKA
Comparative Analysis of Classification Algorithms using WEKA Sakshi Goel1, Neeraj Kumar2, Saharsh Gera3
ABSTRACT
1M Tech Scholar, CSE, MERI College of Engineering & Technology, Sampla, Haryana, India 2,3Assistant Professor, CSE, MERI College of Engineering and Technology, Sampla, Haryana, India
How to cite this paper: Sakshi Goel | Neeraj Kumar | Saharsh Gera
Step 2: Pre-Processing Step: In the second step the data which is collected in the selection step is highly concerned with problemslikevagueness,missingand irrelevant data due to magnificent size and complexity. The above concerned problems are molded into a form which is suitable for the data mining techniques with the help of the different tools used for the data mining [2].


R. Sharma et al, 2015, worked with various data mining algorithms to comparatively analyze those using criteria’s like definitiveness, execution time, different datasets and their applications. The algorithms which havebeen compared in theresearch are M5P algorithm, K Star algorithm, M5 Rule algorithm, Multilayer Perceptron algorithm. For the large dataset K-star comes out with the highest definitiveness. [7].
S. Vijayarani, M. Muthulakshmi, 2013, worked on the performance analysis of the bayesian and lazy algorithms. Various performance factors like ROC area, Kappa Statistics, TP Rate etc are used for the analysis. From the comparison it can be concluded that Lazy classifiers is efficient than the Bayesian classifiers [12].
Step 5: Interpretation/ Evaluation Step: Inthisstep data patterns are identified on the basis of the some measures. To figure out and interpret the mining results correctly users need visualization approach to work with[2].
Step 3: Transformation Step: In the third step data is molded into the form which is suitable for the classification by performing different operations like WEKAandaccumulation,induction,normalization,discretizationconstructionoperationsforthefeatures[2][3].toolisusedfortheresearchwork.
S. Carl et al, 2016, worked on the comparative analysis of dataminingalgorithms which arek-means algorithmmeansperformedalgorithm,algorithms,knearestneighboralgorithm,decisiontreenaïvebayesalgorithm.FromtheresearchbytheauthorstheyhavefoundthatkalgorithmhavelesserrorrateandistheeasierascomparedtotheKNNandBayesian[11].
C. Anuradha, T. Velmurugan, 2015, this paper comes up with the prediction of the future outcomeof the final year results of UG student’s dataset. Cross fold validation and percentagesplit arethetwotesting beds used in the classification. According to the research Naïve Bayes and Bayes Net performs well for the data set taken and K-NN, OneR performs poorly [5].
International Journal of Trend in Scientific Research and Development @ www.ijtsrd.com eISSN: 2456-6470 @ IJTSRD | Unique Paper ID – IJTSRD50568 | Volume – 6 | Issue – 5 | July-August 2022 Page 859
S. Khare, S. Kashyap, 2015, provided analysis of the different classification algorithms which includes decision tree, bayesian network, k-nearest neighbor classifiers and artificial neural networks. A brief description of data mining and classification is given in the paper. Voting Dataset is used for analysis. Accordingto the researchworkdecisiontreeaccuracy is better than the other algorithms [9]. Md. N. Amin, Md. A. Habib, 2015, worked on the comparative analysis of J48 decision tree, multilayer perception, and naïvebayes. According to the authors theresearch work showsthebestalgorithmisJ48with an accuracy of 97.61%, and the algorithm which is having lowest error rate with 27.91% is NaïveBayes [10].
Step 4: Data Mining: In the fourth step the Data Mining techniques (algorithms) are used for drawing out figures. DataMiningis usedto analyzethedataset [2] [3]. In this work Data Mining Classification algorithms like J48, Random Tree, Naïve Bayes, and Multilayer Perceptron are used for the investigation using WEKA Machine Learning Tool.
S. Nikam, 2015, worked on the comparative analysis of classification algorithm like C4.5, ID3, k- nearest neighbor, Naïve Bayes, SVM and ANN. Each algorithm hasits limitations and featuresandbasedon theconditions wecan choosethe best suitedalgorithm for our dataset [13].
G.Rajetal,2018, has shown comparativeanalysisof the classification algorithms using WEKA on hematological data of diabetic patients. The algorithms which have been studied are J48 decision tree, Zero R, Naïve Bayes. From this comparison it can be concluded that Naïve Bayes is the best algorithm on diabetic data with 76.3021% accuracy.
N. Orsu et al, 2013, stated about the different classification algorithms and their comparisons on micro-array of data that helps in predicting the occurrence of the tumor. Authors have compared 14 different classification algorithms on the basis of the accuracy. According to the research work all classifiers comes out with the significant performances in terms of accuracies [8].
II. RELATED WORK K. Ahmed, T. Jesmin, 2014, this paper proposes to analyze accuracy of the data mining algorithms using three testing beds which are Percentage Split method, Training Data Set method and Cross Validation method. The classification is performed on type-2 Diabetes disease dataset. According to this research paper the top 5 algorithms for classifying diabetes patients are Bagging (accuracy 85%), Logistic and Multiclass Classifier(accuracy 81.82%) [4].
S. Gupta, N. Verma, 2014, proposes to analyze the classification algorithms on the basis of the Mean Absolute Error, Root Mean Squared Error and the Confusion Matrix. The performance evaluation is being done on the Naïve Bayes classifier and according to the research the Mean Absolute Error and the Root Mean Squared Error is less in case of the training data set. According to the evaluated results Naïve Bayes comes outto be the best suited algorithm [6].
III. RESEARCH METHODOLOGY
E. Sondakh, R. Pungus, 2017, worked on the [25].Decisiondifferencealgorithmstocomparativeanalysisofthreeclassificationalgorithmscomposethebestsuitedalgorithmformodel.ThreeresultingmodelsshowsnosignificantbetweenperformanceofNaïveBayesandTreewhileSVMshowslowestperformance
S. Chiranjibi, 2015, worked on the comparative analysis of Naïve Bayes, Bayes Network, Logistics, Decision tree, Multilayer Perception, REPTree, ZeroR, AdaBoost. Fromthework it can beconcluded that logisticalgorithmis best whichworkswellforthe higher no of attributes and higher noofinstances[17].
K. Danjuma, A. Osofisan, 2014, stated about various classification algorithms and they have been comparatively analyzed using cross-fold validation method and sets of performancemetrics. Theanalysis shows that 97.4% accuracy was of Naïve Bayes, Multilayer Perceptron having 96.6% and J48 comes with much less accuracy that is 93.5% [23].
C. Fernandes et al, 2017, describes about the different decision tree classifiers and the decision tree classifiers are used to forecast student’s proficiency. CHAID has highest accuracy rate that is 76.11%followed by C4.5 by 73.13% [18].
In data mining classification of large data set is a problem. Data mining has various techniques like classification, regression, clustering etc. This paper mainlyfocuses ontheclassificationtechniqueshaving various algorithms which will help in classifying the records. The datasets contains instances or the classes and the attributes which helps in classifying the records. Random Tree,J48 Decision Tree,Multilayer Perceptron and Naïve Bayes are the algorithms used for the analysis of the classification techniques. Theresearch work mainlyfocuses on thecomparative analysis of the classification algorithms which are Naïve Bayes, Multilayer Perceptron, Random Tree and J48 on Chronic Kidney Disease dataset. The results of comparative analysis are anatomized to deduce best suited algorithm on the basis of definitiveness, execution time, correctly classified instances and incorrectly classified instances.
Naïve Bayes classifier can be used to enhance the traditional classification methods which are used in the medical or bioinformatics areas [14].
A. DATASET USED: In this research work we have used Chronic Kidney Disease (CKD) dataset. The main focus of this reasearch is performance and evaluation of Naïve Bayes, Multilayer Perceptron, J48, Random Tree algorithms. This dataset contains 400 instances and 25 attributes. For analyzing the performance of the classification algorithms WEKA data mining tool is used.
S. Srivastava et al, 2013, worked on the performance of classification algorithms and results are compared and evaluation is done on the already existing datasets. Accuracy of the SPRINT algorithm is more and the performance is satisfactorily good [19].
K.Kishore,M.Reddy,2017, stated about datamining and its different techniques. Two things have been explained one the comparison between different datasets using one algorithm and second comparison of different algorithms using single dataset [26].
N. Jagtap et al, 2017, provided a comprehensive analysis of different classification algorithms like Support Vector Machines, Bayesian Networks, Genetic Algorithms, Fuzzy Logic etc. The comparative study of the algorithms is done on the basis of the advantages and disadvantages of the algorithms [15].
N. Nithya et al, 2014, stated about the Logistics, Simple Logistics, SMO algorithms which are compared on the basis of the accuracy measurement, TP Rate, FP Rate, Precision, Kappa Statistics etc. According to the analysis Logistics method suits best from theFunction ClassifierAlgorithm,butaccording to the time accuracy SMO produces the best result [16].
N. Kaur, N. Dokania, 2018, worked on the comparative analysis of k-mean and y-mean done on the basis of the features like efficiency, number of clusters an item belongs, performance, shape of cluster, detectionrate etc.[24].
International Journal of Trend in Scientific Research and Development @ www.ijtsrd.com eISSN: 2456-6470 @ IJTSRD | Unique Paper ID – IJTSRD50568 | Volume – 6 | Issue – 5 | July-August 2022 Page 860
A. Lohani et al, 2016, worked on the comparative analysis of the algorithms and the result of the analysis is shown using ROC (Receiver Operating System) graphically. This paper shows that if ensemble methods are used than better results can be seen. C4.5 algorithm is not stable [20].
S. Devi, M. Sunadaram, 2016, stated about the data mining and the various research domains, about meta and tree classifiers. This paper provides analysis between meta and tree classifiers and as a result of the analysis it is shown that meta classifier is more efficient than tree classifier [21].
S. Priya, M. Venila, 2017, stated about the cancer diagnosis which is a field of healthcare and the diagnosis of the disease is done with the help of the data mining classification algorithms on the basis of the correctlyand incorrectlyclassified instances [22].
Clinical Diagnosis of the Chronic Kidney Disease is done with the help of urine and the samples of the blood as well diagnosingthesampleof thekidneytissue. Earlydiagnosis and detectionof thediseaseis veryimportant so that failure of the kidney can be stopped. For predicting chronic kidney disease data mining and analytics techniques are used and historical patient’s data and diagnosis records are used. Using the CKD dataset comparative analysis of the algorithms is done on the basis of parameters accuracy, properly graded instances, improperly graded instances, error rate and execution time [28].
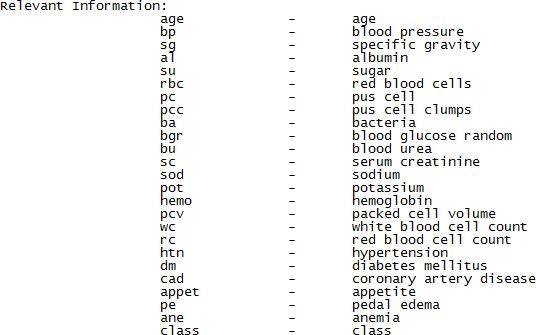
Figure 2: Abbreviations used in dataset 3: Instances and Attributes in Dataset
Figure
Chronic Kidney Disease is a type of disease in which kidney losses its function over a period of month or year.
International Journal of Trend in Scientific Research and Development @ www.ijtsrd.com eISSN: 2456-6470 @ IJTSRD | Unique Paper ID – IJTSRD50568 | Volume – 6 | Issue – 5 | July-August 2022 Page 861

P (d|b) Posterior probability of class (target) given predictor (attribute) of class.
International Journal of Trend in Scientific Research and Development @ www.ijtsrd.com eISSN: 2456-6470 @ IJTSRD | Unique Paper ID – IJTSRD50568 | Volume – 6 | Issue – 5 | July-August 2022 Page 862
P (b|d) likelihood which is the probability of predictor of given class. P(b) Prior probability of predictor of class. J48: J48 classifier is the enhanced version of the C4.5 classifier. Decision tree is produced as a resultbytheJ48. Decision tree produces a tree like structure which has different nodes in it. These different nodes in the tree contain some judgment and each judgment leads to the particular outcome known as decision tree [10]. Simple algorithm is being followed by the J48 which works as follows: New items are being classified byconstructing a decision tree which uses availabletraining datasets values after that those attributes are identified who segregates the distinct instances most clearly [30]. Due to this highest information from the data instances can be gained [30]. Dataset is partitioned into commonly restricted areas where each area has its own tag, values and associated actions to describe its data points. This partitioning helps in deciding which portion of the tree is reaching to a particular resulting node [10].
B. CLASSIFICATION: Classification is a data mining technique and is a supervised learning having broad applications. Classification technique classifies each item of a set into a predefined set of classes or groups. Among all the techniques in the data mining the apex technique is classification. Dataset is being inspected by classification and each instance of the dataset is considered. The instances which are inspected and considered bythetechnique are appointed to appropriateclass such that there will beleasterrorinthemodel Models[29].defining the influential data classes inlying in a particular dataset are withdrawn using classification technique. The two states of the classification includes application of the algorithm to construct the model and afterwards constructed model is tested contrary to a already defined dataset to measure the performance and definitiveness(accuracy) of the model. In this research work we have analyzed Naïve Bayes, Random Tree, J48 and Multilayer PerceptronalgorithmsonChronicKidneyDiseasedataset.Abovealgorithmsarebrieflydescribed below: NAÏVE BAYES: NaiveBayes is oneof theclassifier algorithms in dataminingunderthebayesclassoritcanbe said that it is an enhanced form of bayes theorem. The possible result is calculated according to the input in Bayesian classifier. Those features of class are considered by the naïve bayes which are not related to any other feature of the class [29]. Working of naïve bayes algorithm is described as follows:
Figure 4: Naïve Bayes Theorem [30]
MULTILAYER PERCEPTRON: Linearlyseparableproblemscanbeclassifiedbythesingle layer perceptron.
Weusemorethan oneor multiplelayers for thenon-separableproblems. Forthisweusemultilayernetwork.The Multilayer (feed forward) network has multiple layers including multiple hidden layers containing neurons and these neurons are hidden neurons. By using the past data input is correctly mapped into the output when desired output is not known. With each input the output of the neural network is compared with the desired output so as to compute the error [10]. For computing the error output produces by the neural network is compared with the desirable output [10].
P(d) Prior probability of class. ( | ) × ( ) ( | ) = ( ) ( | ) = ( | ) ∗ ( | ) ∗ ( | ) ∗ ∗ ( | ) ∗ ( )
IV. EXPERIMENTAL RESULTS
Figure of the multilayer network is shown
RANDOM TREE: Random Tree is a type of supervised learning algorithm. This learning algorithm produces various trainees. Random Trees have been introduced by the Leio Brieman and Adele Cutler. Randomtree is a group of treepredictors which is known as forest. The random tree algorithmis as follows: random treeclassifier get its input feature vector, this input vector is compared with each tree in the forest and gives the name of the class as an output with which this input vector matches having majority of votes. 2 machine algorithms are combined to form the random forest. Random forest ideas are combined with single modeled trees.
TOOL USED: WEKA known as Waikato Environment for Knowledge Analysis which is constructed in New Zealand intheUniversityof Waikato. This machinelearningsoftwareiswritteninJava.WEKAisacollectionof visualizationtools and algorithms for thepredictivemodeling[27]. Differenttypesofdataminingalgorithmscan betested usingdifferent type of datasets. Thetechniques which aresupportedbytheWEKAareDataProcessing, Classification,Clustering, Visualization Regression and FeatureSelection [21]. Thereare5 interfaces inthetool and main user interfaceisexplorer with which weworkbutallotherinterfacesprovidessamefunctionalityjustas the explorer [27].
International Journal of Trend in Scientific Research and Development @ www.ijtsrd.com eISSN: 2456-6470 @ IJTSRD | Unique Paper ID – IJTSRD50568 | Volume – 6 | Issue – 5 | July-August 2022 Page 863
Figure 5: Multilayer Perceptron
below:
This research work analyses different classification algorithms accomplishment for Chronic Kidney Disease dataset. Comparison of classifiers for Chronic Kidney Disease dataset is done using criteria accuracy, correctly classified instances, incorrectly classified instances, error rate and execution time to analyse the performance of the classification algorithms and its application domain is also discussed. Models for each algorithm are constructed usingtwomethodsmaily– Cross Validation with 10 foldsoutofwhichtrainingsetuses9foldsand1 fold for testing and Percentage Split in which 60% of the dataset is used for the training and 40% is used for the testing and output is given according to it.
Figures are shown for the comaprison of the different classifiers for CKD dataset using 10 fold cross validation testing bed. Applications are also discussed of these classifiers in the table. According to the table andresearch the execution time taken bythe Random Tree algorithm is leastwith0.02secondsfollowedbyNaïveBayeswith 0.02 seconds, J48 algorithm with 0.1 seconds and multilayer perceptron took much more time for execution which is 8.97 seconds. Accuracy of Multilayer perceptron is 99.75%, J48 with 99%, Random treewith95.5% and naïve Bayes with 95%. The accuarcies of the algorithms don’t have much difference in between. Hence according to the data Multilayer perceptron algorithm is most accurate in case of 10 fold cross validation method.

International Journal of Trend in Scientific Research and Development @ www.ijtsrd.com eISSN: 2456-6470 @ IJTSRD | Unique Paper ID – IJTSRD50568 | Volume – 6 | Issue – 5 | July-August 2022 Page 864 Figure 6: Result evaluation for different classification algorithm on CKD dataset For Chronic Kidney Disease Classifier Naïve Bayes MultilayerPerceptron Random Tree J48 Testing Bed Cross Validation Cross Validation Cross Validation validationCross Applications Text recommenderOnlineSpamclassification,filtering,Application,Hybridsystem Speech recognition, MachineImagerecognition,translationsoftware[32]. Machine learning, Genetic algorithm, FaultMachineryRotatingdiagnosis,[33]. pathologies.recognition,EmotionVerbalcolumn ExecutionTime 0.03 seconds 8.97 seconds 0.02 seconds 0.1 seconds Accuracy 95% 99.75% 95.5% 99% Table 1: Comparison of classifiers for CKD dataset using cross validation testing bed Figure 7: Graphical representation of different algorithms accuracy and execution time using cross validation method.


International Journal of Trend in Scientific Research and Development @ www.ijtsrd.com eISSN: 2456-6470 @ IJTSRD | Unique Paper ID – IJTSRD50568 | Volume – 6 | Issue – 5 | July-August 2022 Page 865
In the graph the abbreviation NB stands for Naïve Bayes, MP for Multilayer Perceptron, RT for Random Tree. The number of correctly classified instances in Naïve Bayes is 380, Multilayer perceptron with 399, Random tree with 382 and J48 with 396. The incorrectlyclassified instances byNaïve Bayes is20,Multilayerperceptron with 1, Random tree with 18 and J48 with 4. Now analysis for CKD using percentage split method is done and this is as below:


Tale 2: Comparison of classifiers for CKD dataset using pecrentage split method
According to this test method that is percentage split it can be concluded that Naïve Bayes, Random Tree and Multilayer Perceptron took 0 sceonds for execution while J48 took 0.01 seconds for execution. Accuracy of the J48 algorithm comes out to be 100% while that of Multilayer Perceptron with 98.125%, Naïve Bayes with 95% accurate and random Tree with 96.25% accuarte. The number of correctly classified instancesin NaïveBayes is 152, Multilayer Perceptron with 157, Random Treewith 154 and J48 with 160. Number of incorrectlyclassified instances in Naïve Bayes is 8, Multilayer Perceptron with 3, Random Tree with 6 and J48 with 0.
International Journal of Trend in Scientific Research and Development @ www.ijtsrd.com eISSN: 2456-6470 @ IJTSRD | Unique Paper ID – IJTSRD50568 | Volume – 6 | Issue – 5 | July-August 2022 Page 866 For Chronic Kidney Disease Classifier NaïveBayes MultilayerPerceptron RandomTree J48 TestingBed PercentageSplit PercentageSplit PercentageSplit PercentageSplit ExecutionTime 0 seconds 0 seconds 0 seconds 0.01 seconds Accuracy 95% 98.125% 96.25% 100%


Graphical representation of different algorithms accuracy in percentage split method. The abbreviationsin the chart stands for Naïve BAyes, Multilayer Perceptron, Random Tree. Graphical representation of correctly and incorrectly classified instnces by the classifiers are:
Figure 9: correctly and incorrectly classified instances in case of Percentage Split
V. CONCLUSION Comparision andinvestigationoftheaccomplishment of various classification algorithms is done using different criteria which are accuracy, execution time, correctly classified instances, incorrectly classified instances and error rate. According to the result evaluation it can be concluded that Multilayer Perceptron is most accurate with 99.75% when 10 folds cross validation method is applied for CKD dataset and forPercentageSplitmethodJ48algorithm is most accuratewith 100% accuracy. From thefigure 7 and 8 it can be analyzed that all the algorithms don’t have much significant difference in between their accuracies. Hence type and size of the datasets are the factors on which algorithms performance depends. Thefurther result evaluation studycan bedoneforthe performance of other classification techniques with large dataset sample. Clustering, association, sequential patterns etctechniques can be used to draw more efficient results apart from the classification technique
International Journal of Trend in Scientific Research and Development @ www.ijtsrd.com eISSN: 2456-6470 @ IJTSRD | Unique Paper ID – IJTSRD50568 | Volume – 6 | Issue – 5 | July-August 2022 Page 867
Figure 10: correctly and incorrectly classified instances in case of Cross Validation
From the graphs it is analyzed that there is no such difference between the perfromance of the classification algorithms they have significant performances for the chronic kidney disease dataset but on th basis of graph analysis Multilayer Perceptron classifier ismost accuratewhenusingcrossvalidationmethodandJ48classifieris most accurate when using percentage split.
Figure 8: Graphical representation of different algorithms accuracy and execution time in percentage split


[9] S. Khare, S. Kashyap, “A Comparative Analysis of Classification Techniques on Categorical Data inDataMining”.International Journal on Recent and Innovation Trends in Computing and Communication, vol. 3, PP 5142-5147, No. 8(2015).
[18] C. Fernandes, et al,“AComparativeAnalysisof Decision Tree Algorithms for Predicting Student’s Performance”. International Journal of Engineering Science and Computing, vol. 7, PP 10489-10492, No.4(2017).
[12] S. Vijayarani, M. Muthulakshmi,“Comparative Analysis of Bayes and Lazy Classification Algorithms”. InternationalJournalofAdvanced Research in Computer and Communication Engineering, vol. 2, PP 3118-3124, No. 8(2013).
[19] S. Srivastava et al, “Comparative Analysis of Decision tree Classification Algorithms”. International Journal of Current Engineering and Technology, vol. 3, PP 334-337, No. 2(2013).
[8] N. Orsu et al, “Performance Analysis and Evaluation of Different Data Mining Algorithms used for Cancer Classification”. International Journal of Advanced Research in Artificial Intelligence, vol. 2, PP 49-55, No. 5(2013).
[5] C. Anuradaha, T. Velmurugan, “A Comparative Analysis on the Evaluation of Classification Algorithms in the Prediction of Students Performance”. InternationalJournalof Science and Technology, vol. 8, No. 15(2015).
[2] R. Sharma et al, “Comparative Analysis of 4,ComputerDifferentClassificationTechniquesinDataMiningUsingDatasets”.InternationalJournalofScienceandMobileComputing,vol.PP125-134,No.12(2015).
[10] Md. N. Amin, Md. A. Habib, “Comparison of Different Classification Techniques using WEKA for Hematological Data”. American Journal of Engineering Research, vol. 4, PP 5561, No. 3(2015).
[11] S. Carl et al, “Implementation of Classification Algorithms and their Comparisons for EducationalDatasets”. International Journal of Innovative Science, Engineering and Technology, vol. 3, PP 700-705, No. 3(2016).
[14] G. Raj et al, “Comparison of Different Classification Techniques using WEKA for Diabetic Diagnosis”. International Journal of Innovative Research in Computer and Communication Engineering, vol. 6, PP 509516, No. 1(2018).
[15] N. Jagtap et al, “A Comparative Study of Classification Techniques in Data Mining Algorithms”. International Journal of Modern Trends in Engineering and Research, vol. 4, PP 58-63, No. 10(2017).
[1] https://en.wikipedia.org/wiki/Data_mining
[17] S. Chiranjibi, “A Comparative Study for Data Mining Algorithms in Classification”. Journal of Computer Science and Control Systems, vol. 8, PP 29-32, No. 1(2015).
VI. FUTURE WORK In future focus will be on how to improve the classifiers performance so that classification techniques requireslesstimetoexecute.Forenhancing theperformancedifferent classificationalgorithmscan be used together.
[4] K. Ahmed, T. Jesmin, “Comparative Analysis of Data Mining Classification Algorithms in Type-2 Diabetes Prediction Data Using Weka Engineering,Approach”.InternationalJournalofScienceandvol.7,PP155-160,No.2(2014).
[6] S. Gupta, N. Verma, “Comparative Analysis of the Classification Algorithms using Weka Tool”. International Journal of Scientific and Engineering Research, vol. 7, No. 8(2014).
[3] knowledge-discovery/https://data-flair.training/blogs/data-mining-and-
[7] R. Sharma et al, “Comparative Analysis of Classification Techniquesin DataMiningusing Different Datasets”. International Journal of Computer Science and Mobile Computing, vol. 4, PP 125-134, No. 12(2015).
REFERENCES
[13] S. Nikam, “A Comparitive Study of Classification Techniques in Data Mining Algorithms”. Oriental Journal of Computer Science and Technology, vol. 8, PP 13-19, No. 1(2015).
International Journal of Trend in Scientific Research and Development @ www.ijtsrd.com eISSN: 2456-6470 @ IJTSRD | Unique Paper ID – IJTSRD50568 | Volume – 6 | Issue – 5 | July-August 2022 Page 868
[16] N. Nithya et al, “Comparative Analysis of Classification Function Algorithms in Data Mining”. International Conference on Information and ImageProcessing,PP272-275, No. 2(2014).
[20] Lohani et al, “Comparative Analysis of Classification Methods Using Privacy Preserving Data Mining”. International Journal of Recent Trends in Engineering and Research, vol. 2, PP 677-682, No. 4(2016).
[24] N. Kaur, N. Dokania, “Comparative Study of Various Techniques in Data Mining”. International Journal of Engineering Sciences and Research Technology, vol. 7, PP 202-209, N0. 5(2018).
[25] E. Sondakh, R. Pungus,“ComparativeAnalysis of Three Classification Algorithms in Predicting Computer Science Students Study Duration”. International Journal of Computer and Information Technology, vol. 6, PP 14-18, No. 1(2017).
International Journal of Trend in Scientific Research and Development @ www.ijtsrd.com eISSN: 2456-6470 @ IJTSRD | Unique Paper ID – IJTSRD50568 | Volume – 6 | Issue – 5 | July-August 2022 Page 869
[21] S. Devi, M. Sundaram, “A Comparative Analysis of Meta and Tree Classification Algorithms Using WEKA”. International Research Journal of Engineering and Technology, vol. 3, PP 77-83, No. 11(2016).
[23] K. Danjuma, A. Osofisan, “Evaluation of Predictive Data Mining Algorithms in Erythemato-Squamous Disease Diagnosis”. International Journal of Computer Science Issues, vol. 11, PP 85-94, No. 1(2014).
[27] earning)https://en.wikipedia.org/wiki/Weka_(machine_l
[26] K. Kishore, M. Reddy, “Comparative Analysis between ClassificationAlgorithmsandDataSet (1: N andN: 1) Through WEKA”. Open Access International Journal of Science and Engineering, vol. 2, PP 23-28,No. 5(2017).
[28] F. Aqlan, R. Markle, “Data Mining for Chronic Kidney Disease”. Proceedings of the 2017 Industrial andSystemsEngineeringConference, vol. 4, No. 3(2017). [29] algorithms/https://data-flair.training/blogs/classification[30] 1366&bih=662#imgrc=kwLT20eBUyxVdM:zbAhXMMY8KHbBVBK0Q_AUICigB&biw=a=X&ved=0ahUKEwjXtcSJr-+theorem+formula&source=lnms&tbm=isch&shttps://www.google.com/search?q=naive+bayes
[22] S. Priya, M. Venila, “A Study on Classification Algorithms and Performance Analysis of Data Mining Using Cancer Data to Predict Lung Cancer Disease”. International Journal of New technology and Research, vol. 3, PP 88-93, No. 11(2017).
[31] Mishra, B. Ratha, “Study of Random Forest Data Mining Algorithms for Microarray Data Analysis”. International Journal on Advanced Electrical andComputerEngineering,vol.3,PP 5-7, No. 4(2016). [32] tron#Applicationshttps://en.wikipedia.org/wiki/Multilayer_percep [33] 1-84628-814-2_82https://link.springer.com/chapter/10.1007/978-