
10 X October 2022 https://doi.org/10.22214/ijraset.2022.46994
ISSN: 2321 9653; IC Value: 45.98; SJ Impact Factor: 7.538

Volume 10 Issue X Oct 2022 Available at www.ijraset.com

ISSN: 2321 9653; IC Value: 45.98; SJ Impact Factor: 7.538
Volume 10 Issue X Oct 2022 Available at www.ijraset.com
Birendra Singh Dhami1, Monika Mehra2, Ravinder Pal Singh3
1Department of Electronics and Communication Engineering, RIMT University, Mandi Gobindgarh, Punjab, India
2Department of Electronics and Communication Engineering, RIMT University, Mandi Gobindgarh, Punjab, India
3Department of Research, Innovation and Incubation, RIMT University, Mandi Gobindgarh, Punjab India

Abstract: In older citizens, Osteoarthritis (OA) in the knees is a frequent cause of restriction in movement and significant decline in their overall wellbeing. Early OA evaluation and treatment can prevent further progression. The accurate evaluation of a visual examination by a doctor is subject to different interpretations and heavily reliant on the degree of expertise that the doctor has. In this study, we use a method called deep learning (VGG16) to determine the severity of knee pain immediately. Simple Xray pictures collected from Kaggle are evaluated and divided into five grades. This model successfully reached a mean precision of 0.858 and a recall of 92.2 percent for knee osteoarthritis grading.
Keywords: Osteoarthritis (OA), Deep Learning, X rays, CNN, VGG16, Machine learning
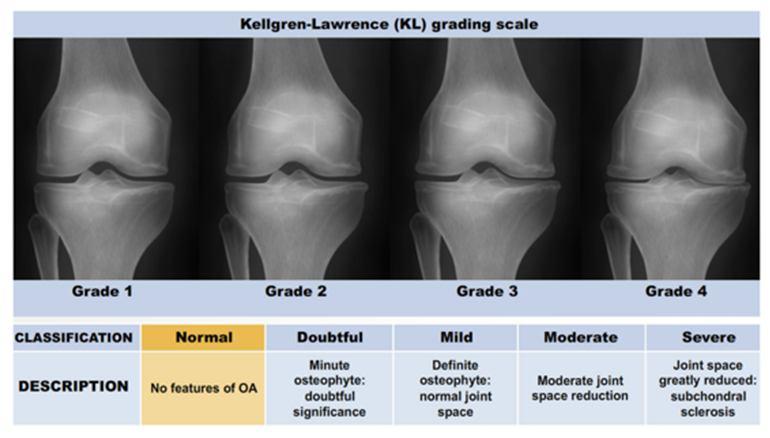
The most common form of osteoarthritis (OA) (knee OA) is the primary cause of the functional decline and health conditions in older individuals [1]. Over 50% of Americans over the age of 65 have at least one hip with imaging signs of OA [2]. By 2030, it is anticipated that further than 20% of US people would also be involved in knee pain and be at risk for OA [3]. The quality of life of senior people is significantly impacted by knee OA pain and other symptoms. It is expensive and inappropriate to routinely examine knee OA.X rays are the standard for detecting knee OA because they are safe, affordable and widely available. Since it was approved by WHO in 1961, The most used approach for rating the severity is the Kellgren and Lawrence (KL) grading system [4] of knee OA. The KL method rates the severity of knee OA in five categories from 0 to 4. The sample and criteria for each grade are shown in Figure 1.
In a couple of seconds, doctors may quickly rate both knee joints after looking at a digital X ray of the knee. The skill and judgment of doctors have a major role in the accuracy of the diagnosis. The KL grading standard is also not entirely clear. This inflammatory illness affects all tissues in the joint, beginning with the degradation of the articular cartilage that cushions the joint and progressing to the formation of bone spurs called as Osteophytes. These changes also have an effect on the joint capsule, leading the synovial fluid that helps to minimize friction in the joint to become less concentrated resulting in increased attrition and resulting pain. Knee OA is typically asymmetrical and affects just one side of the joint. This results in joint space narrowing and misalignment.
For the Knee, the most prevalent arthritis is OA whereas it is one of the primary causes of disability in the world affecting 3.8 percent of the population [4]. Knee OA is the third most common musculoskeletal illness and pathology after only low back pain and neck pain. When compared to other diseases, OA was shown to be one of the leading causes of disability and ranked 11th among all [5] just after diabetes. The YLDs (Years Lived with Disability) metric can be used to quantify disability. Figure 1.2 depicts the ranking of the most common musculoskeletal illnesses based on these criteria. Despite the advent of more current imaging modalities such as CT and MRI, radiographic evaluation remains the gold standard in Osteoarthritis imaging, owing to the low cost and speed of acquisition. It is crucial to accurately identify knee OA and determine its severity due to its high occurrence. Fully automated knee severity grading is capable of providing accurate, consistent forecasts and won't wear out the affected after a prolonged diagnosis. In a number of visual tasks including pictorial classification, activity recognition and semantic distance estimation form of treatment can reverse the damaging structural alterations that cause knee OA to develop. Contrarily, early diagnosis and treatment can assist the elderly in delaying the onset of OA and enhancing their life span. Osteophyte development, subchondral sclerosis, and shortening of the hip joint are knee OA symptoms. The 3D structure of knee joints may be seen on MRI. (Figure 1) In addition, deep learning based technologies provide cutting edge performance [12].
ISSN: 2321 9653; IC Value: 45.98; SJ Impact Factor: 7.538 Volume 10 Issue X Oct 2022 Available at www.ijraset.com
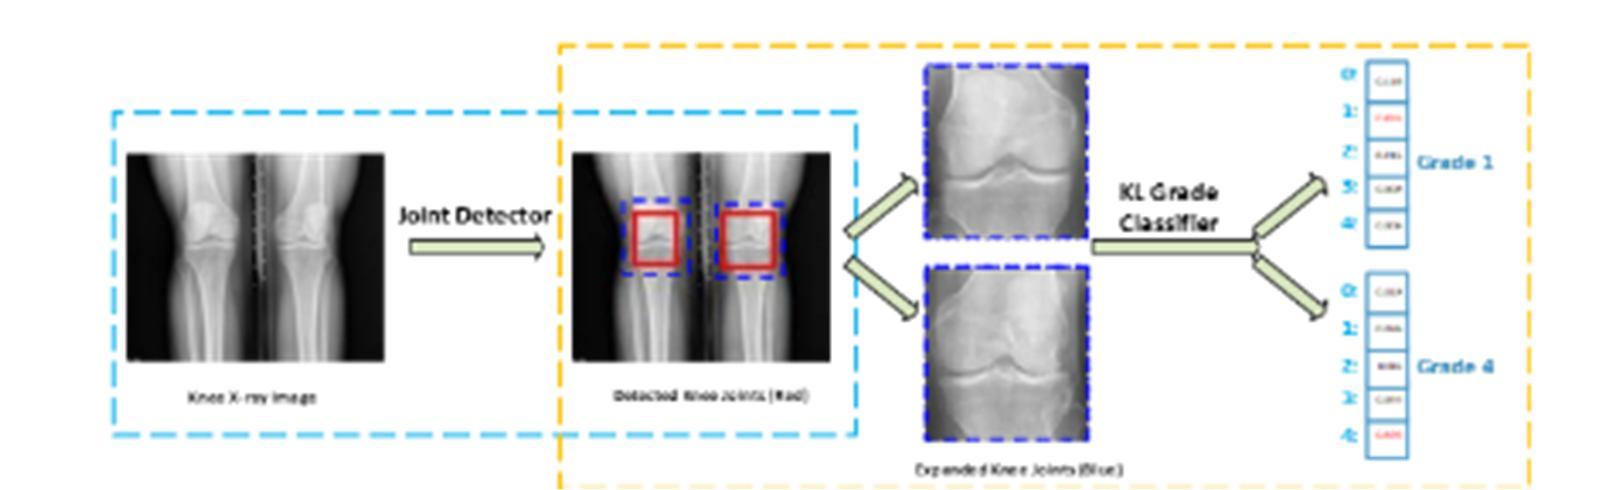
This is made possible by quick advancements in computing power and a wealth of readily available datasets. In the last five years, deep learning has become increasingly utilized extensively in the analysis of medical images for tasks such as cell identification and demarcation, spindle detecting, the diagnosis of white matter lesions and the classification of retinal capillaries. Multiple research [8] have used deep learning based approaches to examine knee OA. The execution though fell short. To cover a vast knee joint sector for Kallgren Lawrence (KL)grading, observed knee joints (Red) are extended by a certain ratio (1.3 in this case) (Dashed blue). Due to the linear form of the KL grading, a better failure function can aid with knee KL grading assignments.
The goal of this study is to enhance the efficacy of current computer aided diagnostic tools while investigating knee OA using medical imaging. These strategies have the potential to improve the lives of those affected by this highly prevalent disease by assisting and expediting diagnosis so that suitable countermeasures may be implemented. We suggest two major enhancements: first the inclusion of more useful data and second the modification of the machine learning model. Furthermore, we look forward to contributing to a better understanding of the relationship between what can be seen in medical pictures and the symptoms that patients suffer from OA when they are impacted by OA. It has the capacity to boost the understanding of the origin of osteoarthritic pain and ultimately influence the focus of therapeutic studies.
Osteoarthritis is one of the musculoskeletal conditions that is most often identified in the knees. Approximately 5% of people worldwide are afflicted by this illness [1]. The most often afflicted are the quadriceps that are affected by OA, which is defined by persistent degeneration of the extracellular matrix at the anterior end [2]. Inflammatory (OA) is a disorder that worsens with time and affects the whole knee joint. An illness known as knee OA is brought on by inconveniences with both mechanics and metabolism. Important prognostic markers for OA include older age, diabetes and past knee injury. A person's capacityto perform is hampered by pain from OA which also reduces their quality of life. Total Joint Replacements (TJR) are pricy and have a limited lifespan which is more common in the case of obese patients.[5]. Early identification of knee OA is crucial to begin therapies like calorie restriction and rehabilitation and has proven to be effective, demonstrated to be effective in delaying TJR and reducing the progression of knee OA [3, 6]. The most used radiographic grading system for OA is X ray plain imaging in which the changes are evaluated by Kellgren Lawrence rating photographs. This technique delays the diagnosis of OA nevertheless because the bone abnormalities only appear in severe cases. Other scanners including neuroimaging can identify the onset of knee OA by looking for Knee deterioration, gelatin and bone matrix bend examples of hard tissue markers[1]. There are six areas within the knee including all the mucosa and the medial vertebra which are segmented by Norman et al. [4] using 2D U Net. Both OA patients and non OA individuals are included in this study. Robust DSC has been observed for this model using the 3D DESS image database where smaller components have coefficients between 0.753 and 0.878. The average calculation time for the automated cartilage segmentation model is 5 seconds. In a manner similar to that of Si et al. [7] and Norman et al. [14], they decided to segregate the data using 2D U Net. Images of femur, tibia, kneecap and each of their associated hyaline cartilage using MR images were used. By segmenting the cartilages,14 physical areas and their chondro thicknesses are determined. In this investigation, cartilage partition DSCs were found to vary from 0.76 to 0.87. Wetherand colleagues [11] used both axial FLASH and coronal DESS images, 2D U Net to segment demonstrated excellent expertise and understanding with fibrosis Chronological constancy of tests.
ISSN: 2321 9653; IC Value: 45.98; SJ Impact Factor: 7.538 Volume 10 Issue X Oct 2022 Available at www.ijraset.com
Osteoarthritis (OA) of the knee is being studied as part of the Rheumatology interdisciplinary which is a long term population‐based study. The study aims to find biomarkers for OA progression and development [7]. Images from a knee X ray were used for evaluation. There are 4796 participants in this program ranging in age from 45 to 79. We used our suggested strategy to access knee bilateral PA fixed flexion of X ray images from the normal control. Since OA is a sub survey, the spatial sharpness and size of these baseline cohort knee X ray pictures differ. Prior to assessing OA in the knee, an X ray examination is required. All raw X ray pictures must first be scaled to the identical mechanical level because it is nearly the core of all picture’s physical specifications. In this study, the 0.14mm/pixel figure was chosen. We then crop the adjusted Xray’s center with either a height of 2048 images or a height of 2560 squares to guarantee that all edited photos are the same size. We only keep X ray images of both knee joints with KL classes available because we can anticipate KL grades of both left and right knee joints from a single X ray image. (Figure 2)
All knees X ray pictures were separated into learning, accuracy and training set in a ratio of 7: 1: 2. So that the level range generally treads across the training, validates, and passes datasets. This is done grade by grade based on the KL level of either of the knee joints in an X raypicture of the knees. Following several failed efforts, the knee test data was separated into 639 grade 0 knee joints, 296 grade 1 knee joints, 447 grade 2 joints, 223 grade 3 knee joints and 51 grade 4 knee joints. We used our training dataset as the VGG16 [10] model to implement, train and feature extraction from the CNN. Also we employed the ImageNet [12] toolkit to find the best discriminatory collection of characteristics. We retrieved attributes from the various VGG layers, including the fully connected (fc7), sharing (pool5), and conventional (conv5 2) layers. For categorizing knee OA photos linear SVMs (learned using LIBLINEAR [18]) were trained using the dataset. In this paper, we adjust all of these very well. The optimal CNN model for the knee KL grading was employed utilizing well known CNN classifying models.
Environmental exposure can result in knowledge and behavior acquisition or change. Even the tiniest creatures and plants have this capability [5]. To be able to evaluate from the beginning to place training into a broader framework or extrapolate new information one must possess the requisite skills, knowledge, experience, training, or capacity. Since the last couple of centuries, with the advancement in artificial intelligence information on behavioral science, biology and several of the components connected to learning have been identified. This is one of the most fascinating difficulties in computer science since the advent of computers and a fantastic illustration of research. Machine learning helped to establish new fields including computation, neuroscience and machine intelligence. The study of learning computational modeling serves as the foundation for machine learning. Humans have been unable to solve many issues with the advent of machine learning and data mining especially in the area of optimization. Contrary to common opinion, computers find it difficult to do many tasks that humans can complete with ease such as classifying or identifying items in a picture. If you're wondering why this occurs then it's because none of these issues have received prominent attention. Designing a machine readable algorithm that can identify characteristics in a picture is really difficult. This may be achieved by training a computer to identify familiar objects in a similar way as that to how young children learn to do so. Generally speaking, this research tries to provide the ability to robots to learn from input that is not training data. "Using a class of tasks T and performances, a computer learns from experienced E Consequently, if its t, as determined by quality measurement P, becomes better with practice E "[6]. This model not only provides a formal definition of learning algorithms but also emphasizes the need of utilizing them.
ISSN: 2321 9653; IC Value: 45.98; SJ Impact Factor: 7.538
Volume 10 Issue X Oct 2022 Available at www.ijraset.com
Most learning models have two phases: the training set, the process of model building from the data and the testing phase during which the model's effectiveness is assessed. Consequently, the definitions in the previous section of machine learning depend substantially on data to the function. There are many other methods to arrange data including integers and sequences. Every collection has three unique datasets that are ordinarily combined into a single collection[7] and the training set contains training data for the model.
1) Test Set: When assessing the model's performance after the training, it comprises elements that are not a part of the training level.
2) Validation Set: The data can be applied to verify and modify the model by being saved. The implementation phases frequently contain more data than the other two categories. The training set typically receives 60% of the data while the test and validation sets receive 20% and 20% of the data respectively. Nevertheless using only a subset of the data for calibration and validation, if the sample size is inadequate then it may produce inaccurate findings. Cross validation [8] is a common technique in these cases.
Three factors, the type of data whether extra input is included, how the model is guided and the kind of work to be done have led to the classification of machine learning tasks into three general categories [7].
1) Monitored Learning: This approach uses graded or labeled data to infer the function. For instance, input output pairings in the training process need to be properly matched. A generalized function must be learned from an unexpected input to produce the intended output.
2) Unsupervised Learning: Model gains knowledge of how to analyze data for routines and processes. An unsupervised method can be used as a stage in the process if the model's objective is clustering.
3) Reinforcement Learning: While direct estimating simply uses the immediate knowledge for analysis of data learning models learned from the consequences. The only types of information included are whether the activity reports are reliable or not. After finishing an action, the RL users utilize a credit scoring system to signify how successful the activity has been. The users want to increase the compensation over time.
The idea of training in which some (usually a large number) of the training set's pieces are not labeled, or several of the labeling are not legible or inaccurate comes between supervised and unsupervised training. As a machine learning task, active learning has lately grown in prominence.There is a lot of unlabelled data in this technique and it is feasible to recognize it but takes a lot of time and effort. An active learning model could examine a labeled subset of data that belongs to some other category.
For instance, to use the least number of the dataset a supervised training system must examine the data and pinpoint the items that need extra classification to infer the largest input label map.
The predicted result may also be used to classify machine learning modules [7].
1) Classification: A framework that splits an undetermined input into two different groups and delegates it to one or several of these divisions is what machine learning seeks to create. In this instance a class has been assigned to the test dataset.
2) Regression: For this reason, the dataset must be continuous rather than discrete when based on real height. With supervised learning, classifications and regression are both feasible.
3) Clustering: The information that has been supplied has to be organized. Cluster is a classic illustration of supervised techniques because the groupings are not known beforehand.
4) Density Estimation: Controls the distribution of input data within a certain area. The predicted distribution can be used to capture and analyze data or data can be purposefully created to closely mimic the real model.
5) Dimensionality Reduction: To reduce the amount of input one method is to train with small data.
6) Representation Learning: Before supplying data to the classifier, pre processing is required to extract useful features. The goal of this research is to discover the best ways to identify and extract these qualities from unprocessed data. Presently to solve these problems several artificial neural networks use represented knowledge acquisition.
ISSN: 2321 9653; IC Value: 45.98; SJ Impact Factor: 7.538 Volume 10 Issue X Oct 2022 Available at www.ijraset.com
After pre processing a knee X ray image is 2048x 2560 in size, which is too large for VGG16. We resize each of these pictures to 256 by 320 pixels in order to use them as the input for identifying knee joints. The indicated boundary boxes are proportionally scaled to the new dimensions. Instead of sending we initially make some adjustments by multiplying it by the standard error before feeding the X ray picture right into the CNNs. The training pictures are used to calculate the mean and standard deviation. Then, we create a three channel image by convolving. The computer was fed three parallel reduced knee X ray pictures. Knee datasets are grouped using K means. The bounding boxes in the trials range in number from one to six. Additionally, the contrasting of the results is done.
The knee X ray picture is enhanced, stabilized and then concatenated during the testing period by applying the same pre processing technique as during training. After the network has completed its main pass on the input picture bound boxes with data sets smaller than 0.12 are eliminated. The remaining convolution layers are then pruned using Non Maximum Inhibition (NMI) with an intersection ratio of 0.7. The ultimate result is the confined box with the highest rating. In sequence to clip the kneecap for the ensuing knee KL assessment and assess the detection the detected data object is then assigned to high magnification (2048 2560). Step by step attainment of the result is shown below (Figure 3 to Figure 7)
Figure 3: Simulation code for training
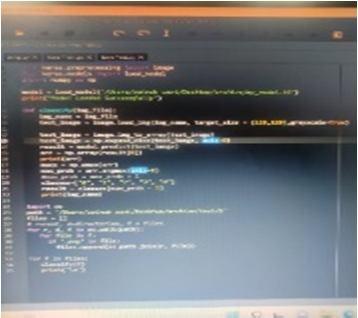
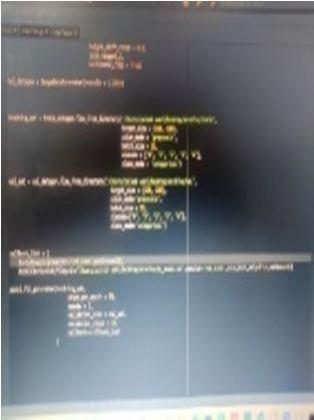
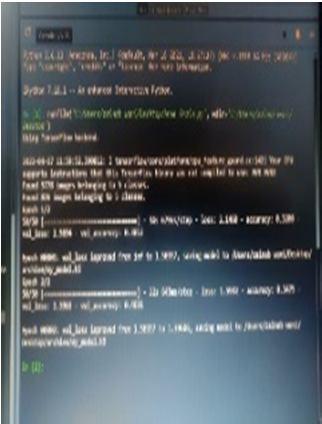
Figure 4: Simulation code for Testing Figure 5: Sorting of the images. Figure 6: Continued testing results
ISSN: 2321 9653; IC Value: 45.98; SJ Impact Factor: 7.538
Volume 10 Issue X Oct 2022 Available at www.ijraset.com
Figure 7: Intervals are used to validate accuracy and loss
In this study, we fine tune CNN classifiers for knee KL grading using a special numeric loss, which employs a modified VGG16 model to detect the knee joint. Modified and novel results are produced by both knee KL grading and knee joint identification. But according to our observations VGG16 is better suited to OA to a less variable image size premised on its efficacy in the knee joint classification. The proposed model helps in ordinal loss improvement classifiers and lowers the MAE between predictor and test set as compared to using across all prominent layers. CNN base classifiers work on the knee KL scoring issue and demonstrate its use in arbitrary classification methods. The enhanced VGG16 model has the highest identification capability when compared to ResNet or DenseNet variations highlighting how dependent CNN models are on the recognition problem.
I would like to convey my heartfelt appreciation to my supervisor, Dr. Monika Mehra, Professor, Department of Electronics and Communication Engineering and Ravinder Pal singh, Technical Head, Department of Research, Innovation and Incubation at RIMT University Mandi Gobindgarh for launching an engaging project, their dedication, stimulating debate and valuable advice. They have been a constant source of encouragement and useful direction and oversight throughout the project.
[1] P. G. Conaghan, M. Porcheret, S. R. Kingsbury, A. Gammon, A. Soni, M. Hurley, M. P. Rayman, J. Barlow, R. G. Hull, J. Cumming, et al., Impact and therapy of osteoarthritis: the arthritis care a nation 2012 survey, Clinical rheumatology 34 (9) 2015 pp.1581 1588.
[2] T. Neogi, The epidemiology and impact of pain in osteoarthritis, Osteoarthritis and Cartilage 21 (9) 2013, pp.1145 1153.
[3] J. M. Ortman, V. A. Velkoff, H. Hogan, et al., An aging nation: the older population in the United States, 2014, pp 1452 1445
[4] J. Kellgren, J. Lawrence, Radiological assessment of osteoarthrosis, Annals of the rheumatic diseases 16 (4),1957 pp.494.
[5] A. G. Culvenor, C. N. Engen, B. E. Øiestad, L. Engebretsen, M. A. Risberg, Defining the presence of radiographic knee osteoarthritis: a comparison between the kellgren and Lawrence system and oarsi atlas criteria, Knee Surgery, Sports Traumatology, Arthroscopy 23 (12), 2015 pp. 3532 3539.
[6] Z. Niu, M. Zhou, L. Wang, X. Gao, G. Hua, Ordinal regression with multiple output CNN for age estimation, in CVPR, 2016, pp. 4920 4928.
[7] L. Shamir, S. M. Ling, W. W. Scott Jr, A. Bos, N. Orlov, T. J. Macura, D. M. Eckley, L. Ferrucci, I. G. Goldberg, Knee x ray image analysis method for automated detection of osteoarthritis, TMBE 56 (2) 2009 pp. 407 415.
[8] J. Antony, K. McGuinness, N. E. O’Connor, K. Moran, Quantifying radiographic knee osteoarthritis severity using a deep convolutional neural network, in ICPR, 2016, pp. 1195 1200.
[9] A. Tiulpin, J. Thevenot, E. Rahtu, S. Saarakkala, A novel method for automatic localization of joint area on knee plain radiographs, in SCIA, 2017, pp. 290 301.
[10] N. Dalal, B. Triggs, Histograms of oriented gradients for human detection, in International Conference on computer vision & Pattern Recognition (CVPR’05), Vol. 1, 2005, pp. 886 893.
[11] J. Antony, K. McGuinness, K. Moran, N. E. OConnor, Automatic detection of knee joints and quantification of knee osteoarthritis severity using convolutional neural networks, in MLDM, 2017, pp. 376 390.
[12] J. Long, E. Shelhamer, T. Darrell, Fully convolutional networks for semantic segmentation, in Proceedings of the IEEE conference on computer vision and pattern recognition, 2015, pp. 3431 3440.
[13] A. Tiulpin, J. Thevenot, E. Rahtu, P. Lehenkari, S. Saarakkala, Automatic knee osteoarthritis diagnosis from plain radiographs: A deep learning based approach, Scientific reports, 2018 pp.17 27