https://doi.org/10.22214/ijraset.2023.48990

11 II
February 2023
ISSN: 2321-9653; IC Value: 45.98; SJ Impact Factor: 7.538

Volume 11 Issue II Feb 2023- Available at www.ijraset.com

https://doi.org/10.22214/ijraset.2023.48990
ISSN: 2321-9653; IC Value: 45.98; SJ Impact Factor: 7.538
Volume 11 Issue II Feb 2023- Available at www.ijraset.com
Abstract: This report is about the optimization of a tie rod, which is a crucial part of a car's steering system. The tie rod is typically made of cast iron, but in this study, we also used aluminum to make the tie rod. We analyzed the performance of the tie rod using different methods such as theoretical calculations, experiments, and computer simulations. We compared the results of the aluminum tie rod with the traditional cast iron tie rod, and evaluated them based on cost and weight. Our calculations showed that aluminum tie rod is a better option as it is lighter and cheaper than the cast iron one. The experiments and computer simulations confirmed these findings and showed that the aluminum tie rod is a good alternative to the traditional one.
Keywords: Finite Element Analysis, Natural frequency, Tie rod, Validation, model analysis, stress analysis.
A. The Steering System on a Common Car
The tie rod is a crucial component in the steering system as it connects the center link to the steering knuckle. It transmits the force from the steering wheel to the wheels, allowing the vehicle to turn. In this study, the optimization of the tie rod in a car's steering system was investigated using experimental and finite element analysis methods. The conventional material for tie rods is cast iron, but in this research, tie rods made of aluminum were also examined. Both materials were analyzed theoretically, experimentally and through Finite Element Analysis.
B. The significance of the Steering System on aCommon Car
One of the key components in the steering system is the tie rod. It connects the steering knuckle to the center link and is responsible for transmitting the direction force from the rear wheel to a wheels. In this study, the improvement of the tie rod in a steering system of a car was investigated using experimental and finite element analysis (FEA) methods. The conventional tie rod material is cast iron, but in this work, the tie rod was made of aluminum material. The properties of both materials were analyzed theoretically, experimentally and using FEA.

C. Importance of the Steering System Tie Rod
In this dissertation, the focus is on the optimization of the tie rod of a steering system using experimental and FEA analysis. The tie rod is traditionally made of cast iron, but this work explores the use of aluminum as a potential material for the tie rod. The properties of the aluminum tie rod are compared to those of the traditional cast iron tie rod in terms of cost, weight, and performance. Theoretical calculations, FEA analysis, and experimental testing are all used to gather data on the properties of the tie rod. The results of the analysis showed that the use of aluminum as a material for the tie rod can lead to a reduction in weight and cost while maintaining or improving performance. The natural frequencies and total deformations of the tie rod were also derived using FEA, and the results were validated through experimental testing using FFT. Overall, the study showed that the optimization of the tie rod using aluminum as a material is a viable option for improving the performance and cost-effectiveness of the steering system.
The study "FEA of Tie Rod of Steering System of Car" by Manik A. Patil et al. [1] addresses the significance of a rod in a vehicle's steering mechanism and how it might fail owing to changing forces during steering and vehicle bumps. The authors state that the suspension system takes up a significant percentage of the vehicle's weight, but the tie rod can still be a cause of concern due to vibration and fatigue. If the ensuing vibration and strains are high and excessive, these variables might lead to structural collapse.
ISSN: 2321-9653; IC Value: 45.98; SJ Impact Factor: 7.538
Volume 11 Issue II Feb 2023- Available at www.ijraset.com
The authors undertake a Finite Element (FE) study of a common automobile tie rod to estimate its frequency response in the article. This analysis can help understand how the tie rod behaves under different loads and conditions, and how to improve its design to prevent failure.
Suraj Joshi et al [2] investigate the failure mechanisms of steel tie rods in service. To lessen the chance of shear & bending fracture in engaged thread teeth, the authors advice keeping the number of involved thread turns as low as feasible. For large-diameter steel tie rods with nominal diameters more than 80 mm, they propose a trapezoidal threaded connection. When there are less than eight engaged turns, failure manifests itself at the involved threaded connection as shearing and pulling out of the thread teeth for both triangular & trapezoidal type thread connections. Failure occurs in the middle portion of the unengaged thread in the form of necking and breaking of the cross-section of the tooth root on unengaged thread when the number of engaged revolutions is exactly eight. This study sheds light on the failure patterns of steel tie rods and how the design of the threaded connection affects the tie rod's strength and dependability.
A research on a failing tie rod end of an SUV is described in the publication by A.H. Falah et al [3]. The authors employed spectrum analysis & hardness testing to identify that the fail item was made of AISI 8620 steel, but that its composition & hardness did not meet the stated requirement. Further investigation revealed that the failure of a tie rod ends was mostly caused by fatigue. The fatigue crack may have developed and spread from destructible regions close to the throat, according to the fractographic features also on fracture surface of a threaded part of the rod, including crack propagation region and beach marks. According to the failure study results, the major cause of the tie rod's failure was most likely a material defect. The creation of the crack initiation & spread, as well as a decisive fracture inside the cracked region, confirm this notion and are consistent with the SUV driver's allegation that the accident occurred due to an incompatible mechanical element, in this case, the tie-rod end. This research emphasises the need of adopting materials that meet specific requirements to ensure the vehicle's safety and dependability.
Sergio Lagomarsino and Chiara Calderini's study [4] examines the axial tension forces of metal tie-rods in brick vaults and arches. The three modal frequencies of the tie-first rod, as measured by a dynamic test, are used by the authors to propose an identification strategy. A unified beam that is spring-hinged at both ends and is applied to an axial tensile load makes up the reference structural system. The unknowable variables are the section's bending stiffness and the rigidity of the spinning springs. The characteristic equation of this structural system does not permit analytical solutions, hence the research offers an approximative numeric solution based on an elimination method of an appropriate error function By utilising a FEM algorithm to identify a group of ideal tie-rods, the theory's robustness is assessed. The authors additionally test the impact of the assumptions of mechanical stiffness homogeneity along the axis of the tie-rod and equality of the constraint conditions at its extremities on tensile force estimate. Finally, the procedure is validated using actual tie-rods. This study gives a practical technique for determining the axial tensile stress of metal tie rods in brick vaults & arches, and it emphasises the need of addressing the structural qualities of the tie-rods to assure the arches' and vaults' safety and stability.
Umesh S. Ghorpade et al [5] focus on the significance of engine mounting systems in automotive vehicles and how they impact many elements of vehicle performance. The authors emphasise the need of speedy and exact engine mounting system examination throughout the early phases of development, without the necessity for a physical sample of the vehicle. The engine bracket is intended to serve as a framework to support the engine, and vibration and fatigue of the bracket can cause structural failure if the associated vibration and stresses are high and excessive. The authors emphasise the need of doing extensive research to comprehend the structural properties and dynamic behaviour of the engine bracket. . The research gives a Finite Element (FE) analysis of a common vehicle engine bracket and calculates its natural frequency. This study gives useful insights into the performance and behaviour of the engine bracket, which is critical for the design and optimization of the engine mounting system.
Michael Adam Kaiser's study [6] explains particular developments in the approach for improved alignment of stress and strain pulses utilising slope changes rather than definite period He also focused on a validation strategy for impedance misfit at a materials contact-based specimen diameter calculation. Additionally, he developed a technique for evaluating longitudinally bars' dispersive properties and use the Hopkinson bar apparatus that was currently in use These advancements could help improve the accuracy of the analysis of tie rods, and better understand their behavior under different loads and conditions.
The load on each wheel is further divided into vertical load and horizontal load. The vertical load is the weight of the vehicle and the horizontal load is the force acting on the wheel due to the steering of the vehicle. The tie rod transfers this horizontal load from the steering rack to the steering knuckle, which in turn moves the wheel. To calculate the stresses in the tie rod, the load acting on the tie rod and the dimensions of the tie rod are needed.
ISSN: 2321-9653; IC Value: 45.98; SJ Impact Factor: 7.538
Volume 11 Issue II Feb 2023- Available at www.ijraset.com
The load on the tie rod can be calculated by using the standard assumptions and formulae for the weight of the vehicle and the load on each wheel. The dimensions of the tie rod can be obtained from the manufacturer's specifications. The theoretical stresses are then compared with the stresses obtained from the FEA analysis. If the deviation between the two is within the acceptable limit, it can be concluded that the theoretical analysis is valid.
A. Static Load on One Front Wheel Calculation of the Wheel-Turning Force
This force is known as the steering torque. The steering torque is calculated by multiplying the weight of the vehicle on the front wheel by the distance between the center of the wheel and the point where the steering force is applied. This distance is known as the moment arm. The greater the moment arm, the greater the steering torque required to turn the wheel.
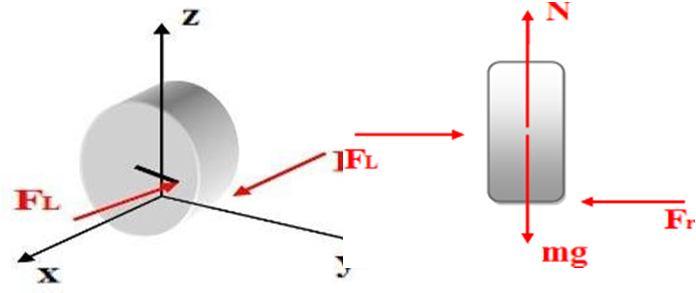
Fr = Friction force
N = Normal
mg = Weight
FL = Lateral force
The wheel is resting on the floor on a surface, which means it is not resting on a single point. As a result, it appears to have two forces of friction, as shown in the following image.
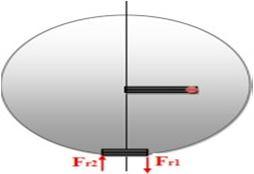
In Above figure, the large inky rectangle represents a drawing a driving arm. The point of application of the lateral force is indicated by the red point. The Rs represent the horizontal distance between the black and red spot and the center. A little black block depicts the surface where the wheel & floor make contact. The frictional forces Fr1 and Fr2 can be observed on the wheel's interaction surface, which is located at a range of r1 & r2 from center.
Fr1 and Fr2 are equal but move in opposite directions, r1 & r2 are also equal, so:
r1 = r2 = r
We now carry out the calculations
∑ FX =0; FL-FR=0 (1)
∑ FY =0; N – mg = 0 (2)
∑ MY =0; FL × RS – 2FR × R = 0 (3)
Using equation (1), we can deduceFL = FR, Equation (2) provides us with N= mg
This specific type of vehicle has an approximate weight of 2600 kg when the driver and passengers are included. It is known that the front wheel axis accounts for 45% of the total weight of the vehicle.
Weight could be,
2600 × 45% = 1170Kg
For one wheel; 1170÷ 2 = 585kg
N = 585 × 9.81 = 5738.85N
Now we find the Force of Friction Fr.FR = µ × N;
ISSN: 2321-9653; IC Value: 45.98; SJ Impact Factor: 7.538
Volume 11 Issue II Feb 2023- Available at www.ijraset.com
When the friction factor is µ. Similarly for establishing a safety coefficient, we are considering the highest value of μ. Now we set μ = 1.
Now wemeasure the force of friction: FR = µ ×NFR = 1×5738.85
FR = 5738.85 N
And fromequation number (1) FL=FR so:
FL = 5738.85 N
The rack is responsible for transmitting this force to the tie rods, which are then connected to the movable arms of the steering wheel. The torque can also be measured on the pinion. Equation 2 is used to calculate the torque.
T=F× Rpinon
Here, wehave a diameter of pinion 24 mmso:T = 5738.85 × 24
T=137732.4N.mm
This represents pinion's torque, which is transferred from steering wheels from the steering column. The next step is to calculate the tangential force that the driver needs to apply to the steering wheel in order to drive the wheels
T = F × R steering wheel
Where R steering wheel is the radius of the steering wheel.
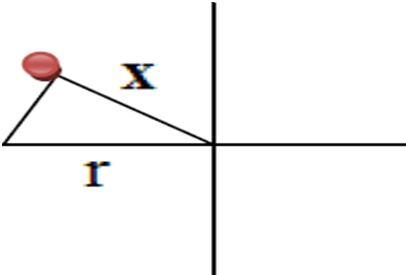
To determine the steering wheel radius, we must first take into account that the steering wheel is not a full circle, and has a size of 200mm on each vertical side and 250mm on each horizontal side.
The left hand of the driver is shown by the dark point.We must determine x because,
r = 420 ÷ 2 = 260mm
x = cos 30 × r = cos 30 × 260 = 225.16mm
Finally, we establish the critical peripheral force required for the tyres are turned by the operator.
T= F × r steering wheel
F = T ÷ r steering wheel
F = 137732.4 ÷ 225.16F = 611.70N
This describes the force that exists when a vehicle is at rest and represents the moment when the force required to rotate the wheels is at its highest. Additionally, we must take into account the high weight values and the decision to include a safety coefficient in the calculations.
Assuming both ends of the Tie rod is hinged.
*For CI=yield stress=585 N/mm2 and E = 2.1 X 10⁵ N/mm2
Calculations:-
Area of the rod is, A = (π ÷ 4) × D2
Where D= 40 mmand A = (π ÷ 4) × 402, A=1256 mm2Moment ofInertia of Tie rod is,
I = (π ÷ 64) × D4
Where, D=18 mm
Moment of Inertia (I) =5153 mm4 Length of theTie rod is, L=381 mmBuckling load of the Tie rod is,
P = (π2El) ÷ L2
Where, E = 2.1 X 10⁵ N/mm2, I= 5153 mm4, L=381mm
P = (π2 × 2.1 X 105 × 5153) ÷ 3812
ISSN: 2321-9653; IC Value: 45.98; SJ Impact Factor: 7.538
Volume 11 Issue II Feb 2023- Available at www.ijraset.com
Buckling load ofTie rod =P= 53574N
The Direct compressive stress ofTie rod is,σ = (P ÷ A)
σ = (53574 ÷ 1256)
σ = 42.65 N/mm2
Which is less than yield stress = 276 N/mm2. So thedesign is safe for compressive stress. Now we can find value of mass for each material of tierod, We know that, ρ=mass/volume
So, Mass= ρ × volume Mass = ρ × π/4 × D2 × L
a) Mass of Aluminium
Mass = 2700 × π/4 × 0.042× 0.381
= 1.29 Kg
b) Mass of Cast Iron
Mass = 7200 × π/4 × 0.042× 0.381
= 3.44 Kg
A. Impact Testing Necessities
To obtain accurate results in impact testing, there are certain points that need to be considered. These include the ability to approve or decline, a pretrigger delay, exponential windowing, and the force measurement.
Additionally, two time domain windows, such as force and exponential windows, are employed in impact testing. These windows are applied to the signals after they have been sampled by the FFT analyzer. The force window helps to eliminate noise from the impulses (or force) signal, while the exponential window reduces spectrum response leakage in the impulse response signal. This is crucial for obtaining accurate results in impact testing.
Additionally, it is important to consider the use of a pretrigger delay to ensure that the entire impact signal is captured, and the use of approve/decline capabilities to filter out any unwanted signals. Overall, proper consideration and use of these techniques can lead to more accurate results in impact testing.
The transform window makes the assumption that the signal being changed is periodic in nature. The pulse would have to have continuities now at start and finish when replayed just outside of the transformed screen to be deemed periodic in the transform window.
Signals in the transform window that are deemed periodic are:
1) Signals that are totally confined inside the transformed frame.
2) Cyclic signals that finish an exact number of times inside the transformation frame. However, if the temporal signal is not regular in the transformation frame, it will widen its spectrum when translated to the frequency domain, a phenomenon known as leakage. Leakage alters the spectral range and can cause incorrect findings. As a result, if a impact test signal response amplitude decreases to zero (or almost zero) well before expiry of the test windows, there is zero leaking and no extra windowing is required. If, on the other hand, the reaction doesn't really decrease to nil well before completion of a sampling window, a logarithmic screen should be employed to reduce the impacts of leakage in the structural response. The exponentially frame consistently increases simulated damper for each of the structure's modes. After curve fitting, this synthetic damp is eliminated from the modal damp estimates. Most crucially, a well fitted exponentially frame will completely confine the original signal inside the sampling window, reducing leakage to the minimal inside its range.
ISSN: 2321-9653; IC Value: 45.98; SJ Impact Factor: 7.538
Volume 11 Issue II Feb 2023- Available at www.ijraset.com
Because accurate impact testing results depend on understanding the factors that affect them, frequency response function (FRF) measurements are typically performed using spectrum averaging, a feature found in most modern FFT analyzers. It is recommended to use 3 to 5 impacts per computation when evaluating FRFs. An FFT analyzer designed for impact testing should have the capability to accept or reject the results of individual impacts, as some impacts during the measurement process may not be accurate. The ability to accept or reject impacts saves time and allows for efficient data collection during impact testing.
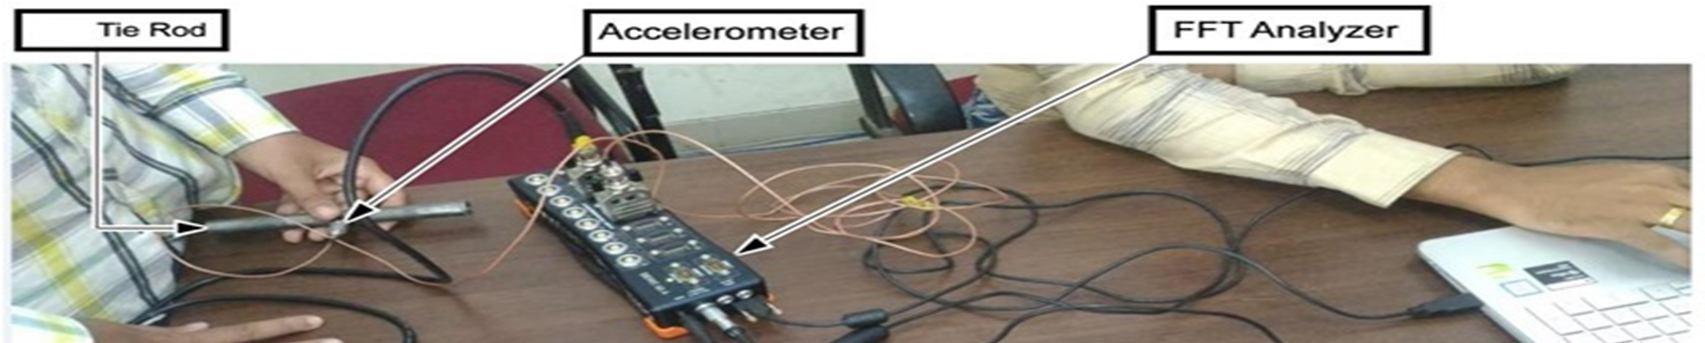
In a roving hammer test, a hammer is used to strike the structure at different locations, known as the degrees of freedom (DOFs). The impact location is changed for each measurement, and an accelerometer is placed at a fixed location to measure the response. The measured frequency response functions (FRFs) are used to determine the mode shapes of the structure, and multiple impacts are used to improve the accuracy of the results. A 2-channel FFT analyzer is used to calculate the FRFs between the impact location and the fixed response location. The setup for this test typically includes the hammer and accelerometer, as well as the necessary data acquisition equipment to collect and analyze the results.
G. Roving Tri-axial Accelerometer Test
With a roving tri-axial accelerometer, all the points on the structure can be impacted in all three directions, allowing for more accurate and complete characterization of the structure's mode shapes. However, this method requires a 4-channel FFT analyzer for simultaneous sampling of the tri-axial accelerometer and force data, which may be more expensive than a 2-channel analyzer. Additionally, the stationary impact point may be less representative of the structure's overall response when compared to a roving hammer test.
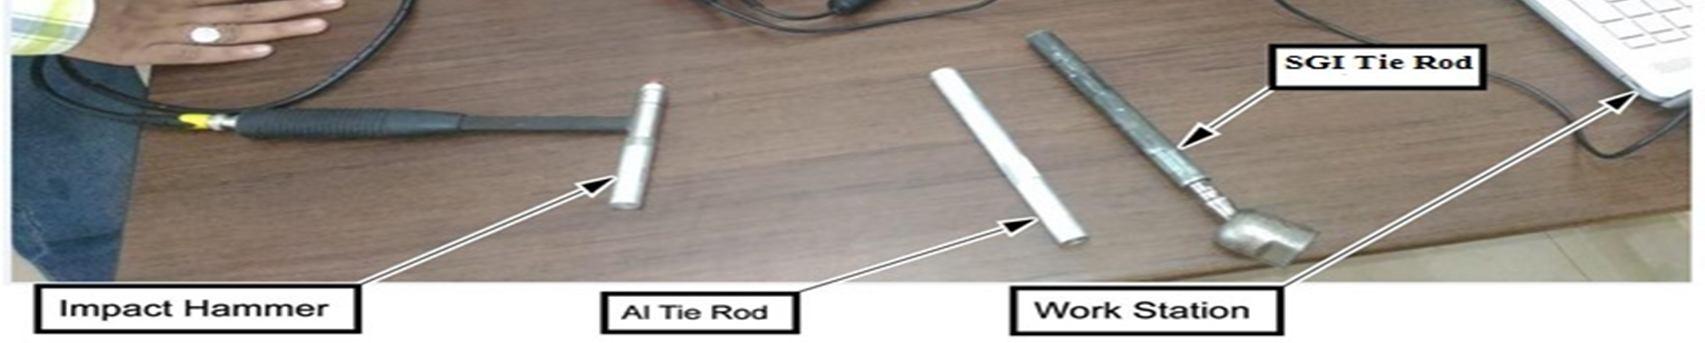
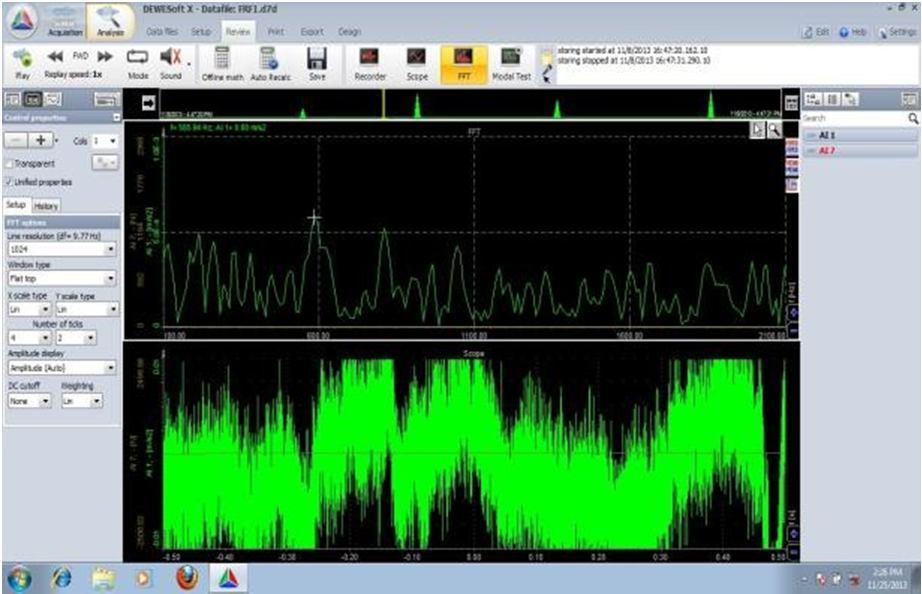
A. Experimental Setup
ISSN: 2321-9653; IC Value: 45.98; SJ Impact Factor: 7.538
Volume 11 Issue II Feb 2023- Available at www.ijraset.com
The DEWEsoftX software is used to process the acquired data and generate results such as frequency response functions (FRFs) and mode shapes. The software also allows for further analysis and visualization of the results, such as modal parameter extraction and modal analysis. The use of a 8-channel FFT analyzer and the DEWEsoftX software allows for the simultaneous acquisition of data from multiple points on the structure, making it possible to perform a comprehensive modal analysis of the system. The use of a triaxial accelerometer, in combination with the 4-channel FFT analyzer and software, enables the measurement of 3D motion at each test point, providing a more complete understanding of the structure's dynamic behavior.
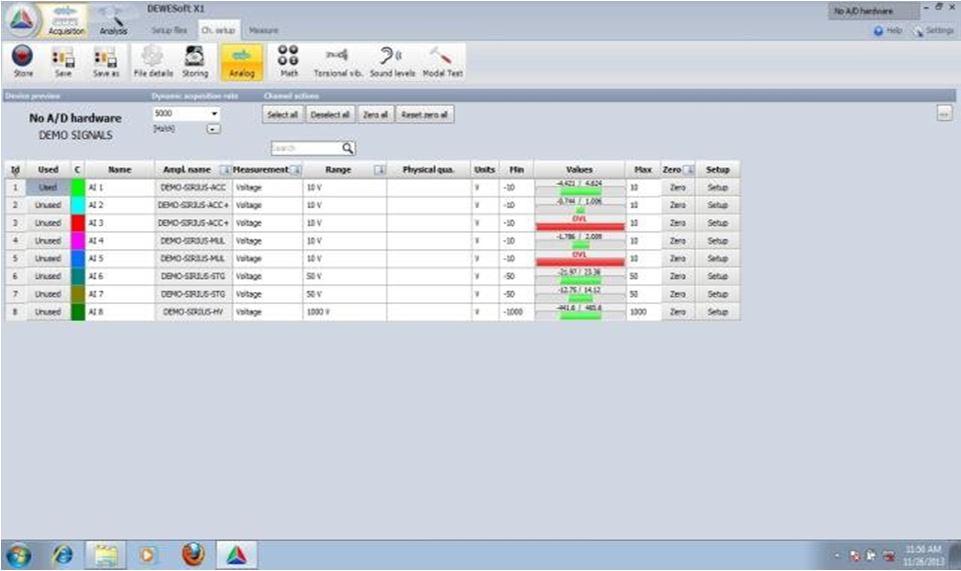
When the DEWEsoftX software is started, a window will open where the user can set up the channels. The channels that are connected to the FFT hardware through the adapters are marked as used in the channel setup. This allows the software to recognize which channels are being used for data acquisition, and to process the data accordingly. In this window, the user can also set the measurement parameters such as sampling rate, frequency range, and windowing function. This ensures that the data acquired is accurate and relevant for the analysis being performed.
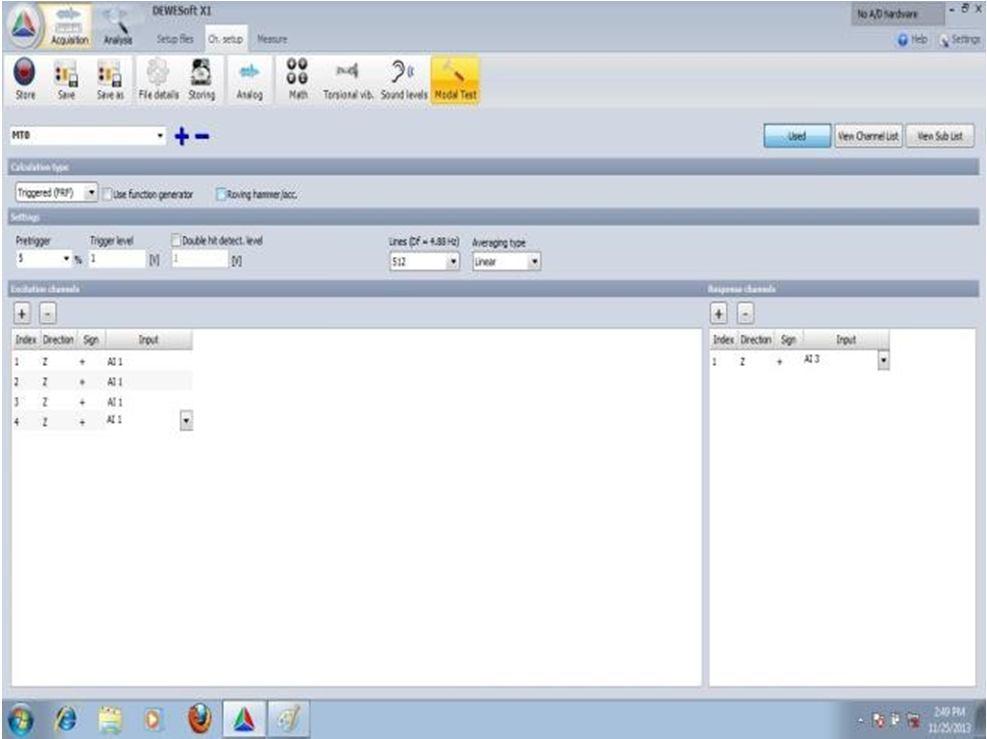
Once the channel setup is completed, the user can proceed to perform a modal test. In the modal test, the option Triggered (FRF) is selected. This option is used to acquire frequency response functions (FRFs) between the fixed position of the accelerometer and different impact positions of the impact hammer. The user can select the frequency range and number of averages for the measurement. The software will then acquire the data and process it to obtain the FRFs. These FRFs can be used to determine the natural frequencies, damping ratios, and mode shapes of the structure under test. The user can also view the time-domain signals and frequency spectra of the acquired data to check for any noise or other issues that may affect the accuracy of the results.
ISSN: 2321-9653; IC Value: 45.98; SJ Impact Factor: 7.538
Volume 11 Issue II Feb 2023- Available at www.ijraset.com
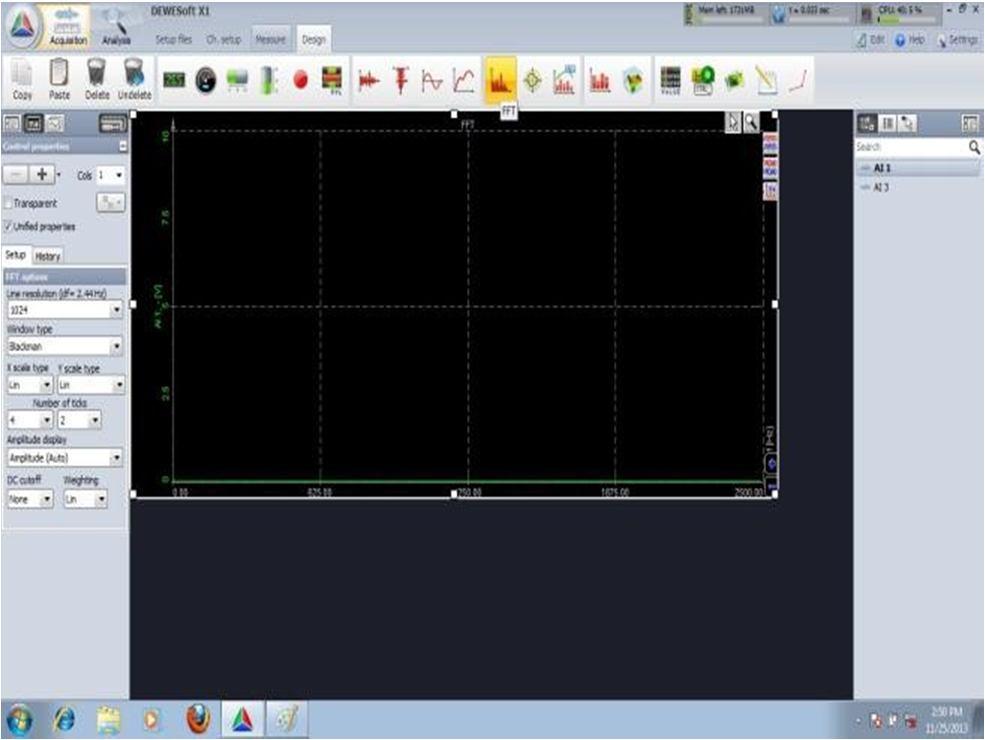
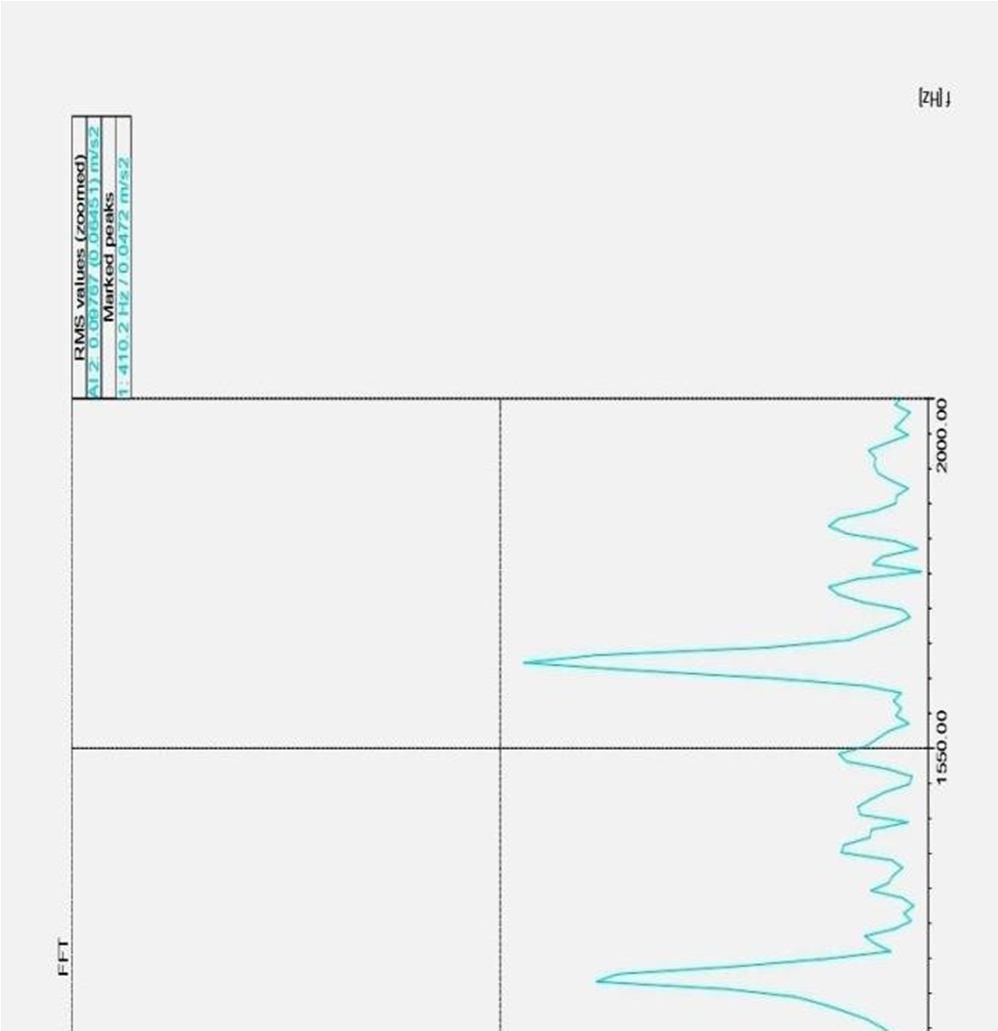
After setting up the design, the next step is to measure the frequency and store the results for further analysis. Once the measurements are complete, the results are exported for further analysis.
ISSN: 2321-9653; IC Value: 45.98; SJ Impact Factor: 7.538
Volume 11 Issue II Feb 2023- Available at www.ijraset.com
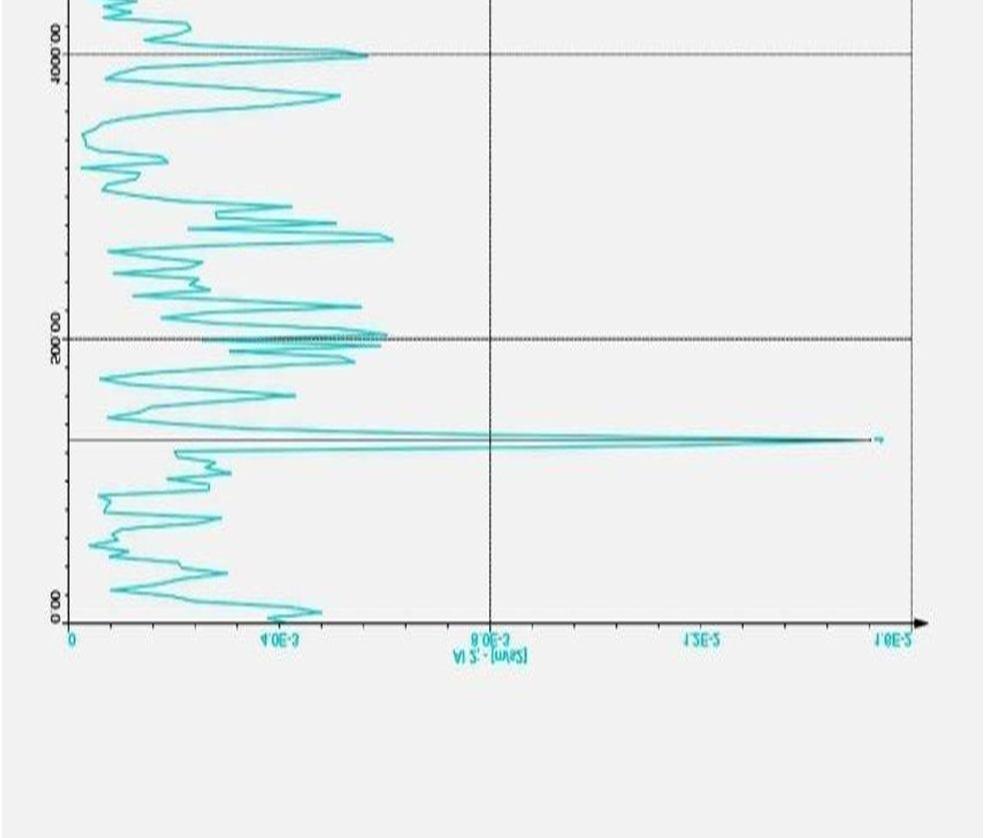
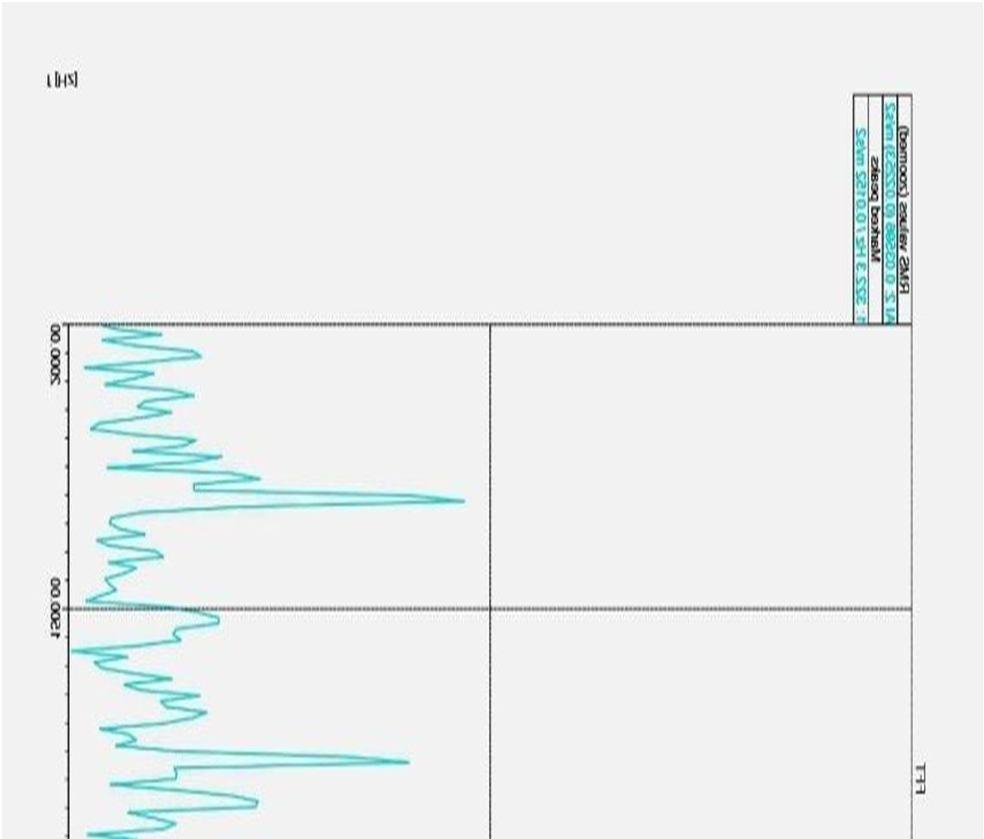
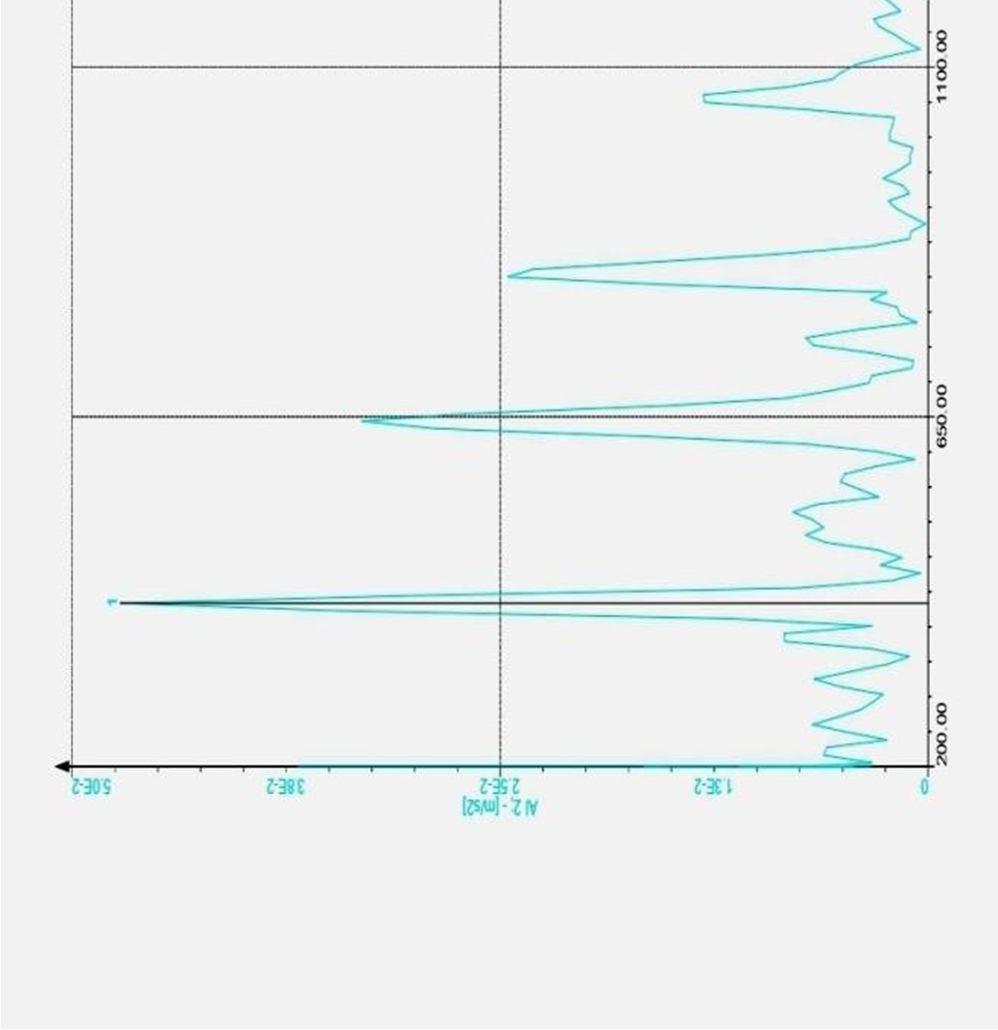
The following graphs show the Modes of the frequencyofTie rod ofall the two materials.
ISSN: 2321-9653; IC Value: 45.98; SJ Impact Factor: 7.538
Volume 11 Issue II Feb 2023- Available at www.ijraset.com
In FEA, a virtual model of the physical system is created using computer-aided design (CAD) software. The model is then divided into small finite elements that are connected at nodal points. The properties of the material and boundary conditions are applied to the model and a mathematical representation of the system is created. This representation is then solved using specialized software, which generates a variety of results such as stress, displacement, and temperature. These results can then be studied and analyzed to determine the behavior of the system under different conditions and to identify potential areas of improvement. FEA allows for a detailed and accurate analysis of complex systems, reducing the need for physical testing and allowing for the optimization of designs before the physical prototype is built.
A. FEA of Tie Rods
The analysis results show that the natural frequency of the tie rod is affected by the material used. The natural frequency of the cast iron tie rod is higher than that of the aluminum tie rod. This is due to the higher density and stiffness of the cast iron material. The results of the analysis can be used to determine the best material for the tie rod based on the required natural frequency and weight considerations. The FEA method provides an efficient and accurate way to predict the dynamic behavior of the tie rod, and can be used as a design tool in the development of automotive components.
Thedifferent materials areas follow:-
1) Cast Iron
2)
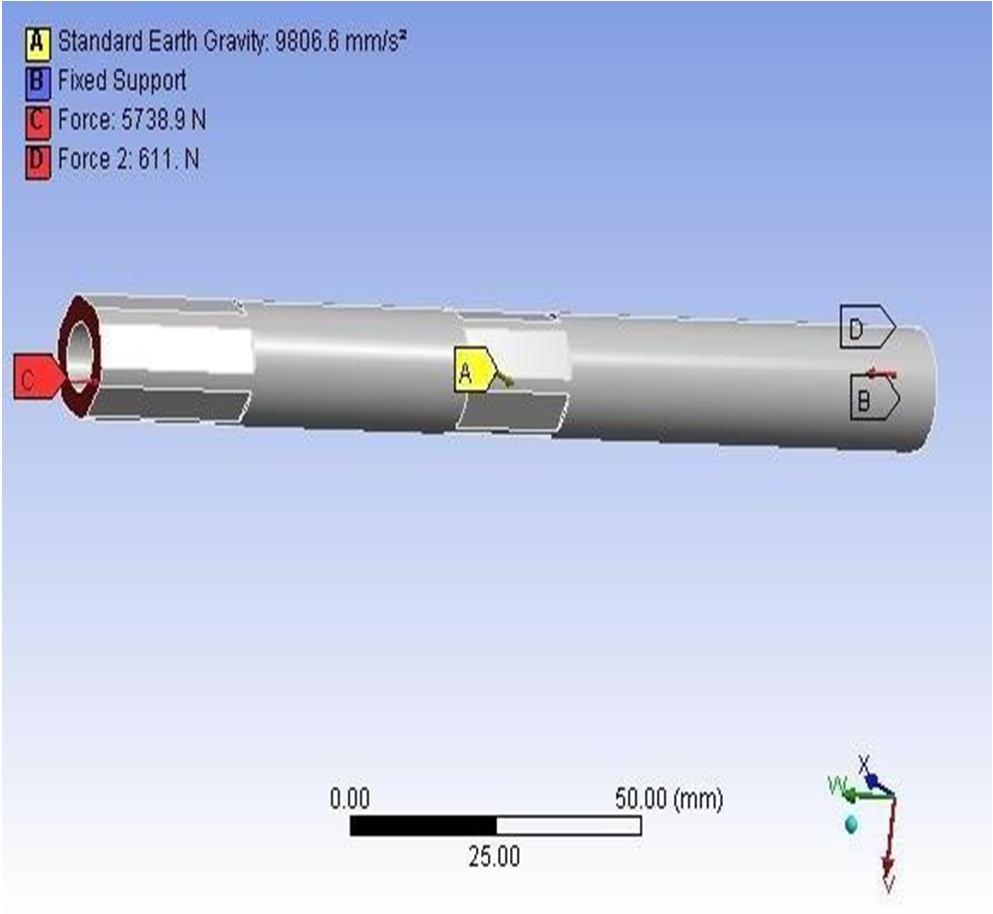
The tie rod consists of circular rod with two ends. The tie rod is secured at both ends. The load on tie rod is compressive. From one end its 5738.9 N and from other end its 611.70 N. There is also self-weight of 1.354 kg.
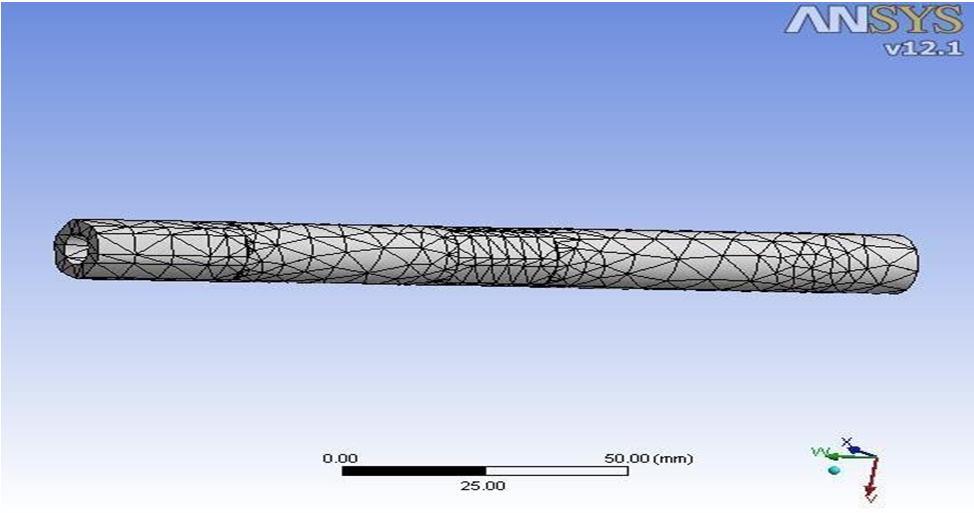
B. Meshing
The FEA analysis of the tie rod is performed by applying a compressive load on one end and a tensile load on the other end. The load is applied in such a way that it simulates the actual loading conditions of the tie rod in the vehicle. The boundary conditions are defined such that the tie rod is fixed at both ends, and the load is applied in the axial direction. The FEA model is then solved using the "3-D" 10 Nodes Tetrahedral Structural Solid element, which is well-suited for irregular meshing models. The element has the capability to simulate deformations of nearly incompressible elastoplastic materials, and it can also account for hyper elasticity, creep, plasticity, large deflection, stress stiffening, and large strain. The results of the analysis are then post-processed to determine the natural frequencies, deformation, and stresses in the tie rod.
ISSN: 2321-9653; IC Value: 45.98; SJ Impact Factor: 7.538
Volume 11 Issue II Feb 2023- Available at www.ijraset.com
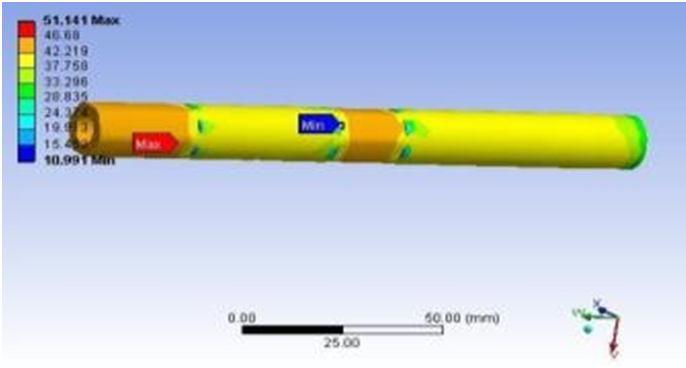
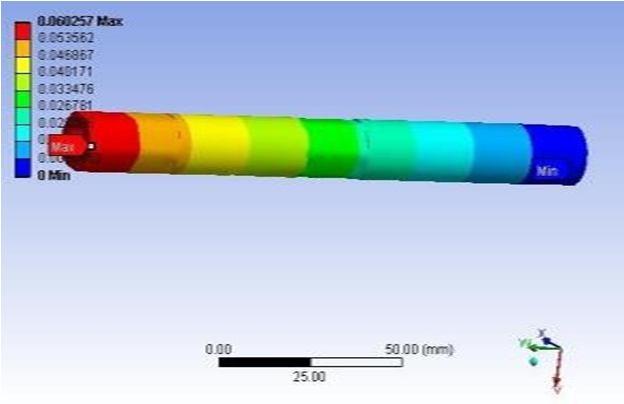
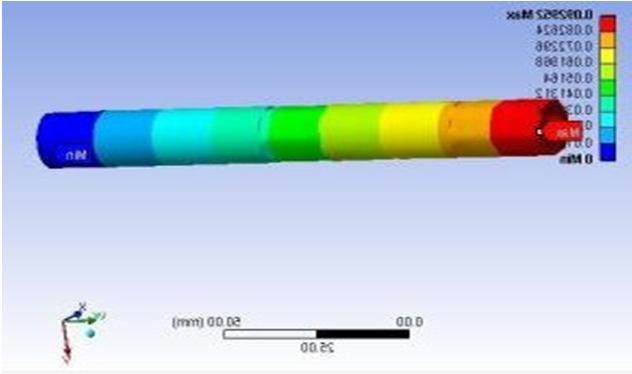
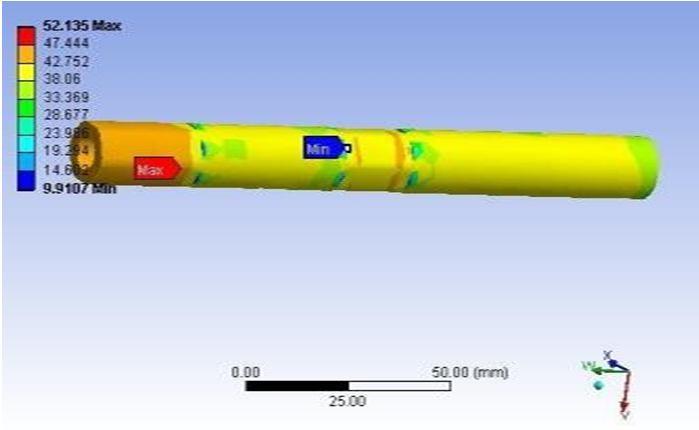
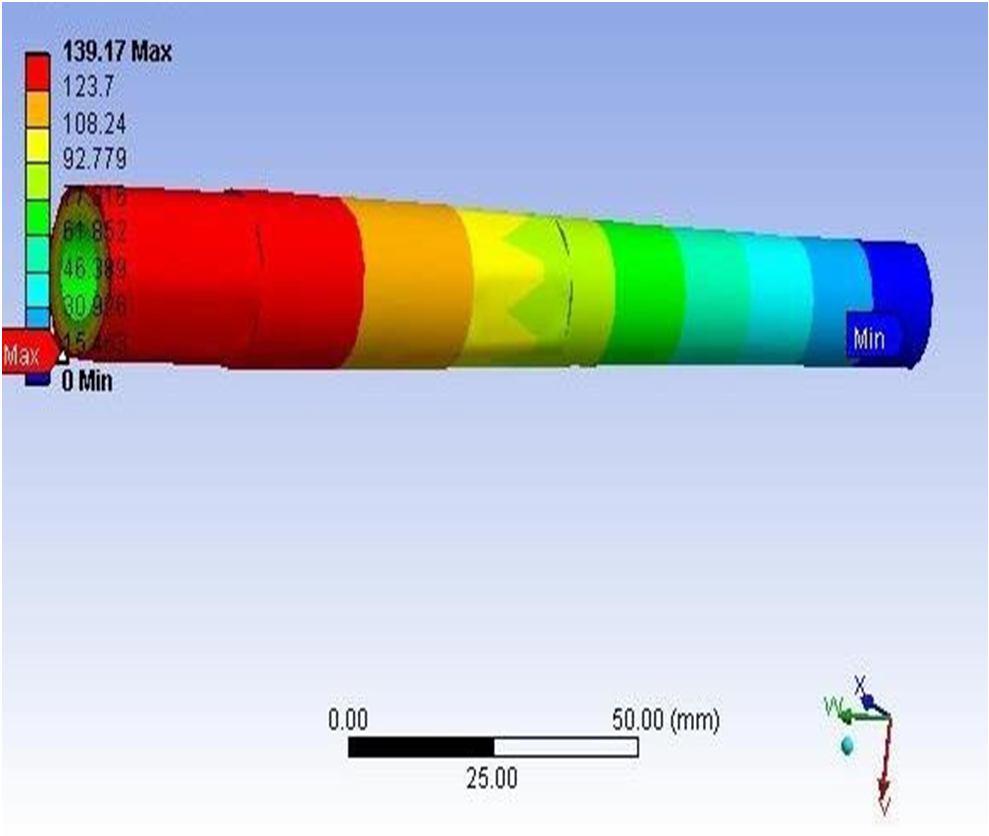
The maximum stress of the value 52.135 MPa and 51.141 MPa & deformation is 0.060257 mm and 0.092952 mm respectively is found out at the Tie rod respectively. The results indicate that the concentration of load occurs at the fixed points due to the tie rod moment and conditions. The deformation plot shows the difference in values between the fixed side and the other side of the tie rod, with the lowest deformation at the fixed side and the highest deformation on the other side.
ISSN: 2321-9653; IC Value: 45.98; SJ Impact Factor: 7.538
Volume 11 Issue II Feb 2023- Available at www.ijraset.com
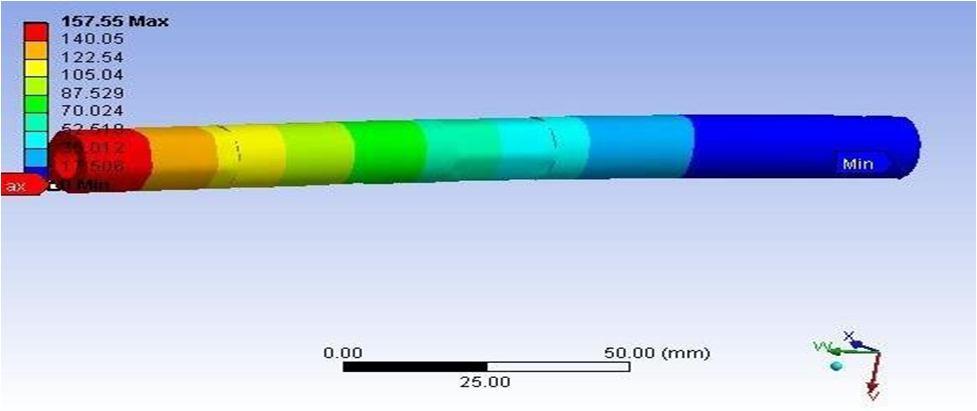
The above plot of tie rod deformation shows that severe distortion occurs at the end fragment that is attached to the vehicle's steering knuckle. The severe deformation value is indicated on the tie rod's end side. On the other hand, little deformation happened at the fixed end, which is simply attached to the vehicle end. The distortion arises from the fixed end to the opposite side at regular intervals. The vibration frequency of a certain Tie rod mode is 333.99 Hz.
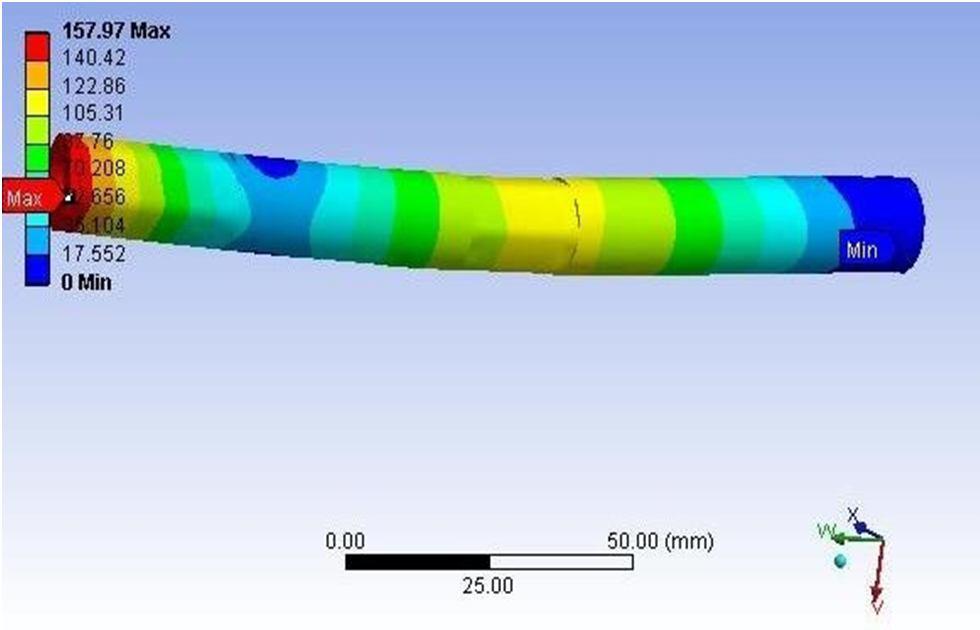
From the above plot of we can state that at the steering knuckle side tie rod possess maximum value of deformation. The reason behind this is the vibration acts on this particular tie rod part. On the other hand atbody side end we obtained zero for few part of it. The vibration frequency for this specific mode of the Tie rodis334.1Hz.
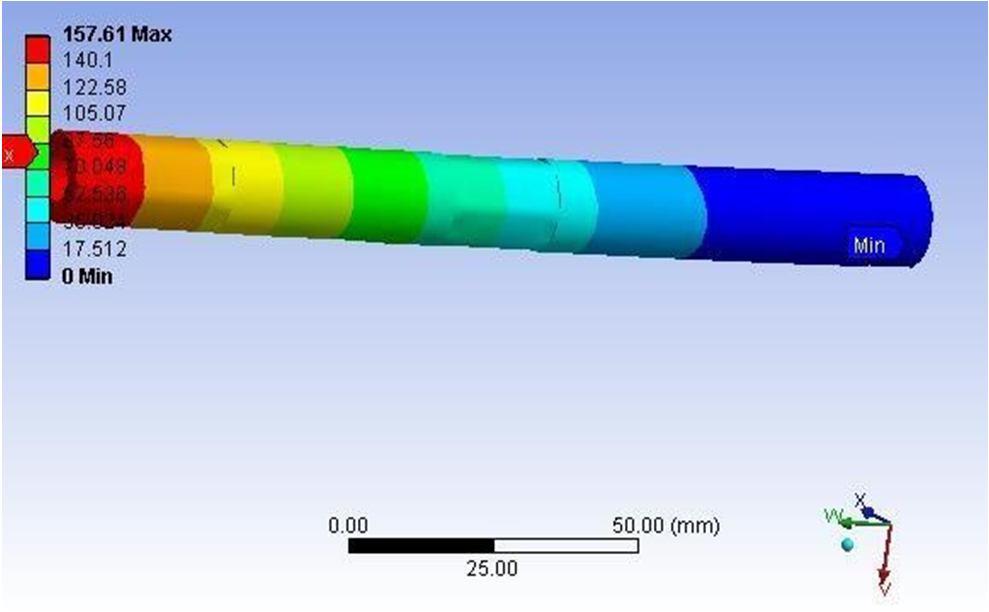
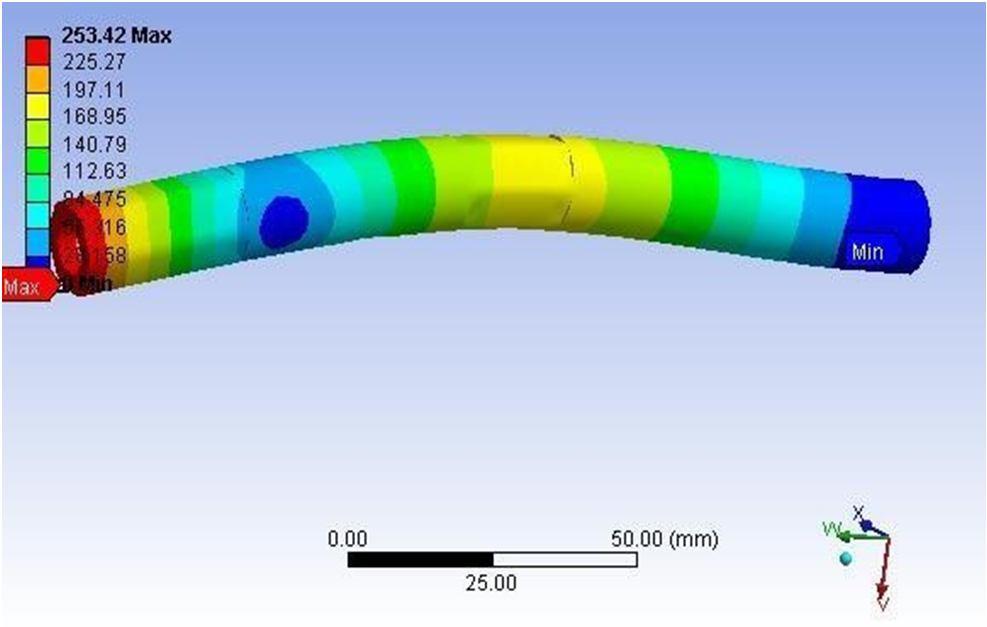
The third vibration mode of the Tie rod is seen in the plot above for modal analysis. The higher deformation value is at the Tie rod end. The vibration frequency for this specific mode is 2112.9 Hz.
ISSN: 2321-9653; IC Value: 45.98; SJ Impact Factor: 7.538
Volume 11 Issue II Feb 2023- Available at www.ijraset.com
Additionally, it can be seen that the deformation is more concentrated on the end of the tie rod that is connected to the steering knuckle, and less at the end that is connected to the vehicle body. This is likely due to the load and vibration being applied at the steering knuckle end. The frequency of vibration for this mode is higher than the previous modes, which could indicate a higher level of stress and potential for failure in this area. Overall, the modal analysis provides important information on the vibration characteristics and potential failure points of the tie rod, which can be used to improve its design and performance. The vibration frequencyforthisspecificmodeis2113.7Hz.
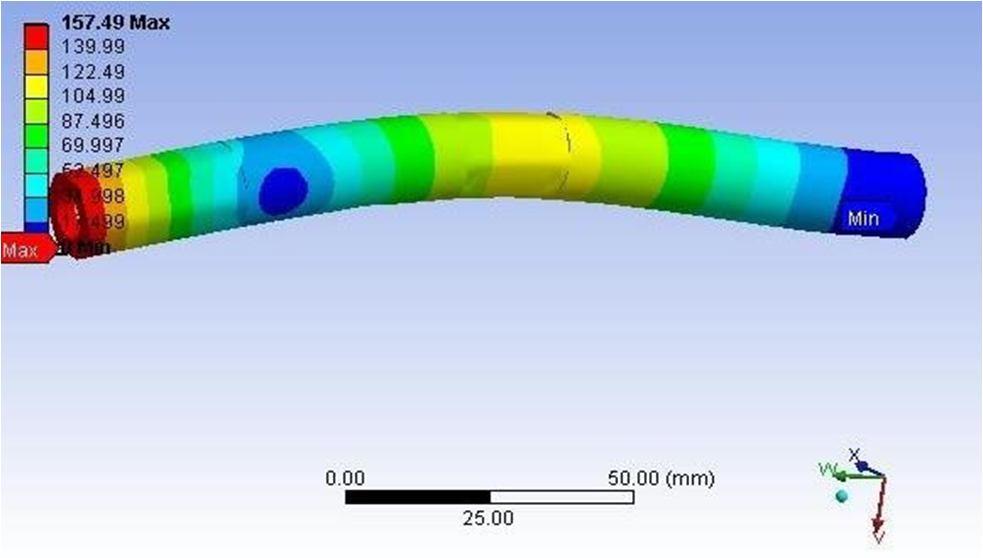
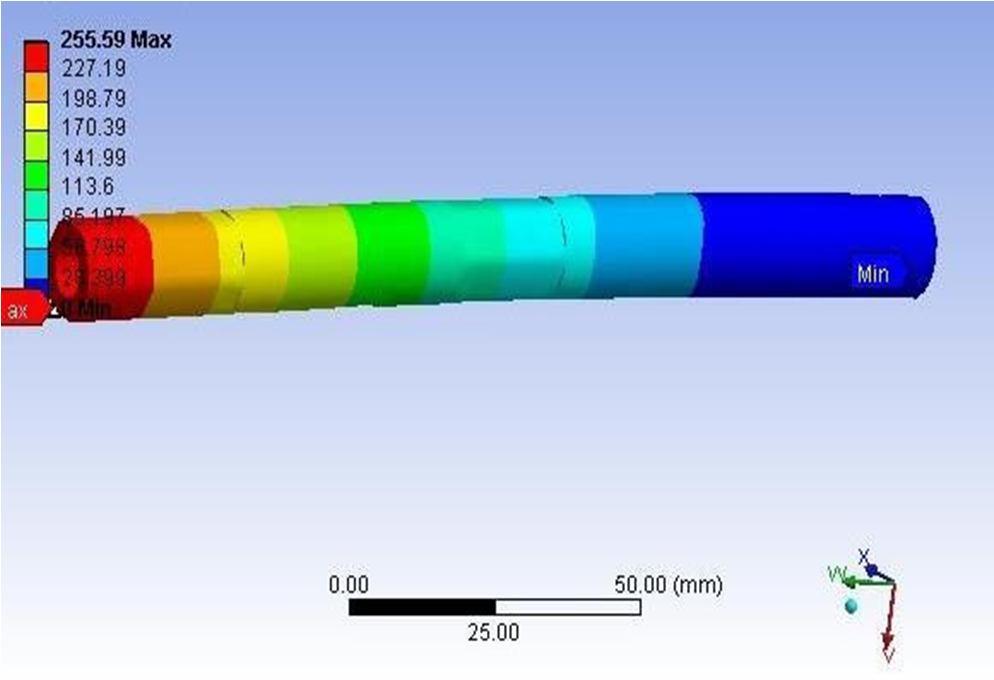
As seen from the above the deformation values are lowest at the end connected to structure of vehicle and on the other hand highest on the tie rod end. The maximum value of deformation is seen at the end of therod. The vibration frequency for this specific mode is 3780.9Hz.
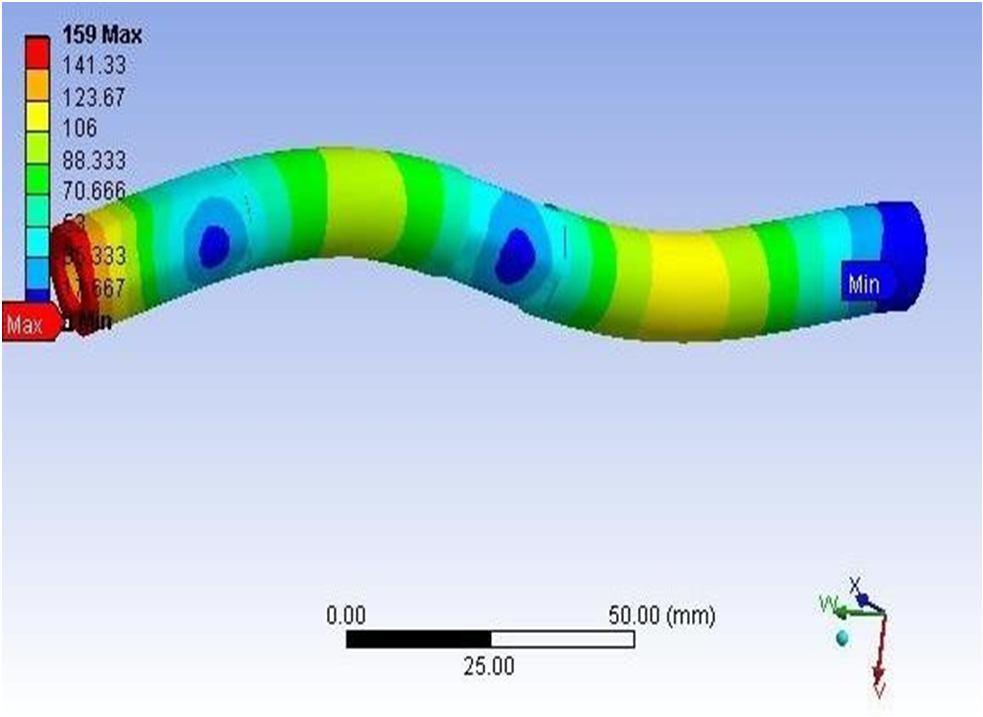
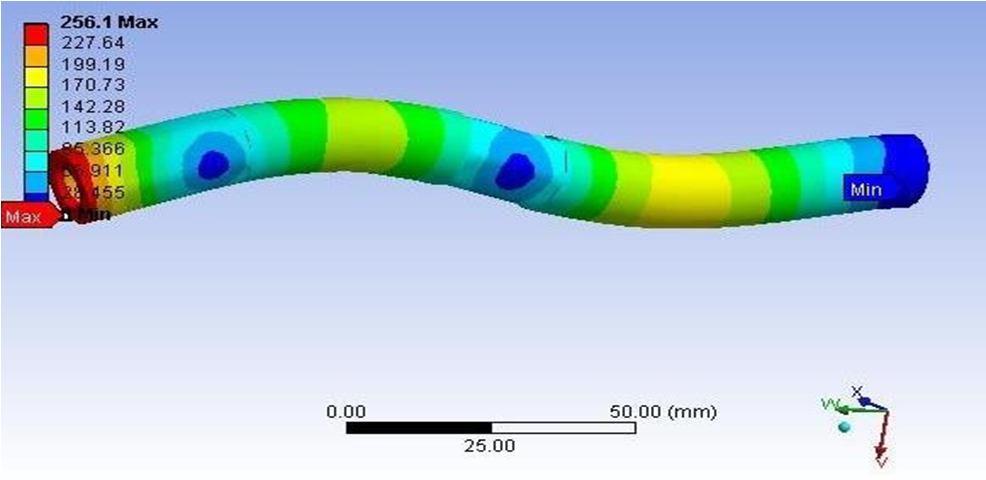
The maximum deformation values occur at the end of the tie rod connected to the steering knuckle, as seen from the results obtained from the modal analysis. The vibration frequencies for the different modes of vibration also vary, with the highest frequency being 5584.6 Hz. This information can be used to improve the design of the tie rod to reduce deformation and vibration, and ensure the structural integrity of the component.
ISSN: 2321-9653; IC Value: 45.98; SJ Impact Factor: 7.538
Volume 11 Issue II Feb 2023- Available at www.ijraset.com
From the above plot of the total deformation of the tie rod, we can conclude that the maximum value of deformation is taking place at the end of the tie rod connected to the steering knuckle. The frequency of vibration for this particular mode is 405.2 Hz. This is due to the load concentration at the end of the tie rod and the vibration acting on this specific part of the tie rod.

From the above plot (5.6.1b (ii)) of the total deformation of the tie, we can state that at the steering knuckle side tie rod possess the maximum value of deformation. The reason behind this is the vibration acts on this particular tie rod part. On the other hand at body side end we obtained zero for a few parts of it. The vibration frequency for this specific mode of the Tie rodis 405.49 Hz.
ISSN: 2321-9653; IC Value: 45.98; SJ Impact Factor: 7.538
Volume 11 Issue II Feb 2023- Available at www.ijraset.com
From the above plot of the total deformation of the Tie rod, we can conclude that the maximum value of deformation is taking place at the end of the rod connected to the steering knuckle. The vibration frequency for this specific mode of vibration is 2710.9 Hz. It can also be observed that the deformed part deforms less at the end connected to the vehicle structure compared to the end connected to the steering knuckle

From the above plot of the total deformati00on of the Tie rod we can state that atthe steering knuckle side tie rod possess maximum value of deformation. The vibration frequency for this particular mode is 2712.8 Hz.
As seen from the above the deformation values are lowest at the end connected to structure of vehicle and on the other hand highest on the tie rod end. The maximum value of deformation is seen at the end of therod. The vibration frequency for this specific mode is 4804.1Hz.
We may deduce from the above plot of the overall deformation of the Tie rod that the largest value deformation occurs at the centre side of the Tie rod connected to the steering knuckle. This mode of vibration has a frequency of vibration of 7203.5 Hz.

ISSN: 2321-9653; IC Value: 45.98; SJ Impact Factor: 7.538
Volume 11 Issue II Feb 2023- Available at www.ijraset.com
The usage of lightweight materials in vehicles is the primary emphasis of automotive manufacturers, hence new materials must be introduced in automobile makers. According to some research, every 10% reduction in vehicle weight results in a 4.5 to 6% increase in fuel economy. When compared to cast iron, the standard aluminium cast tie rod is lighter.
Table
Comparison of Natural Frequency between FEA and Experimental Analysis Results
As can be observed from the above data, the values of frequencies for all materials utilising FEA and experimental testing are almost identical. The variance is around 0.96% for cast iron and 0.98% for aluminium, both of which are acceptable.
Finally, the results of the tie rod experimental analysis and FEA show that the use of aluminium material can be an effective replacement for cast iron. The aluminium tie rod's natural frequency is found to be higher than that of the cast iron, and its weight is optimised to be 2.66 times less than that of the cast iron. With a deviation of 0.96% for cast iron and 0.98% for aluminium, the deviation between experimental and FEA results is found to be acceptable. This indicates that the FEA method is accurate and userfriendly, making it the best method for analysing tie rod vibration characteristics and natural frequencies.
The authors would like to express their gratitude to the Sinhgad Institute for providing a continual source of inspiration as well as access to the lab and workshop.
[1] Patil, Manik A., D. Chavan, and M. K. U. S. Ghorpade. "FEA of tie rod of steering system of car." International Journal of Application or Innovation Engineering and Management 2.5 (2013): 222-227.
[2] Duan, Wei, and Suraj Joshi. "Failure analysis of threaded connections in large-scale steel tie rods." Engineering failure analysis 18.8 (2011): 2008-2018.
[3] Falah, A. H., M. A. Alfares, and A. H. Elkholy. "Failure investigation of a tie rod end of an automobile steering system." Engineering Failure Analysis 14.5 (2007): 895-902.
[4] Lagomarsino, Sergio, and Chiara Calderini. "The dynamical identification of the tensile force in ancient tie-rods." Engineering Structures 27.6 (2005): 846-856.
[5] Ghorpade, Umesh S., et al. "Finite element analysis and natural frequency optimization of engine bracket." International journal of mechanical and industrial engineering (IJMIE) 2.3 (2012): 1-6.
[6] Kaiser, Michael Adam. Advancements in the split Hopkinson bar test. Diss. Virginia Tech, 1998.