
10 X October 2022 https://doi.org/10.22214/ijraset.2022.47196
ISSN: 2321 9653; IC Value: 45.98; SJ Impact Factor: 7.538 Volume 10 Issue X Oct 2022 Available at www.ijraset.com

ISSN: 2321 9653; IC Value: 45.98; SJ Impact Factor: 7.538 Volume 10 Issue X Oct 2022 Available at www.ijraset.com
P. Srinivasan1, S. Hariharan2, P. Manikandan3, S. NaveenKumar4, N. Harish5, G. Balasubramanian6 1, 2, 3, 4Assistant Professor, 5, 6Under Graduate Student, Department of Mechanical Engineering, VSB College of Engineering and Technical Campus Coimbatore, Tamilnadu, India. 642109.

Abstract: This study aims to examine the shrinkage flaw in grey cast iron. The poor gating system design, improper composition management, and solid sections with a high modulus (Volume/ Surface area) in the casting are the root causes of the shrinkage fault. The gating mechanism can first be redesigned in order to lessen shrinkage. A new gating system with a different chemical makeup is suggested. Grey cast iron's composition changed due to an increase in carbon content. Thus, proCAST is used to develop and analyze the gating system. Implementing the planned gating system in the foundry served to validate the results. It is accomplished to increase the effective yield.
Keywords: Shrinkage Grey cast iron, Casting Yield, Gating Mechanism, Slag inclusion, proCAST, Casting Materials, Material Properties.
In the manufacturing process known as casting, a liquid substance is often poured into a mold that has a hollow hole that is the desired shape, and the mixture is then left to solidify. Castings are the solidified component that is ejected or broken out of the mold to complete the process. Casting materials often consist of metals or different types of cold setting substances that firm up after being mixed with two or more other substances; examples include epoxy, plaster, and clay. Casting is most frequently used to create intricate shapes that would be challenging or expensive to create using other techniques. The flow chart explains the process of the casting process. An under irregularity in the metal casting process is referred to as a casting fault. Some flaws can be overlooked, while others can be fixed; if not, they must be removed. They are divided into five primary groups: flaws related to gas porosity, shrinkage and mold materials, pouring metal, and metallurgical processes. The failure of the mold can result in a number of issues with sand casting. The mold typically fails for one of two reasons: either the incorrect materials are utilized, or it is rammed incorrectly. Shrinkage flaws, which fall under the category of internal defects, account for almost 60% of all faults in this study. Macro Porosity Shrinkage and Micro PorosityShrinkage are two terms used to loosely classify shrinkages in castings based on their size. Macro porosity typically occurs in isolated hot places, and its typical locations are the center of thick sections, junctions, corners, and spaces between two or more cores. It manifests as a region with numerous shrinkage holes or a single cavity with a rough surface. Micro Porosity is typically only discovered during machining and shows as tiny holes in the rough surface. The macro porosity shrinking is concentrated in this research.
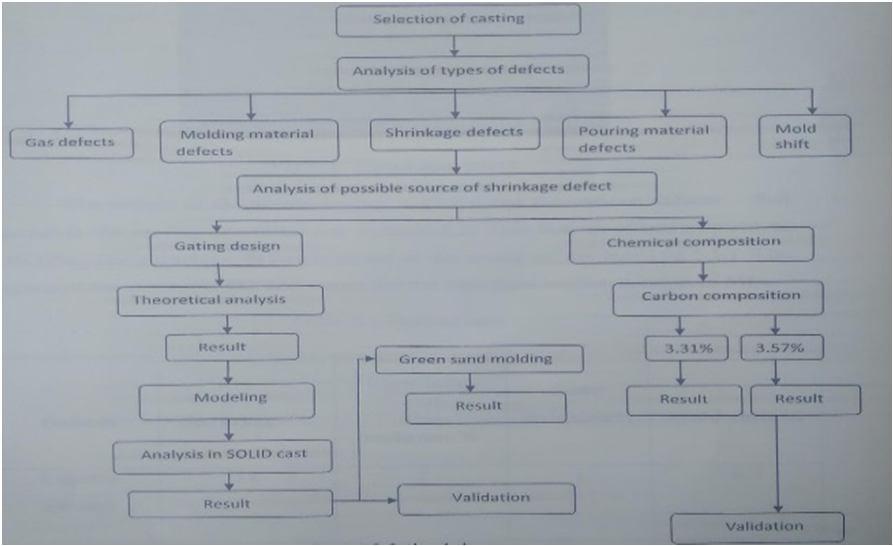
The figure shows the methodology for the research work. Initially, the material grey cast iron is selected for material and it is analyzed what kind of defects to be created. Particularly shrinkage defects and analysis of possible shrinkage defects, gating system, and chemical composition of the material.

Fig 1: Methodology of Shrinkage Casting
ISSN: 2321 9653; IC Value: 45.98; SJ Impact Factor: 7.538 Volume 10 Issue X Oct 2022 Available at www.ijraset.com
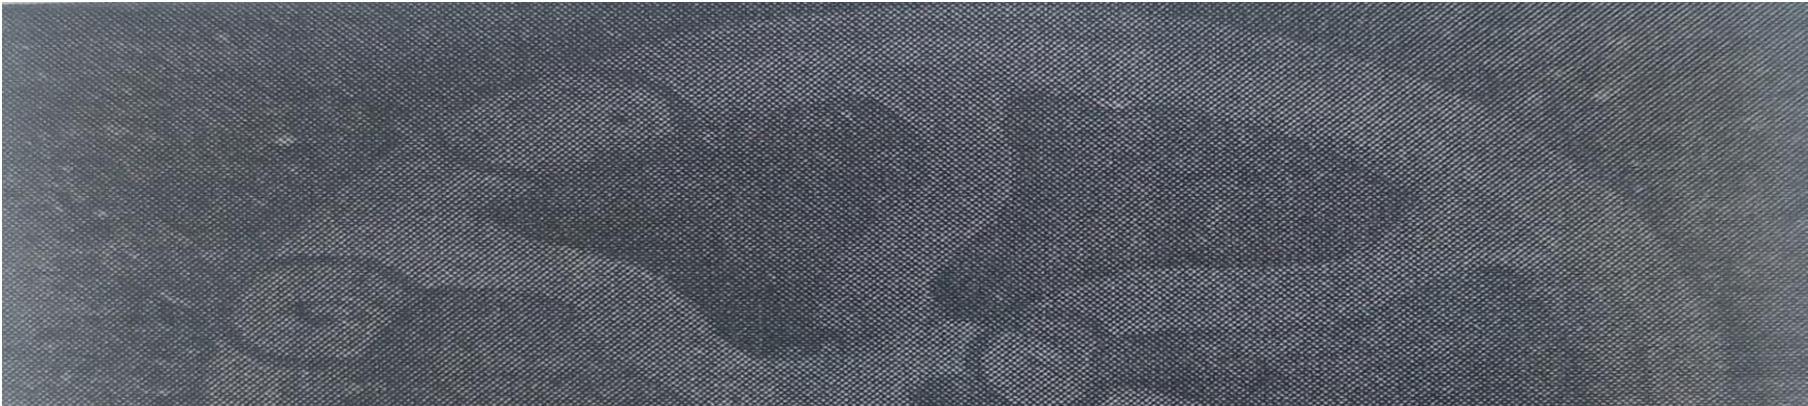
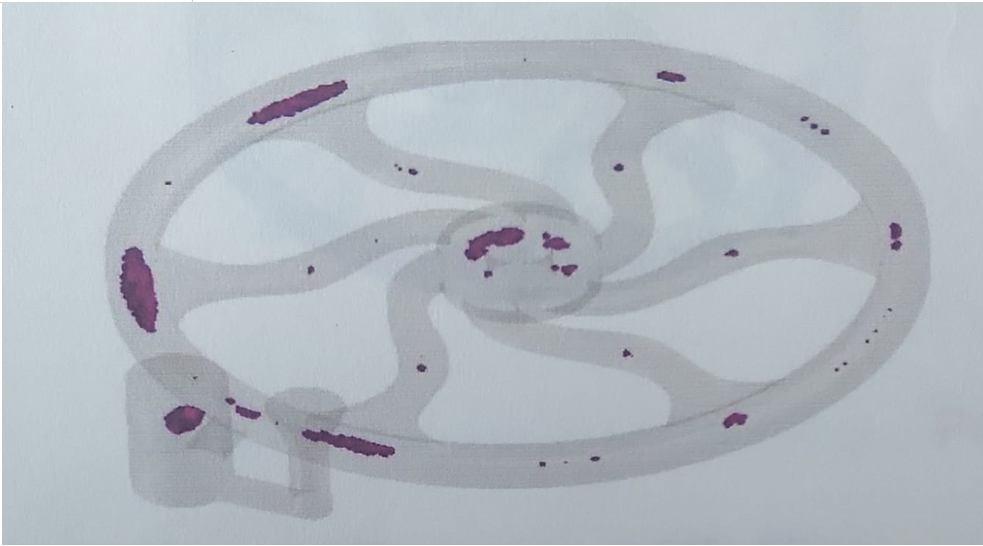
The weight of the above casting is 25 Kg and various defects that occur in the casting are listed in the table1. This has been an effective yield of 46.12%. The shrinkage defects are found at the center of the hub shown in figure2.
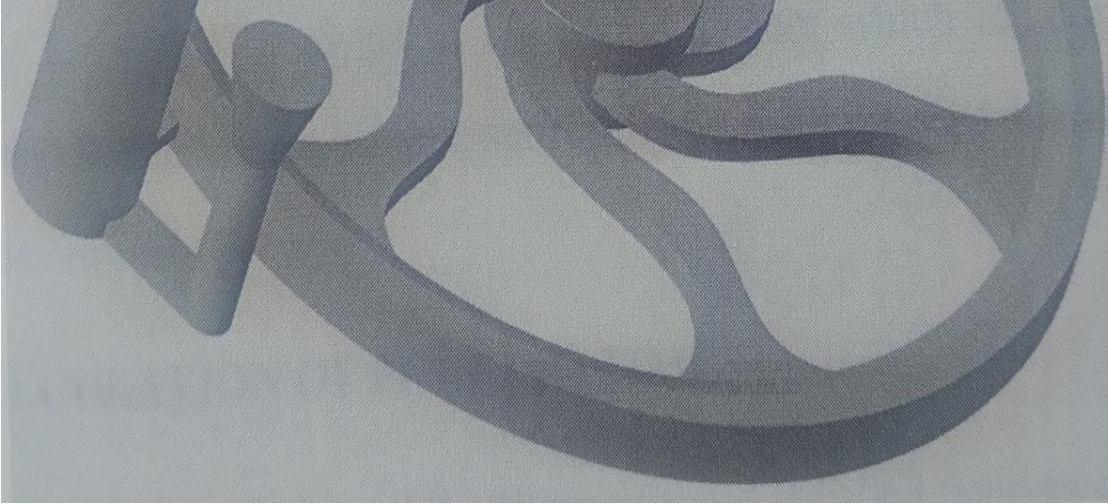

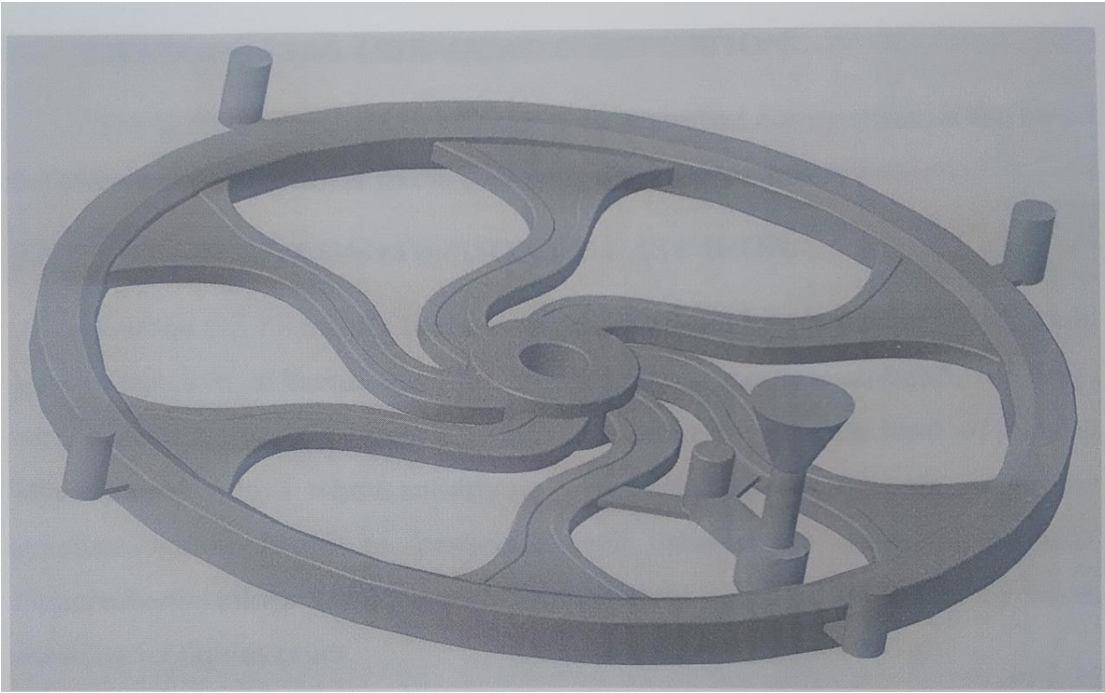
The casting's pouring weight is 35.4 kg, and its casting yield is 60%. The casting's gate weight is 10.4 kg. The casting's pouring temperature is 13400 c. This case can be poured in 10 seconds for each mold and gating system. The utilized existing gating system is displayed in the Cad model (figure 3).
ISSN: 2321 9653; IC Value: 45.98; SJ Impact Factor: 7.538
Volume 10 Issue X Oct 2022 Available at www.ijraset.com
Pouring basin diameter(mm) 60
Pouring basin depth(mm) 50
Spure diameter(mm) 30 Spure length(mm) 100
Runner(mm) 30×10
Ingate(mm) 30×10
Number of runners 1
Number of in gate 1
Raiser diameter(mm) 75
Riser head(mm) 150
Spure well diameter(mm)
Table2: Existing Gating System Properties
The new design is created after conducting a theoretical analysis of the gating system, which includes the pouring time, pouring basin, in the gate, runner, spure well, and rising. Pouring time is the length of time needed to completely fill the mold. Sand inclusion occurs when the pouring temperature is low because of the significant turbulence.
Pouring time = (141+ /1459)⎷ Seconds
Where K= fluid of iron/ 1016 mm
T= Average section thickness in mm W= Casting weight of casting in Kg
Substitute the values K= 39/40 inch calculated for the pouring temperature of 13800c and carbon equivalence of 4, from measurements, for the selected casting T= 30 mm, W= 23 Kg, t= 10s
The calculation of choke area is the smallest area in the gating system which controls the flow rate of molten metal. Choke area, A= W/ ρtc⎷2gh
Where A= Choke area, mm2, W= casting weight of the casting Kg, t= Pouring time S, ρ= mass density of the molten metal, Kg/ mm2, g= acceleration due to gravity, m/s2, H= effective metal head (Spure height), mm C= efficiency factor which is a function of the gating system used W= 23 Kg, ρ= 7.17×10 6, Kg/mm3, t= 10s, C=0.73, g= 9.81 m/s2
To find the effective metal head H=h (z2 2u) where, H= height of the spure, mm Z= height of the mold cavity in cope, mm u= total height of the mold cavity, mm h= 120mm, p=30mm, c=65mm Choke area A= 295.26
The calculation of spure diameter and length Spure diameter, d= (⎷A/π)
Spure length, I= 3×d mm where, A= choke area, A= 295.26 mm2 Spure diameter, d= 20mm, Spure length I= 60mm
The calculation of spure well Spure well diameter = 1 × spure well diameter= 1×20=20mm Spure well depth = 2× spure diameter= 2×20= 40mm Spure Diameter= 20mm, Spure Depth= 40mm
ISSN: 2321 9653; IC Value: 45.98; SJ Impact Factor: 7.538
Volume 10 Issue X Oct 2022 Available at www.ijraset.com
Pouring basin diameter(mm) 60
Pouring basin depth(mm) 50
Spure diameter(mm) 20
Spure length(mm) 60
Runner(mm) 20×20
Ingate (mm) 20×5
Number of runners 1
Number of in gate 25
Raiser diameter(mm) 50
Riser head(mm) 150
Spure well diameter(mm) 20 Spure well depth (mm) 40
During the melting process, the following materials were introduced to the furnace. The amount of low manganese scrap and the desired amount of carbon is used to compute the shell coke. Manganese makes up 0.3% of the low manganese scrap, with iron making up the majority.
SI no. Elements Composition% 1 Carbon 2.5 to 3.5 2 Silicon 2.0 to 3.0 3 Manganese 0.3 max
Table 4: Composition of Pig Iron
Silicon % shown in table 4 is high in many cases. So in order to reduce the silicon content, LMS (Low manganese scrap) has to be added. Table 5 provides information about the higher range composition.
SI no. Elements Composition% 1 Carbon 2.5 to 3.5 2 Silicon 2.0 to 3.0 3 Manganese 0.3 max
Table 5: Higher Range Composition to Reduce the Shrinkage Defect
ISSN: 2321 9653; IC Value: 45.98; SJ Impact Factor: 7.538
Volume 10 Issue X Oct 2022 Available at www.ijraset.com
The higher range composition is achieved in order to reduce the shrinkage defects.
The calculation for the shell coke weight is Shell coke weight = (Aim/ Efficiency) × Liquid = (3.6/55) × 400 = 26.18 Kg
Aim= (Sample Weight Maximum weight) The composition of the metal after the first sample is listed in table 6 after adding the pig iron, shell coke, etc., in the aforesaid sequence and quantity. The details of the first bath during melting are shown in the following table.
SI no.
Elements Composition% 1
Carbon 2.5 to 3.5 2 Silicon 2.0 to 3.0 3 Manganese 0.3 max 4 Chromium 0.10 5 Copper 0.25
Table 6: Composition (1st sample)
From this value in table 6 we have to calculate the amount of pure carbon, silicon and manganese to be added. The weight of the sample is calculated as; = ((Sample weight Maximum Weight)/Efficiency) × Liquid metal After diagnosing it was found that the carbon content has to be increased in order to reduce shrinkage. Therefore the carbon percentage to be achieved = 3.6%
C 3.60= (0.15/55) × 1000 = 2.73 Kg
Si 2.40= (0.4/60) × 1000 = 6.66 Kg
Mn 0.70= (0.24/55) × 1000 = 4.36 Kg
Cr 0.15= (0.05/55) × 1000 = 0.90 Kg
Cu 0.30= (0.05/95) × 1000 = 0.53 Kg
For proper solidification, inoculants should be added. Thus our aim has to be altered by reducing the silicon percentage to 2.20 from 2.4
The calculation for adding inoculants
C 3.60= (0.20/55) × 1000 = 3.64 Kg
Si 2.40= (0.10/60) × 1000 = 1.66 Kg
Mn 0.70= (0.30/55) × 1000 = 5.45 Kg
Cr 0.15= (0.06/55) × 1000 = 1.09 Kg
Cu 0.30= (0.03/95) × 1000 = 0.316 Kg
After adding the above elements in the above quantity the result in the below table 7 obtained
Carbon % 3.31 3.54 3.51 Silicon % 2.20 2.36 2.38 Manganese % 0.63 0.61 0.61 Sulfur % 0.089 0.082 0.081 Phosphorus % 0.047 0.046 0.046 Carbon Equivalence 4.04 4.33 4.34
Following are some explanations of how to use simulation software. Build a model of the casting design, including the gating system and all other components like chills, cores, sleeves, etc. that are used with the castings. A cad system could be used for this stage. Enter the necessary information for the calculation, such as the mold or die's mechanical, thermal, and physical characteristics, the pouring temperature, the duration of the pour, the pressure, etc. Computation of the simulation, in which several programs for casting simulation may take various ways to simulate the outcomes. The numerical simulation approaches (Finite Element and Finite Difference Methods), the geometrical less method approach, and mesh are a few well known methods.
Depending on the criterion employed, such as the temperature in each area of the casting at a given time, solidification times, hot spots, material density, etc., the findings from the simulation program may be displayed as graphs or colourful figures with numerical data. These findings must be transformed into information that may be used to determine if a casting is sound or not, or what needs to be done to enhance the casting design and start over at step one.
The ESI group developed and owns ProCAST, a computer simulation software package for castings. Version 2016 was the one employed in this study. With many different kinds of metal, it may stimulate investment casting, sand casting, and permanent mold casting models. A user can use the program ProCAST to predict casting flaws that could appear as the casting is solidifying. It uses the finite difference method in calculating the thermodynamics of each element in the casting and records the temperature changes. The temperature changes collected will be used in plotting graphs of different criteria for predicting different types of defects in castings. It calculates the thermodynamics of each casting element using the finite differences method and keeps track of temperature fluctuations. The temperature data will be used to create graphs with various criteria for forecasting various casting failure types.
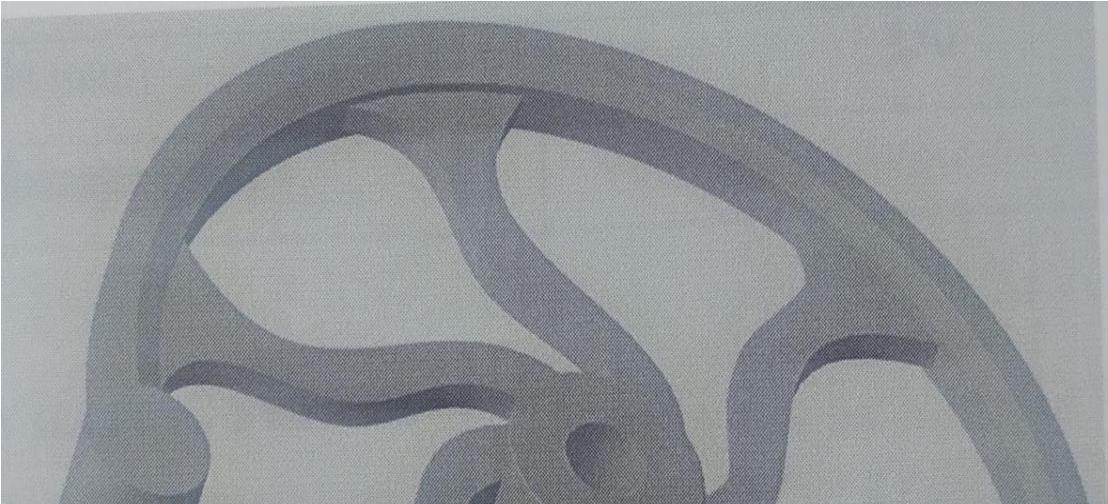
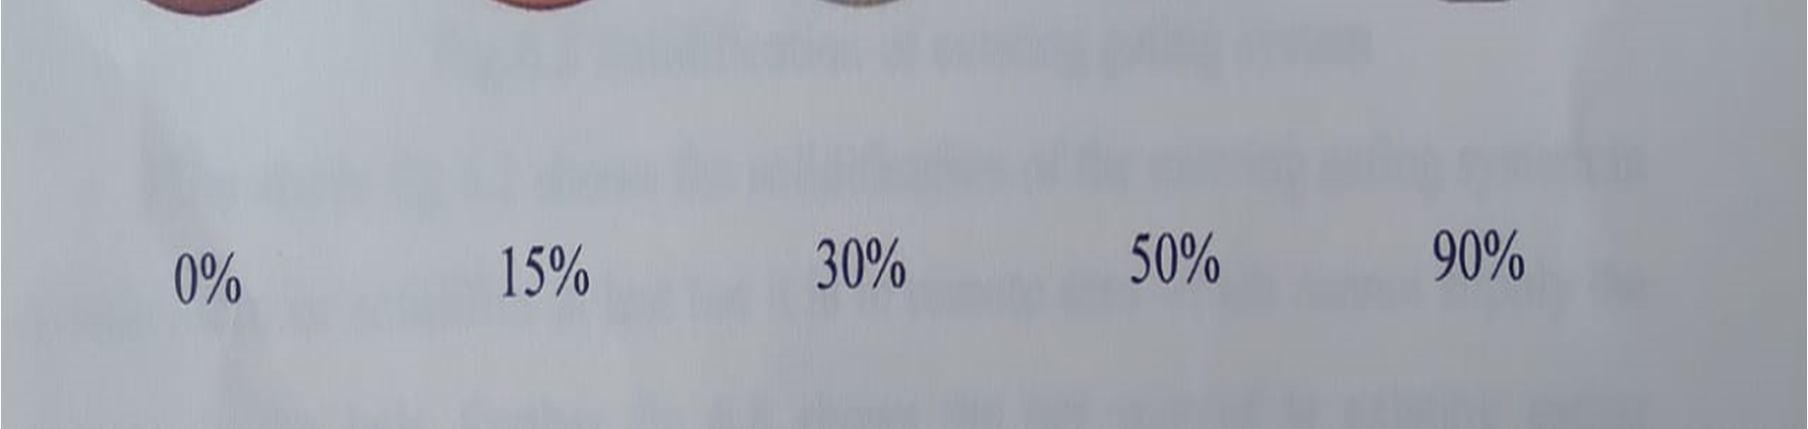
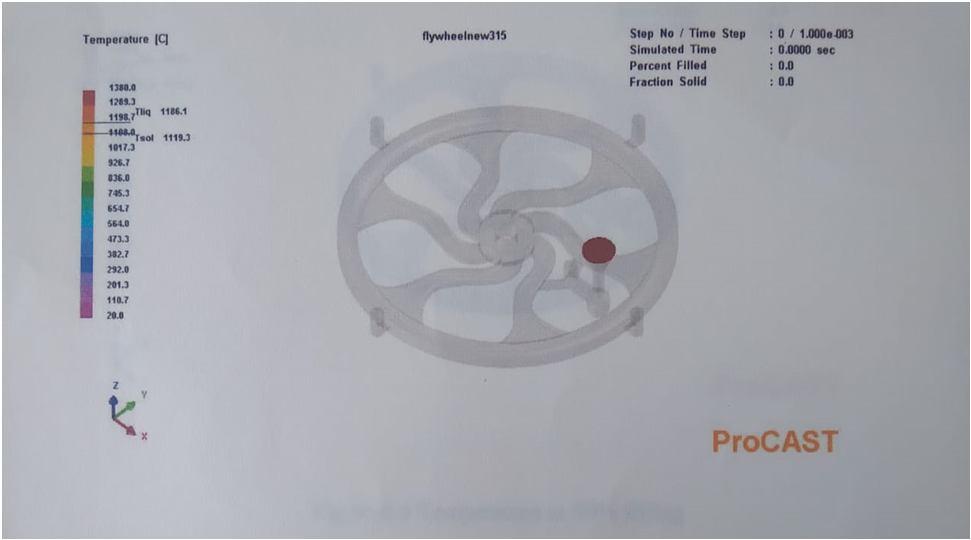
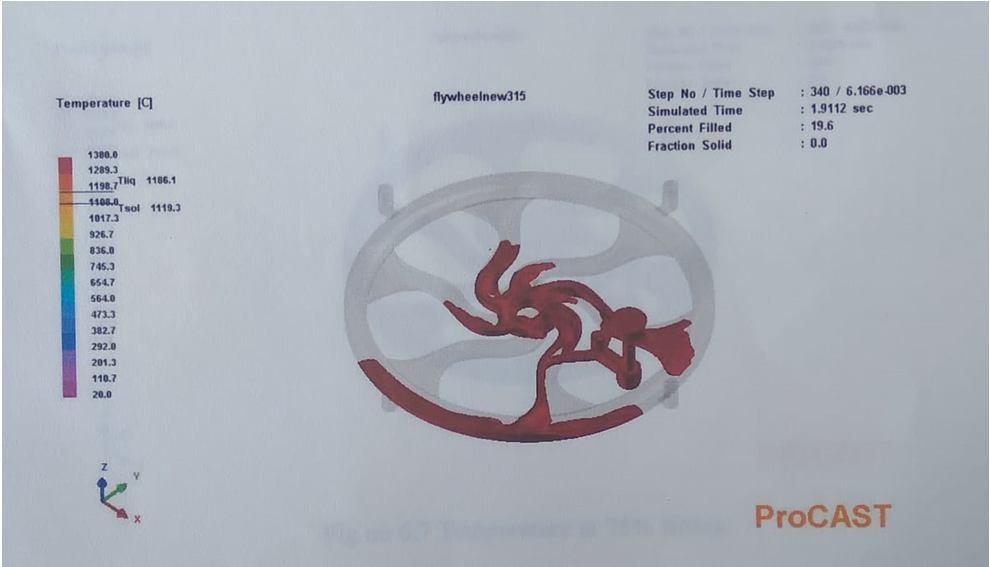
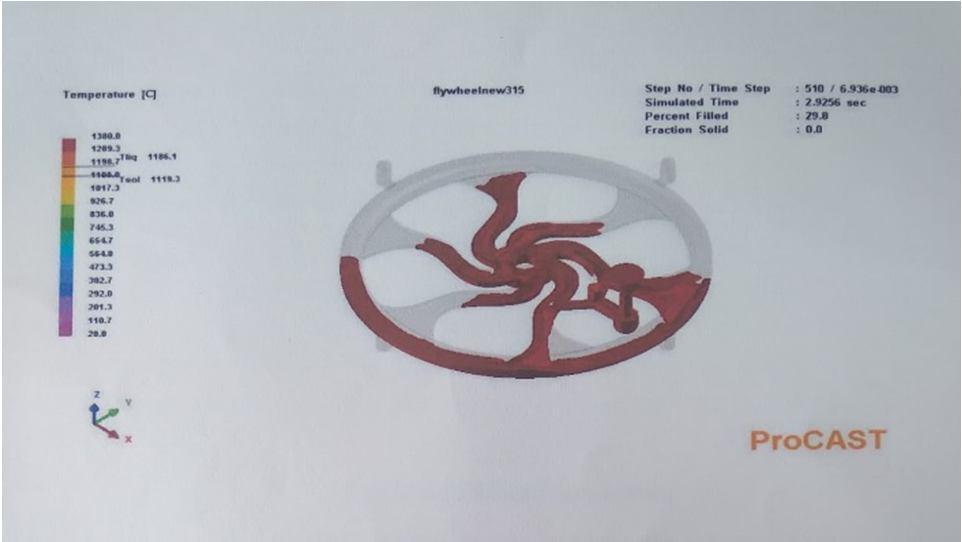
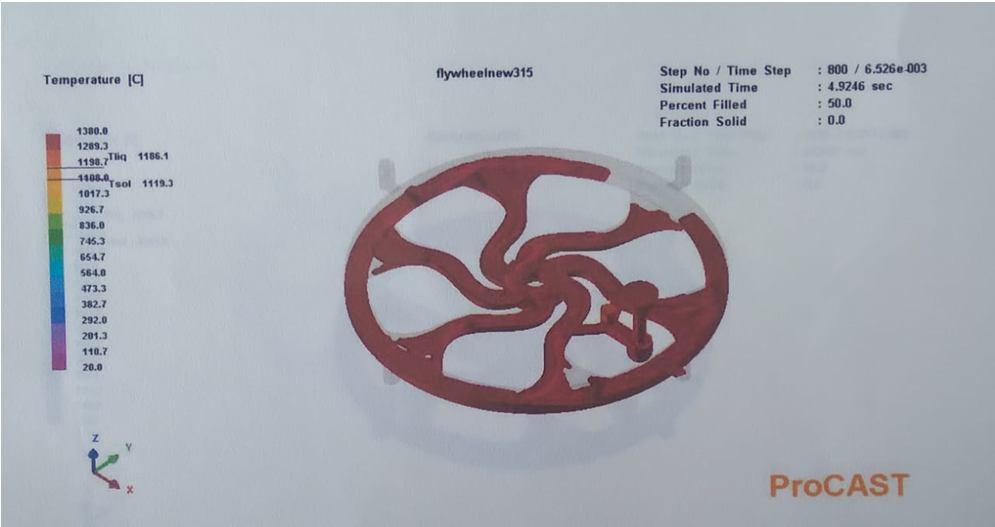
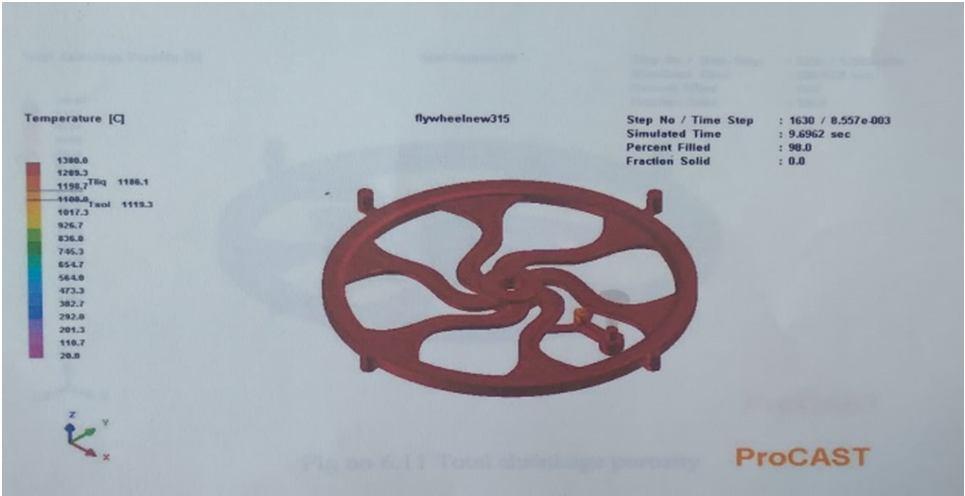
The solidification of the casting is examined using the proCAST software once the solid works model of the casting with the existing gating system has been loaded. Figure 6 depicts the process of solidification from liquid to 90% solid.
ISSN: 2321 9653; IC Value: 45.98; SJ Impact Factor: 7.538 Volume 10 Issue X Oct 2022 Available at www.ijraset.com
The casts' arms solidified first, then their outside ring, and finally their hub. As a result, the hub will experience shrinkage faults because it is improperly fed by the ingate due to the use of a gating system. The casts' arms solidified first, then their outside ring, and finally their hub. As a result, the hub will experience shrinkage faults because it is improperly fed by the ingate due to the use of a gating system.The places where we need to find the ingate are the feeding zones. Seven feeding zones are included, six on each arm and one at the hub. According to the proCAST, the ingate in the current design is not connected to any of the feeding zones.
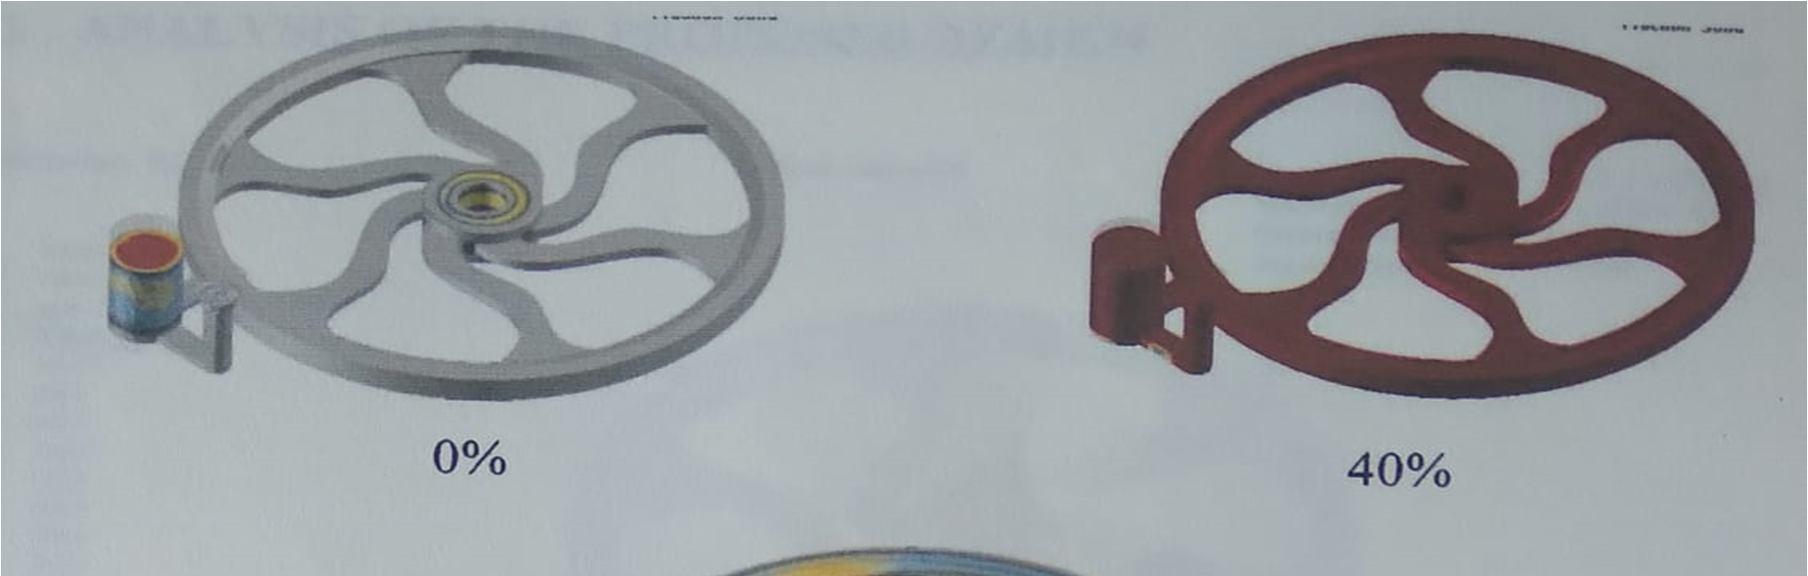

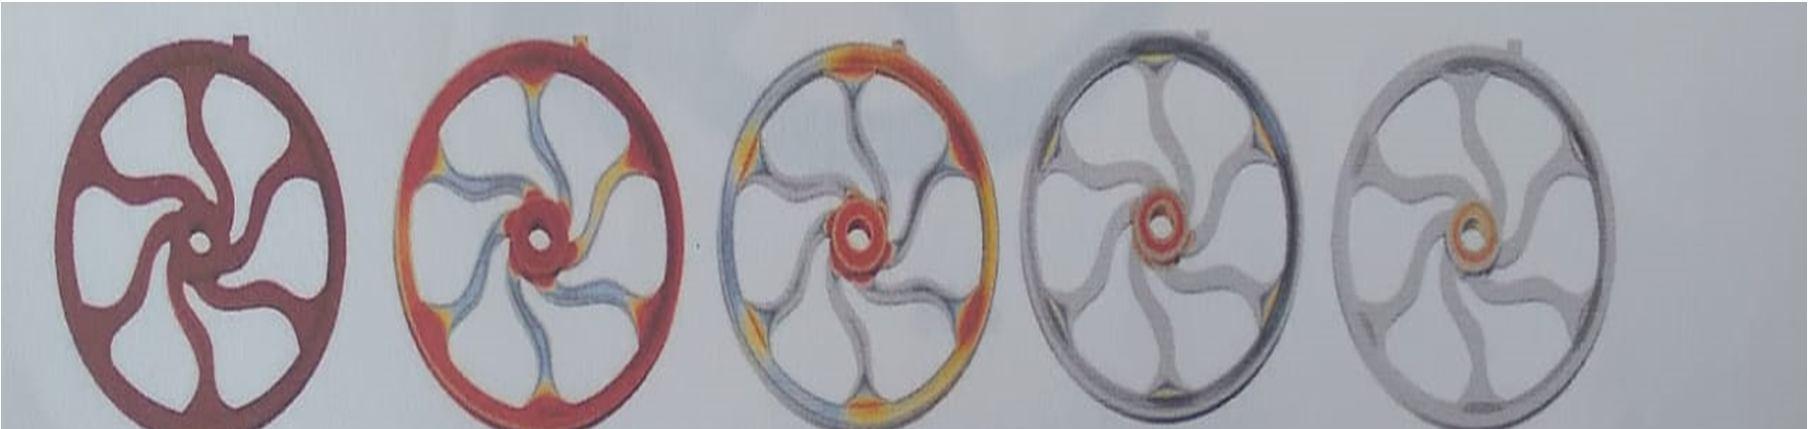
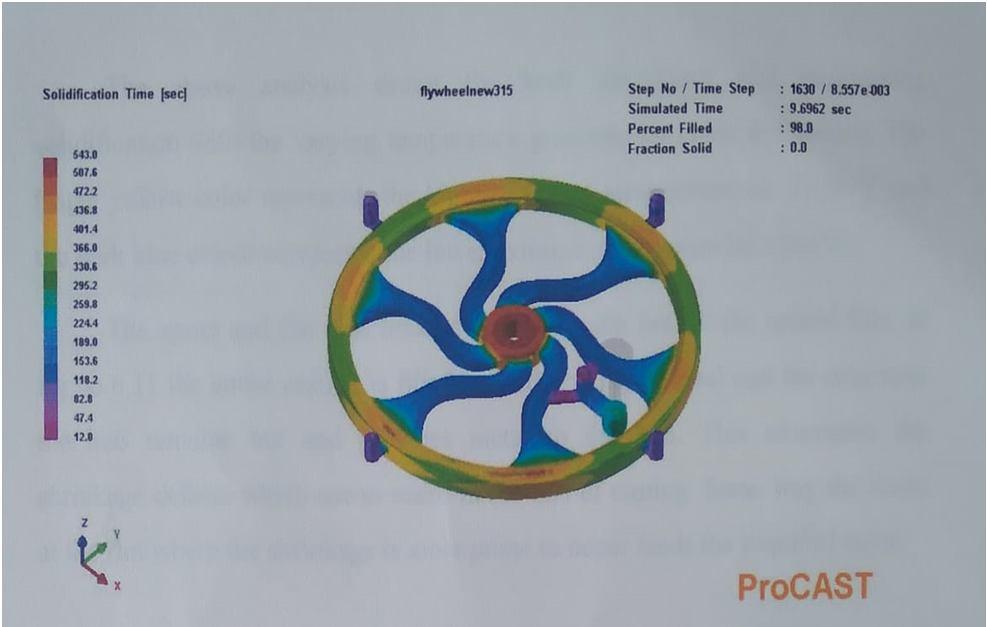
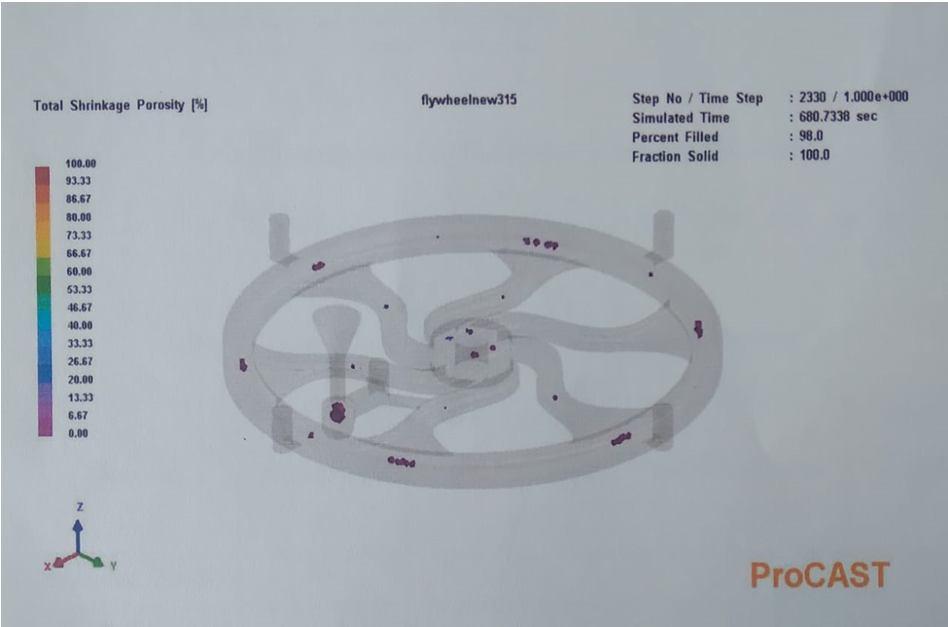
The solidification of the current gating system is depicted in figure 7 above, where the riser solidifies last yet is located in a remote place that cannot provide the molten to the hub. Figure 8 also displays the current system's hot spot at a range of 1 to 10. Hot spots are places where the temperature is higher than in neighboring areas and which could lead to shrinkage defects. The analysis presented above illustrates temperature gradients by color differences with both directed and gradual solidification. Dark blue denotes the lower extreme temperature of 11640 degrees Celsius and bright yellow symbolizes the upper extreme temperature of 13160 degrees Celsius. Until the mold fills, the nearby riser and sprue stay heated. Figure 15 shows that the liquid meal has filled the whole casting, and the riser next to the hub is still hot and still supplying metal to the hub. This gets rid of the shrinkage flaws that used to show up in the casting hub. Similar to this, feed the necessary metal into the riser at the rim, where shrinking is most likely to happen. The following outcomes were attained as a result of the foundry alteration mentioned above. The graph displays the decline of shrinkage defects following each correction.
Table 8: Reduction Rate Before and After Remedial Action
ISSN: 2321 9653; IC Value: 45.98; SJ Impact Factor: 7.538 Volume 10 Issue X Oct 2022 Available at www.ijraset.com
20
15
10
5
18 8 4 2 2 2 1 0 0 0
4 0
Existing Design After Redesign of Gating System After Changing the Composition
Shrinkage Blow holes and slag inclusion Sand inclusion Mold Shift
Fig 16: Reduction rate before and after remedial action
Redesigning the gating mechanism and altering the chemical makeup of grey cast iron help to eliminate the shrinkage fault in the casting. After the gating system was redesigned, the shrinkage defect was 18%. That increased the casting fault from 60% to 68.66%. The casting's effective yield, which was previously 46.12%, jumped to 57.67%. The casting yield and effective yield have increased to 68.66% and 63.16%, respectively, due to the change in chemical composition.
[1] Tofigh, A.A., Rahimipour, M.R., Shabani, M.O., Alizadeh, M., Heydari, F., Mazahery, A. and Razavi, M., 2013. Optimized processing power and trainability of neural network in numerical modeling of Al Matrix nano composites. Journal of Manufacturing Processes, 15(4), pp.518 523. https://doi.org/10.1016/j.jmapro.2013.08.004
[2] Zhang, X., Chen, P., Yu, Q., Ma, K., Ding, Z. and Zhu, X., 2013. Effects of plasma induced epoxy coatings on surface properties of Twaron fibers and improved adhesion with PPESK resins. Vacuum, 97, pp.1 8. https://doi.org/10.1016/j.vacuum.2013.04.001
[3] Kaczmarek, Ł., Kopia, A., Kyzioł, K., Szymański, W., Kołodziejczyk, Ł., Gawroński, J. and Kleczewska, J., 2013. Wear resistant carbon coatings deposited at room temperature by pulsed laser deposition method on 7075 aluminum alloy. Vacuum, 97, pp.20 25. https://doi.org/10.1016/j.vacuum.2013.03.015
[4] Zhang, X., Chen, P., Yu, Q., Ma, K., Ding, Z. and Zhu, X., 2013. Effects of plasma induced epoxy coatings on surface properties of Twaron fibers and improved adhesion with PPESK resins. Vacuum, 97, pp.1 8. https://doi.org/10.1016/j.vacuum.2013.03.005
[5] Ge, W., Lu, B., Li, W., Lu, J. and Ye, Z., 2013. Synthesis of graphene together with undesired CuxO nanodots on copper foils by low pressure chemical vapor deposition. Vacuum, 97, pp.9 14. https://doi.org/10.1016/j.vacuum.2013.04.001
[6] Zhu, M., Yi, K., Du, Y., Qi, H., Zhang, W. and Shao, J., 2013. Reduction in thickness error of optical coatings by dividing thick layers and monitoring with multiple witness glasses. Vacuum, 97, pp.44 48. https://doi.org/10.1016/j.vacuum.2013.04.002
[7] Nallusamy, S., Narayanan, M.R. and Hariharan, S., SYNTHESIS AND CHARACTERIZATION OF TiN, TiAlN AND TiAlN/Si3N4 CHEMICAL NANOCOMPOSITE. http://dx.doi.org/10.7324/RJC.2017.1041909
[8] Karthikeyan, R., Kumar, R.A., Manikandan, P. and Senthilnathan, A.K., 2021. Investigation of solar air heater with phase change materials using packed bed absorber plate. Materials Today: Proceedings, 45, pp.1360 1365. https://doi.org/10.1016/j.matpr.2020.06.236
[9] Karthik, R., Mani, R. and Manikandan, P., 2021. Tribological studies of Ni SiC and Ni Al2O3 composite coatings by Pulsed Electrodeposition. Materials Today: Proceedings, 37, pp.701 706. https://doi.org/10.1016/j.matpr.2020.05.717
[10] R Mani, P Manikandan, N Harish, G Bala Subramanian ."Tribological Studies of Pin Fin type Forced Convection Solar Air Dryer with Help of PCM as a Thermal Storage Medium", Volume 10, Issue X, International Journal for Research in Applied Science and Engineering Technology (IJRASET) Page No: 500 504, ISSN : 2321 9653, https://doi.org/10.22214/ijraset.2022.47036
[11] Li Chen, Liping Wang, Zhixiang & Tao Xu 2006, Influence of pulse frequency on the microstructure and wear resistance of electrodeposited Ni Al2O3 composite coating, Mater. Sci. Eng., 201, 599 605. https://doi.org/10.1016/j.surfcoat.2005.12.008
[12] M.E. Bahrololoom, R. Rani, The influence of pulse plating parameters on the hardness and wear resistance of nickel alumina composite coatings, Surf. Coat. Technol. 192 (2005) 154 163. https://doi.org/10.4028/www.scientific.net/DDF.406.292
[13] G. Amirthan, M. Balasubramanian, Reciprocating sliding wear studies on Si/SiC ceramic composites, Wear 271 (2011) 1039 1049. https://doi.org/10.1016/j.wear.2011.04.006