10 IX September 2022 https://doi.org/10.22214/ijraset.2022.46766
Dhananjay Sharma1 , Dr. Virendra Pathak2 , Amarendra Singh3
1M. Tech Scholar, 2Professor, 3Assistant Professor, Department of Civil Engineering, Institute of Engineering and Technology, Lucknow 226021 UP, India

Abstract: Every year, the Indo-Gangetic Plains (IGP) burn biomass, which results in serious atmospheric pollution, including reactive nitrogen. This study focuses on the burning of biomass area and nitrogen species emissions in the months of October, November, and March, April, and May from 2016 to 2020. Using a satellite product from the Moderate Resolution Imaging Spectroradiometer (MODIS) sensor on the National Aeronautics and Space Administration (NASA) Aqua and Terra satellites, reactive nitrogen species emissions (ammonia (NH3), nitrous oxide (N2O), and oxides of nitrogen (NOx = NO + NO2)) were estimated for the study period. In this study, region of IGP is divided in three parts i.e. West IGP region, Middle IGP region and East IGP region. we estimate that post monsoon west IGP region has highest average burned area is 19731.081839 sq km and the maximum emission of nitrogen species NH3 is 3558462491 g in year 2016. Our findings on biomass burning and nitrogen species emissions offer important insight for addressing the most contaminated area of the IGP region.

Keywords: Biomass burning, Nitrogen species, Emission, Air Pollution, Indo Gangetic plain
When substances in the atmosphere threaten the health of people and other living things, as well as the environment and matter, it is said to be polluting the air. Air pollution can take the form of gases (such ammonia, carbon monoxide, sulphur dioxide, nitrous oxides, methane, carbon dioxide, and chlorofluorocarbons), particles (both organic and inorganic), and live organisms. In adding to harming humans, animals, food crops, and other living things, air pollution may also have negative effects on the built environment, the natural environment (such as climate change, ozone depletion, and habitation loss), and other living things (for example, acid rain). Human actions and natural events both have the potential to generate air pollution. One of the primary causes of death, outdoor air pollution alone is responsible for 2.1 to 4.21 million fatalities annually. The greatest environmental health issue in the world is air pollution, which eliminate around 7 million people annually and causes a worldwide mean loss of life expectancy (LLE) of 2.9 years (Kum et al., 2020).
India has 21 of the top 30 most polluted cities in the world in 2019. According to a research based on 2016 data, 13 of the world's 20 cities with the worst annual air pollution levels are located in India, and at least 140 million people there breathe air that is 10 times or more contaminated than the WHO tolerable limit. Automobiles account for 27% of pollution, agricultural burning for 17%, and other sources make up 5%. Industrial pollution makes for 51% of all pollution (Singh et al., 2020). Air pollution causes 2 million premature deaths in India each year. Pollutants are released by industry and vehicles, but biomass burning for heating and cooking is a significant source of pollution in rural areas. As a less expensive alternative to mechanical tilling, large scale crop residue burning in agricultural fields is a significant source of smoke, haze, and particle pollution in the fall and spring. India is the world's third largest producer of greenhouse gases after China and the United States despite having low per capita emissions (Badarinath et al., 2009).
Biomass burning like, managed burns, and agricultural burns etc and it is known as release huge amounts of pollutants into the sky, due to this poor air quality on a local and zonal scale (Casey et al., 2019). Biomass burning are the primary source of air pollution and it emits lot of gases species and particulate matter. It can be form natural and manmade. Man made burning includes vegetation burning for land clearance and land use change, as well as fuelwood burning, whereas natural burning includes lightning caused fires. Man made burning is thought to be responsible for approximately 90% of all fires on the earth, with natural burning playing a minor role. Natural forest burning, which are usually caused by lightning, are not a huge global threat. These burning are particularly dangerous in mid to high latitude woods, where lightning is a more important role than human caused fire. This is due to the fact that lightning caused fires typically originate in remote areas that are difficult to reach by fire crews and might linger undetected for days.
(IJRASET
ISSN: 2321 9653; IC Value: 45.98; SJ Impact Factor: 7.538 Volume 10 Issue IX Sep 2022 Available at www.ijraset.com
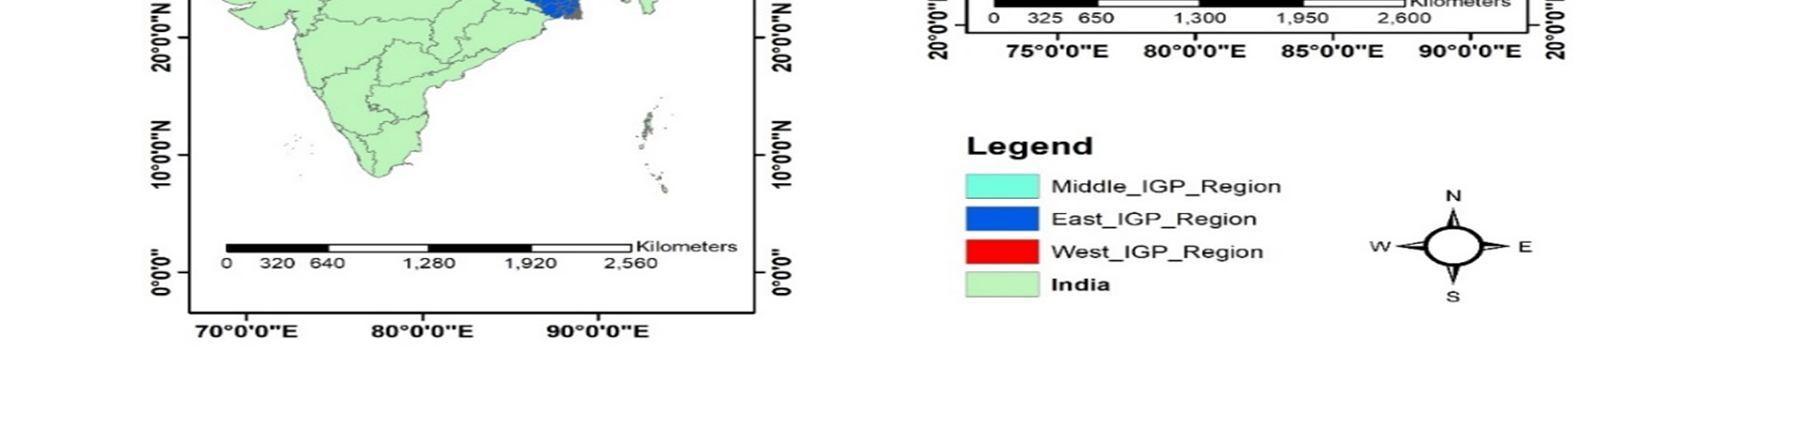
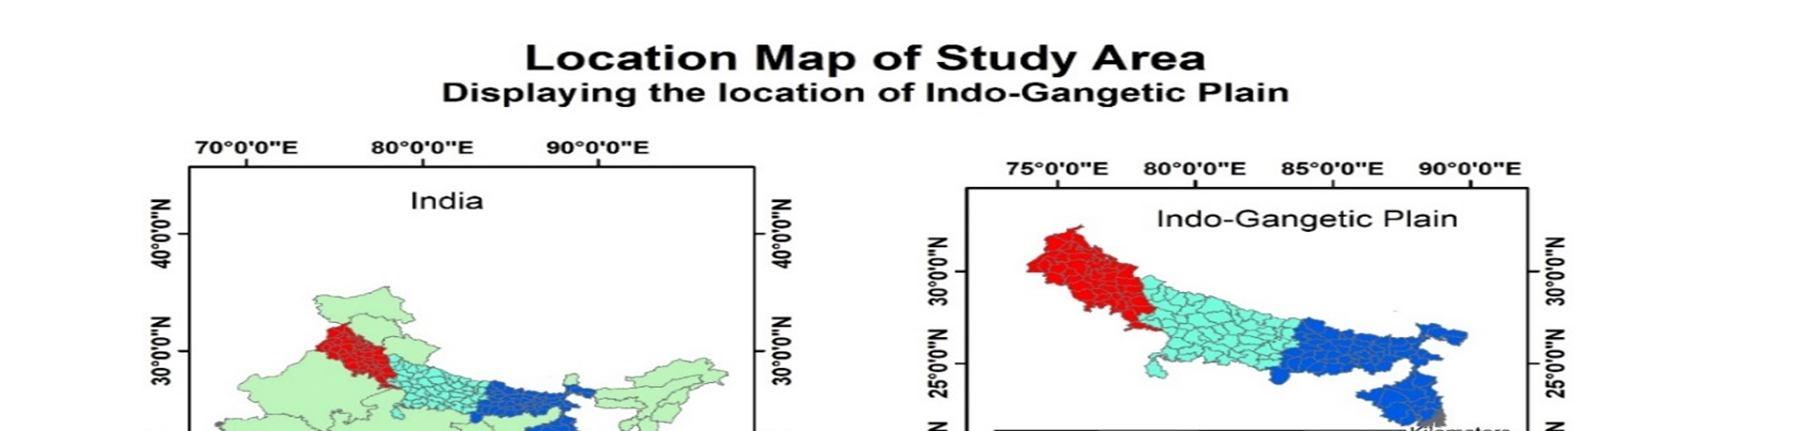

As a result, lightning caused forest fires typically cover considerably bigger regions than burning started by humans. Biomass burning is a worldwide (e.g., in Asia, Africa, South America, and North America) phenomenon with substantial consequences for climate change, the environment, human health, biodiversity, and land use. Around 90% of biomass burning is thought to be caused by humans, with the remaining 10% caused by atmospheric lightning. Burning biomass contributes significantly to the troposphere's emissions of gaseous and particulate pollution. 20% to 30% of the CO2 emissions and chemically reactive gases such hydrocarbons, CO, and NOX worldwide are produced by burning biomass. Burning biomass also generates around 42% of the world's black carbon (BC) and 74% of its primary organic carbon (OC). These compounds have an impact on climate change, air quality, atmospheric chemistry, and human health (Lifei Yin et al., 2019). In many years, in India biomass burning become a serious matter because due to this air pollution increases and In India more than half of the Indian population lives in locations where the government's safety standards for the quality of the air are not met. The disease burden is likewise significant, with more than 1.1 million fatalities in India attributed to air pollution in 2015(Singh, Prachi et al., 2021) In Asia, emissions from burning biomass account for 20 30% of total emissions for some species, such as carbon monoxide (CO) and volatile organic compounds (VOCs). The aerosol and gaseous species budgets in Asia are significantly impacted by the emissions from biomass burning in India. Approximately 25% of black carbon, organic matter, and CO emissions in India between 1995 and 2000 were reportedly produced by open burning sources (Sahu, L. K et al., 2015). In India biomass fire rage throughout the Indo Gangetic Plains (IGP; mostly in Punjab, Haryana, Uttar Pradesh, Bihar and West Bengal) happen every year. The Indo Gangetic Plain, also known as the North Indian River Plain, is a 700 thousand square kilometer (172 million acre) fertile plain that spans the northern Indian subcontinent, covering much of northern and eastern India, nearly all of Pakistan, and the southern lowlands of Nepal (Taneja et al., 2014). Mostly biomass burning happen in IGP region Punjab, Delhi, Haryana, Uttar Pradesh, Bihar and West Bengal and this study region of IGP is divided in three parts i.e. West IGP region, Middle IGP region and East IGP region as shown in figure 1 Biomass burning (agricultural) occurs mostly in pre monsoon (March, April and May) and post monsoon (October and November) throughout the year and spreads especially over the Indo Gangetic Plains. Burning organic material releases enormous volumes of reactive nitrogen species (NH3, NOx, N2O), carbon monoxide (CO), sulphur dioxide (SO2), lead, mercury, and other dangerous air pollutants (HAPs). These gases can also help to the formation of secondary fine particulate matter both local and zonal scale. Every year, 7 million people die prematurely due to air pollution, the majority of which is caused by PM2.5 (He, Linchen et al., 2022) Shortness of breath, coughing, sneezing, runny nose, and irritation of the eyes, nose, throat, and lungs can all result from exposure to fine particles. Exposure to fine particles can worsen medical conditions including asthma and heart disease as well as harm lung function (Vincenti, Beatrice et al., 2022). In urban areas, New Delhi, Kanpur and Patna biomass burning mostly agricultural in the IGP region are mixed with other anthropogenic emission sources (e.g. power plants, leather factories, mobile exhaust etc) and dust, which elevates concentrations of PM2.5 to dangerous levels (Hama, Sarkawt ML et al., 2022; Sharma, Mukesh et al., 2007; Tiwari, Suresh et al., 2016) The objective of this study are amount of biomass is burnt seasonally in the IGP for year 2011 2020
International
Science & Engineering Technology (IJRASET)
ISSN: 2321 9653; IC Value: 45.98; SJ Impact Factor: 7.538 Volume 10 Issue IX Sep 2022 Available at www.ijraset.com
Based on the following equation (1), reactive nitrogen species emissions from burning biomass in the IGP were computed (Seiler and Crutzen, 1980):
Ei=A×B×F×Fi (1)
where F is the percentage of biomass burned in the fire, A is the burned area (m2), B is the biomass loading (kg m 2), Ei is the species i emission (g) (in this case, OC, NH3, N2O, and NOx), and Fi is the emission factor (g kg Biomass Burned 1) of species i. The burned region was identified using the Moderate Resolution Imaging Spectroradiometer (MODIS) Burned Area product (MCD64A1, Collection 6). The biomass loading (kg m 2), percentage of biomass burned in the fire and emission factor values are adapted from Bray et al., 2019 as shown in table 1
Uncertainty (April May) Uncertainty (Oct Nov)
Fraction of Biomass Burned 0.013 0.426
Biomass Loading (kg m−2) 0.178 0.294
Emission Factor (g kg Biomass Burned−1)
NH3 0.75 1.24
Nox 1.68 0.59
N2O 0.46 0.45 OC 0.03 1.2
Table 1 Uncertainties in each of the parameters used to calculate pollutant emissions
In order to identify land areas that have been affected by a fire, the MODIS burnt area product (collection 6) often identifies a transition from a vegetation surface to char, ash, or dirt. The MCD64A1 burnt area product is created using daily MODIS (Aqua and Terra) surface reflectance images that has been educated using the MODIS active fire product. The dynamic threshold of the surface reflectance data is based on a burn sensitive spectral band index produced from the MODIS 1240 and 2130 nm bands and is guided by the MODIS active fire hotspot locations. The product's resolution is supposedly 500 m. The burned pixels (1 366), unburned pixels ((0)), and unmapped pixels were all identified using the MCD64A1 Burn Date layer. The second layer, "Burn Date Uncertainty," is an estimated burn date uncertainty expressed in days. The burned area product is offered in hierarchical data format (HDF), and it contains the following layers that were used in this study: (1) "Burn date," and (2) "Burn Date Uncertainty." There may be a connection between the fire date ambiguity and the absence of a clear signal in the MODIS surface reflectance image (e.g. from clouds, but also other phenomena). The most recent MODIS collection 6 user's guide states that there is at least a one day window of uncertainty for all burn pixels. Numerous geographic regions have been used to thoroughly validate the MODIS burnt area product and MODIS active fire product, and algorithm enhancements are continuing. For the last 10 years, we downloaded the free monthly HDF product from the University of Maryland FTP (http://modisfire.umd.edu/pages/BurnedArea.php?target14Download) (January 2008 December 2017).
The most recent collection 6 MODIS active fire product was acquired from the University of Maryland. The item comes from the sun synchronous, polar orbiting Aqua and Terra satellites, which return every day at 10:30 a.m. and 1:30 p.m. locally. The MODIS Advanced Processing System processes the collected data using the improved contextual fire detection algorithm created for the collection six active fire products (MODAPS).
The FileZilla Client and FileZilla Server are separate components of the open source, cross platform FTP application FileZilla. Here we can download MODIS burned data file. In this study we download MODIS burned file in GeoTIFF image file format so that we can easily extract data for desire area.
ISSN: 2321 9653; IC Value: 45.98; SJ Impact Factor: 7.538

10 Issue IX Sep 2022 Available at www.ijraset.com
Burned Area is calculated with the

from year 2016 to 2020. In this, study area is divided into three part which is west IGP
middle IGP
east IGP region and it is found that post monsoon west IGP region has highest average burned area is 19731.081839
km.
IGP
IGP
Figure 2Graphical
IGP
East IGP Region West IGP Region Middle IGP Region East IGP Region West IGP Region Middle IGP Region East IGP Region
2016 to
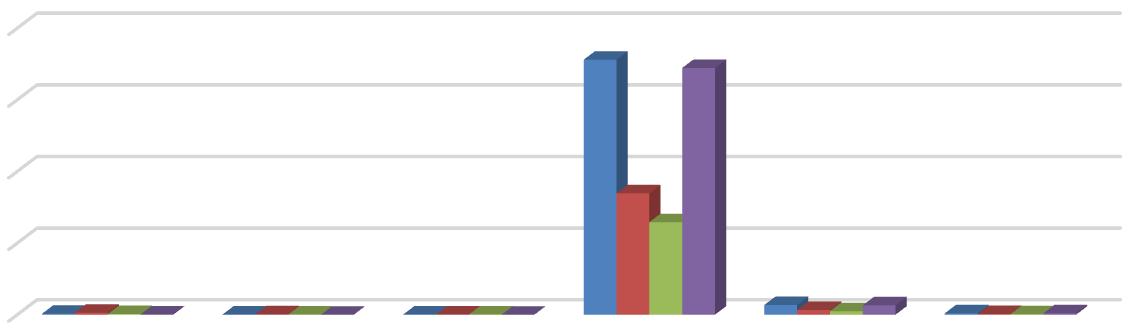
In year 2016, post monsoon (October,
is so much greater than the other IGP region and post monsoon west IGP region the
of NH3 is 3558462491g is also so much greater than the other nitrogen species (NOX, N2O, OC) as shown in figure 3. Also, we can see in graph, after NH3 value OC which is 3443673378g comparatively equal to the NH3 and post monsoon west IGP region NOX and N2O
is 1693139411g and 1291377517g respectively.

ISSN: 2321 9653; IC Value: 45.98; SJ Impact Factor: 7.538
10 Issue IX Sep 2022 Available at www.ijraset.com
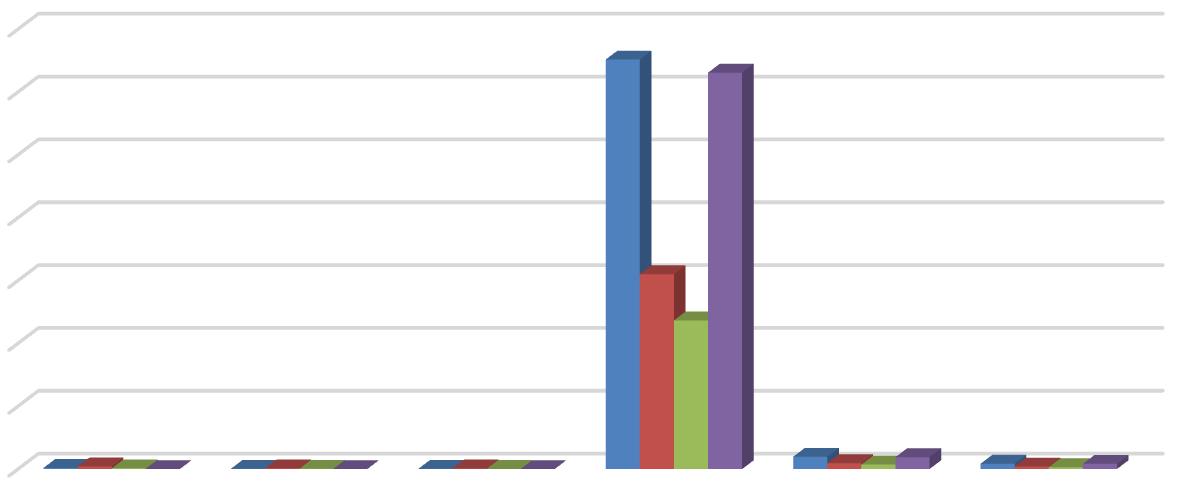
In year 2017, post monsoon (October, November) concentration of nitrogen species is so much greater than the other IGP region and post monsoon west IGP region the concentration of NH3 is 2267085511g is also so much greater than the other nitrogen species (NOX, N2O, OC) as shown in figure 4. Also, we can see in graph, after NH3 value OC which is 2193953721g comparatively equal to the NH3 and post monsoon west IGP region NOX and N2O value is 1078693913g and 822732645.2g respectively.
March-April-May
October-November
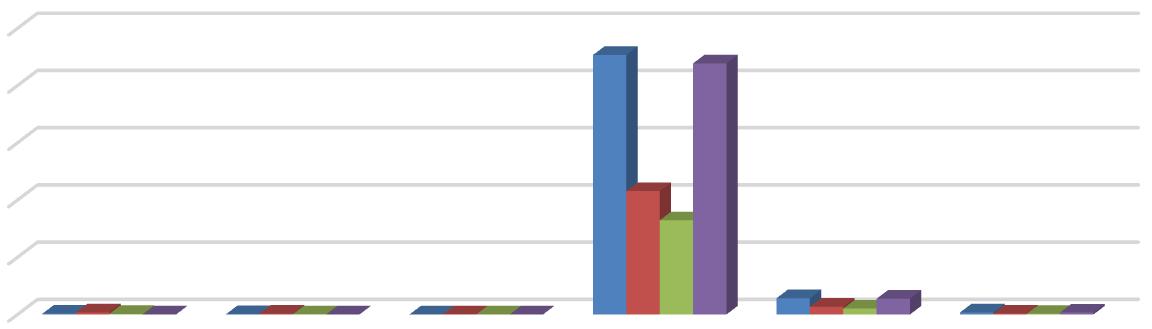
In year 2018, post monsoon (October, November) concentration of nitrogen species is so much greater than the other IGP region and post monsoon west IGP region the concentration of NH3 is 3258962509g is also so much greater than the other nitrogen species (NOX, N2O, OC) as shown in figure 5. Also, we can see in graph, after NH3 value OC which is 3153834686g comparatively equal to the NH3 and post monsoon west IGP region NOX and N2O value is 1550635388g and 1182688007g respectively.
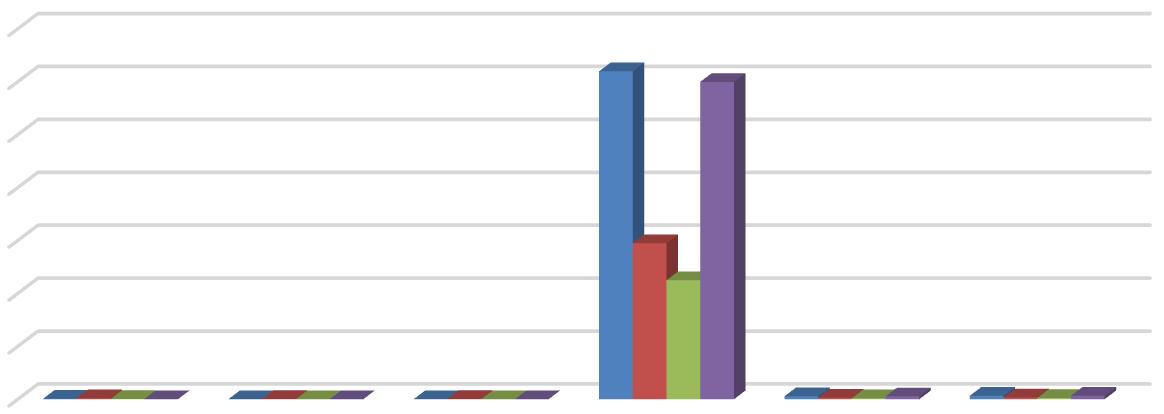
much greater than the other IGP region and post monsoon west IGP region the concentration of NH3 is 3138549115g is also so much greater than the other nitrogen species (NOX, N2O, OC) as shown in figure 6. Also, we can see in graph, after NH
In year 2019, post monsoon (October, November)
which is 3037305595g comparatively equal to the NH3 and post monsoon west IGP region
and N2O value is
value
and 1138989598g respectively.
(IJRASET
ISSN: 2321 9653; IC Value: 45.98; SJ Impact Factor: 7.538
Volume 10 Issue IX Sep 2022 Available at www.ijraset.com
West IGP
March-April-May
IGP
IGP Region East IGP Region
October-November

In year 2020, post monsoon (October, November) concentration of nitrogen species is so much greater than the other IGP region and post monsoon west IGP region the concentration of NH3 is 3098377980g is also so much greater than the other nitrogen species (NOX, N2O, OC) as shown in figure 7. Also, we can see in graph, after NH3 value OC which is 2998430303g comparatively equal to the NH3 and post monsoon west IGP region NOX and N2O value is 1474228232g and 1124411364g respectively.
West
March-April-May
NH3
October-November
[1] Kum, Ekia Gilbert. "What Can the World Health Organization (WHO), and the 1979 Geneva Convention (CLRTAP) Do, under the Rules of Public International Law (PIL), to Curb Air Pollution Which Has Amplified the Death Toll Rate of the Coronavirus 19 in the World?." Available at SSRN 3635016 (2020).
[2] Singh, Dharmendra, and Chintan Nanda. "Aerosol optical depth (AOD) variation over haryana due to lockdown amid Covid 19 as an indicator of air quality." 2020 IEEE India geoscience and remote sensing symposium (InGARSS). IEEE, 2020.
[3] Badarinath, K. V. S., Shailesh Kumar Kharol, and Anu Rani Sharma. "Long range transport of aerosols from agriculture crop residue burning in Indo Gangetic Plains a study using LIDAR, ground measurements and satellite data." Journal of Atmospheric and Solar Terrestrial Physics 71.1 (2009): 112 120.
[4] Bray, Casey D., William H. Battye, and Viney P. Aneja. "The role of biomass burning agricultural emissions in the Indo Gangetic Plains on the air quality in New Delhi, India." Atmospheric Environment 218 (2019): 116983.
[5] Yin, Lifei, et al. "Estimation of emissions from biomass burning in China (2003 2017) based on MODIS fire radiative energy data." Biogeosciences 16.7 (2019): 1629 1640.
[6] Singh, Prachi, and Sagnik Dey. "Crop burning and forest fires: Long term effect on adolescent height in India." Resource and Energy Economics 65 (2021): 101244.
[7] Sahu, L. K., et al. "Regional biomass burning trends in India: Analysis of satellite fire data." Journal of Earth System Science 124.7 (2015): 1377 1387.
ISSN: 2321 9653; IC Value: 45.98; SJ Impact Factor: 7.538
Volume 10 Issue IX Sep 2022 Available at www.ijraset.com
[8] Taneja, Garima; Pal, Barun Deb; Joshi, Pramod Kumar; Aggarwal, Pramod K.; Tyagi, N. K. (2014). Farmers preferences for climate smart agriculture: An assessment in the Indo Gangetic Plain. Intl Food Policy Res Inst. p. 2
[9] He, Linchen, and Junfeng Zhang. "Particulate matter (PM) oxidative potential: Measurement methods and links to PM physicochemical characteristics and health effects." Critical Reviews in Environmental Science and Technology (2022): 1 21.
[10] Vincenti, Beatrice, et al. "Saccharides as Particulate Matter Tracers of Biomass Burning: A Review." International journal of environmental research and public health 19.7 (2022): 4387.
[11] Hama, Sarkawt ML, et al. "Four year assessment of ambient particulate matter and trace gases in the Delhi NCR region of India." Sustainable Cities and Society 54 (2020): 102003.
[12] Sharma, Mukesh, et al. "Role of atmospheric ammonia in the formation of inorganic secondary particulate matter: a study at Kanpur, India." Journal of Atmospheric Chemistry 58.1 (2007): 1 17.
[13] Tiwari, Suresh, et al. "Observations of ambient trace gas and PM10 concentrations at Patna, Central Ganga Basin during 2013 2014: the influence of meteorological variables on atmospheric pollutants." Atmospheric research 180 (2016): 138 149.
[14] Seiler, Wolfgang, and Paul J. Crutzen. "Estimates of gross and net fluxes of carbon between the biosphere and the atmosphere from biomass burning." Climatic change 2.3 (1980): 207 247.
[15] Giglio, Louis, et al. "Collection 6 modis burned area product user’s guide version 1.0." NASA EOSDIS Land Processes DAAC: Sioux Falls, SD, USA (2016).
[16] Giglio, Louis, et al. "The Collection 6 MODIS burned area mapping algorithm and product." Remote sensing of environment 217 (2018): 72 85.
[17] Vadrevu, Krishna Prasad, Aditya Eaturu, and Sumalika Biswas. "Burnt Area Mapping in Nainital, Uttarakhand, India, Using Very High Resolution PlanetScope Imagery." Biomass Burning in South and Southeast Asia. CRC Press, 2021. 91 103.