https://doi.org/10.22214/ijraset.2023.49493

ISSN: 2321-9653; IC Value: 45.98; SJ Impact Factor: 7.538

Volume 11 Issue III Mar 2023- Available at www.ijraset.com

https://doi.org/10.22214/ijraset.2023.49493

ISSN: 2321-9653; IC Value: 45.98; SJ Impact Factor: 7.538

Volume 11 Issue III Mar 2023- Available at www.ijraset.com

Abstract: Detecting intruders in computer networks is very important because it affects multiple communication and security domains finding network intruders can be difficult furthermore network intrusion detection remains a challenging undertaking due to the large amount of data required to train modern machine learning models to detect network intrusion risks recently many methods have been published for detecting network intruders however they face significant challenges as new threats continue to emerge that are undetectable by older systems this study evaluates different approaches to creating network intrusion detection systems the best features of the dataset are selected based on the correlations between features in addition we provide a complete functional and performance overview of an adaboost-based network attack detection solution based on these selected characteristics.
Keywords: AdaBoost, network intrusion, decision tree, SVM, MLP
Over the past few years, as information technology has developed and spread, there have been considerable trade-offs among its benefits. Under the ongoing danger of black-hats, network security has received more attention. Network attacks have significantly increased during the past ten years. These attacks have been quite severe and intricate. Each day, tens of thousands of hackers probe and assault computer networks.[1] Personal privacy is violated, data is taken and sold on the black market. As a result, it is necessary to create an effective and efficient system for identifying the different types of threats.[4]
One security tool used to distinguish between permitted and unauthorized user activity on a system or network is intrusion detection [3]. It is employed to safeguard computer systems and network infrastructure from nefarious actions and illegal uses. It recognises various hazards. It enables users and network administrators to take preventative action. In order to identify suspicious behavior, intrusion detection systems record and examine network traffic.
IDS mainly works on two different approaches:
1) Anomaly Detection: This approach compares abnormal activity to observed network traffic or host OS behavior after analyzing it using a number of different characteristics. Any departure from usual behavior triggers an alarm if the system recognises it.
2) Detecting Misuse or Signatures: A certain pattern of conduct that is previously recognised as an assault is what this approach searches for. The IDS signature database contains a record of every harmful pattern and action that has been classified as an attack. For the purpose of detecting attacks, these signature databases are regularly updated. Since there won't be a signature for a unique attack, this technique's shortcoming is that it won't be able to identify it. In general, there are two types of intrusion detection systems:
3) Network Intrusion Detection System (NIDS): The packets from network traffic are captured. To find malicious actions, the header of the collected packets is examined based on a number of factors. It may be installed on servers, switches, gateways, and the backbone of the network.
4) Host Intrusion Detection System (HIDS): To identify a breach or abuse, it is placed on each system separately. Key system files, process activities, unexpected resource usage, unwanted access, etc. are all examined by HIDS.

ISSN: 2321-9653; IC Value: 45.98; SJ Impact Factor: 7.538

Volume 11 Issue III Mar 2023- Available at www.ijraset.com
The type of IDS can be chosen based on the demands of the company. The cost of NIDS will be lower for large enterprises. But it's crucial to realize that NIDS and HIDS both employ unique approaches, so one cannot be used in place of the other.[5]
The main reason for doing this literature review is the dearth of specialized information on ML-based IDS (Intrusion Detection System) methods in WSNs in earlier studies.
The past literature surveys reveal the following information:
Machine learning techniques for WSNs.
Wireless network intrusion detection.
WSNs' Anomaly-based Intrusion Detection.
Intrusion detection powered by machine learning.
Security concerns with WSNs.
Cybersecurity approaches based on machine learning and deep learning.[2].
Artificial intelligence's machine learning field of study focuses on designing and creating algorithms that enable computers to evolve behaviors based on empirical data, such as that gathered from databases or sensor data. The automated recognition of complicated patterns and the ability to derive wise conclusions from data are two fundamental goals of machine learning research. Search engines, medical diagnosis, language and handwriting recognition, picture screening, load forecasting, marketing and sales diagnosis, and other uses for ML are many. In the domain of intrusion detection, ML was originally applied in 1994 to classify Internet flow. The majority of the work on classifying Internet traffic using ML approaches begins here.
A large number of wireless sensors are placed in an ad hoc way to create a wireless sensor network (WSN), which lacks any physical infrastructure and is used to track system, physical, and environmental factors.
The Wireless Sensor Network (WSN), which is used to track system, physical, and environmental factors, is a wireless network without any underlying infrastructure. It is implemented ad hoc using a large number of wireless sensors.[2] In a wireless sensor network (WSN), sensor nodes with an integrated CPU are used to control and keep an eye on a specific area's surroundings. They are associated with the Base Station, a component of the WSN System that serves as a processing unit. For the purpose of sharing data, base stations in a WSN system are linked over the Internet
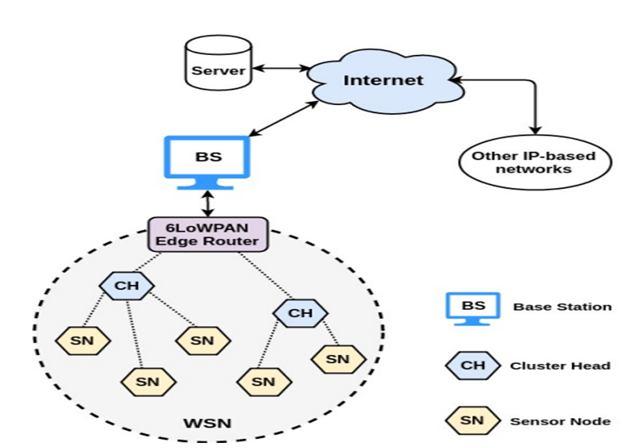

Understanding security concerns with WSNs requires an understanding of the architecture of such LR-WPAN (IEEE 802.15.4) radio communications. The five tiers that make up the WSN architectural structure [2] provide the following services:
1) The physical layer offers a variety of services, including carrier generation, signal modulation, deflection, and data encryption.
2) Data link layer: This layer deals with media access control, data multiplexing, framing, and point-to-point communication.
3) Network layer: Controls address distribution and packet forwarding.
4) Transport layer: Ensures packets are transmitted securely.
5) The application layer handles data representation between sensor nodes and between sensor nodes and end users it is challenging for the low powered wsns due to the growing use of wsns for the majority of important applications and the data transfer of such applications over the internet devices that can directly handle ip datagrams to allow ipv6 packet transmission over wsn radio connections.see in fig 1
ISSN: 2321-9653; IC Value: 45.98; SJ Impact Factor: 7.538

Volume 11 Issue III Mar 2023- Available at www.ijraset.com
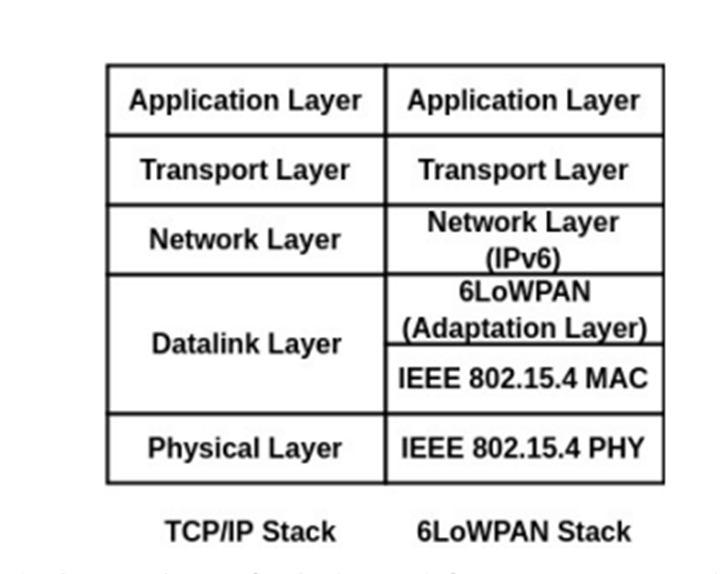
6LoWPAN design adds an adaption layer between the network and data link layers any of the currently available address spaces can be used to handle the compatibility of ipv6 packets over existing ipv4 networks translation strategies adapted by the edge router in figure 2 the normal tcpip design of conventional wsns is contrasted with the 6lowpan architecture that enables wsn to connect to the internet the 6lowpan edge routers adaption layer handles packet forwarding at the network layer, so removing the the requirement to save application layer state. This lowers the energy usage and hinders the integration of low-powered devices devices to the Internet, making security a significant issue concern. This has also led to the development of new Internet applications. Internet of Everything (IoE) and the Internet of Things (IoT), which are outside the purview of this paper.
Illustrates how multiple malicious wsn attacks impact both power and cpu usage in addition to security concerns therefore compared to other forms of networks these sorts of networks must place a greater emphasis on coming up with workable and realistic solutions we go into great detail on how each kind of assault impacts wsns.
1) Listening to the security-related limitations of wsns such as hostile environment dynamic nodes and unreliable communication make it easier for hackers to eavesdrop on information being transmitted between nodes which increases the impact of radio fading and frequency transmission or dispersion.
2) Collision: Since the sensors are spread across many settings, a malicious node replacement corruption could be to blame for this attack. Malicious nodes can interfere with neighboring broadcasts by sending a short noise packet since they do not follow the Intermediate Access Control Protocol. Despite requiring little energy from the attacker, this attack has the potential to cause significant network failures]. Furthermore, pinpointing the origin node is challenging due to the features of wireless transmission.
3) Unfairness: By exploiting contract connection period settings, this kind of attack blocks authorized users from accessing network resources and gets around the submission deadline. Examples of this kind of assault include collision attacks that are repeated or the haphazard exploitation of cooperative media access control layer priority schemes.
4) Weariness: Collision attacks of this kind are repeated until the WSN nodes' total energy is depleted. As a result of routing loops and path lengthening during packet transfers, resource depletion attacks reduce node energy.
5) Tracking Traffic: Traffic analysis in WSNs is a method for determining node communication patterns. The analysis makes advantage of information obtained by monitoring node-to-node communication. This attack specifically targets sink or access point nodes that contain sensitive data and during this attack, all transactional processes on its members are now deleted.
6) Sybil: By generating many node IDs from a single current node, the Sybil attack simulates the existence of a sensor node. In addition, it causes system failure due to problems with resource allocation and other problems. It has a significant impact on load-balancing technologies like shared computing, structure management, and server protocols

7) Faking: This attack targets routing data sent between nodes directly, and it can lead to routing loops, root path expansions and compression, network traceability to or from chosen nodes, network segmentation, fake error messages, and increased end-toend latency.
8) Session Espionage: A cookie side takeover is a different kind of man-in-the-middle attack that gives the attacker total control over the application account. A "session cookie," or a piece of data that identifies the user to the server and grants them access to their account, is sent to you by the app when you log in to an online account, such as Facebook or Twitter. As long as the user's device retains the session token, the server will permit them to use the app.
ISSN: 2321-9653; IC Value: 45.98; SJ Impact Factor: 7.538

Volume 11 Issue III Mar 2023- Available at www.ijraset.com
9) Rejecting: When an application or system doesn't have measures in place to properly monitor and log users' activity, hostile tampering or the forging of additional steps can take place. By altering the data authoring of dangerous user operations, this attack can produce inaccurate data that is logged to log files. Its application can be broadened to include general data processing in the name of others, much as email spoofing. If this attack is successful, the data in log files can be regarded as false or misleading.
Support vector machine svm is mostly used algorithm in supervised learning techniques in machine learning for classification and regression problems.
In order to swiftly categorize new points in the future the svm algorithm aims to determine the optimum line or decision boundary that can divide n-dimensional space into classes.
This best decision boundary is known as a hyperplane; the extreme vectors and points that help build the hyperplane are chosen by svm are known as support vectors after which it is named.
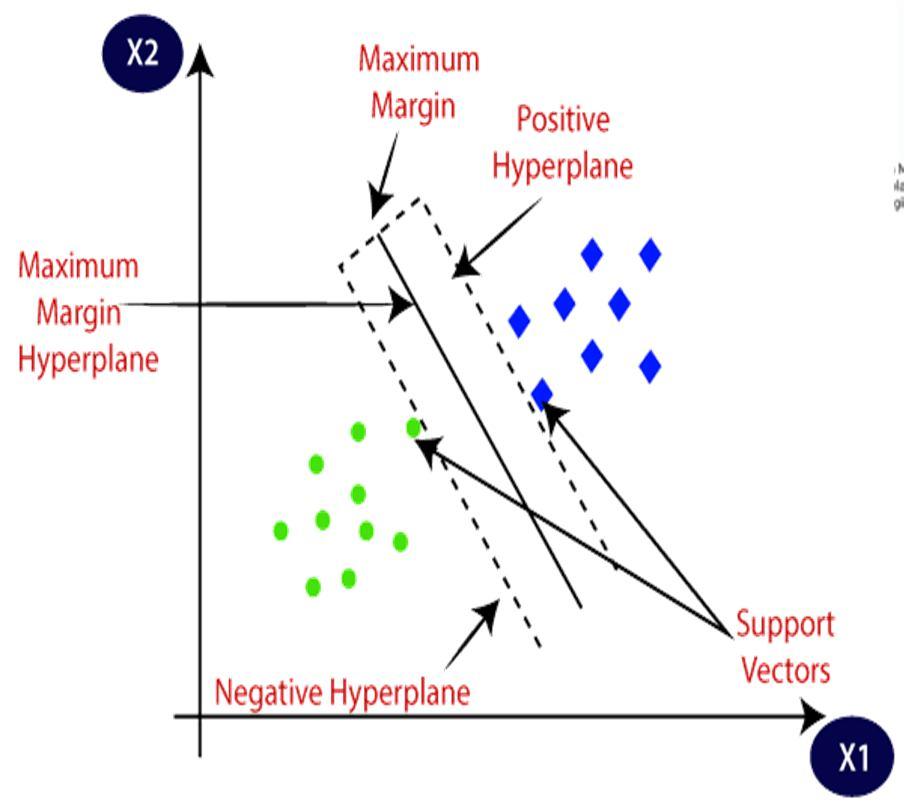

1) Support Vectors: Support vectors are the points which are closest from the hyperplane and which can impact the orientation and position of the hyperplane. Using these support vectors, we maximize the margin of the classifier. Deleting the support vectors will change the position of the hyperplane. These are the points that help us build our SVM
2) Negative Hyperplane: The plane to which most the Negative Data Points Belong.
3) Positive Hyperplane: The plane to which most of the positive data points belong.
4) Margin: it is the distance between the hyperplane and the observations closest to the hyperplane (support vectors). In SVM large margin is considered a good margin. There are two types of margins: hard margin and soft margin.
1) Linear SVM: with this particular type of svm the data points from the dataset can be separated by simply drawing the plane in between the two classes
2) Non-linear SVM: with this particular kind of svm the data points from the dataset cannot be separated by simply drawing the plane in between the two classes and if so the accuracy of the model will drop below 50%.
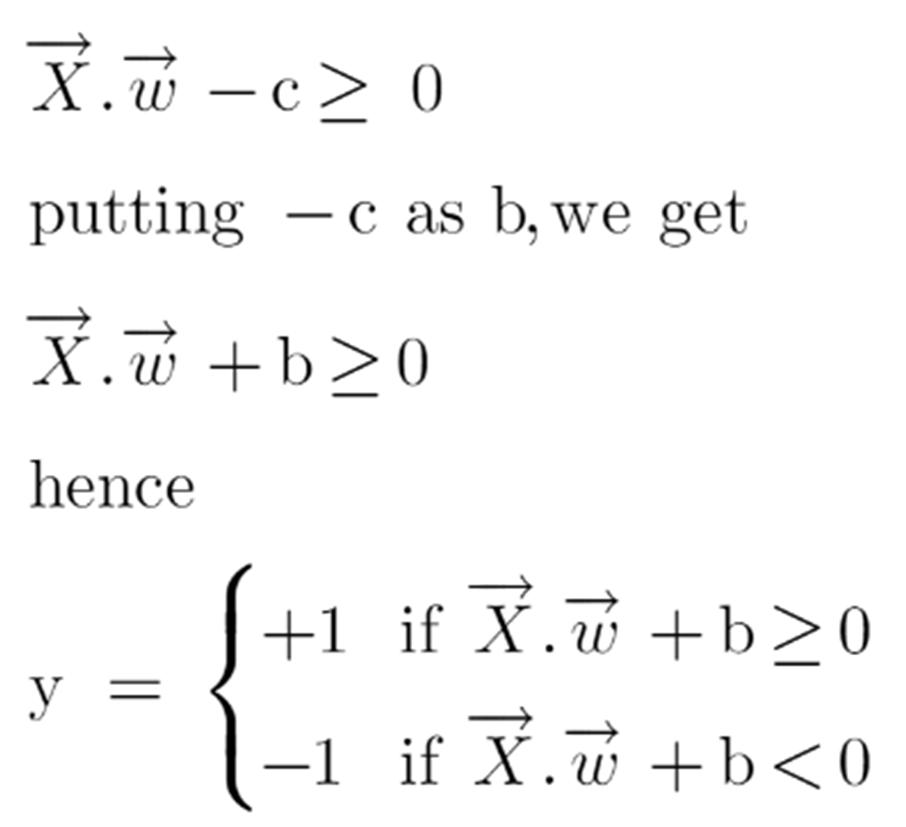
As we know, the projection of any vector or another vector is called a dot-product. Hence, we take the dot product of x and w vectors. If the dot product is greater than ‘c’ then we can say that the point lies on the right side. If the dot product is less than ‘c’ then the point is on the left side and if the dot product is equal to ‘c’ then the point lies on the decision boundary.
ISSN: 2321-9653; IC Value: 45.98; SJ Impact Factor: 7.538

Volume 11 Issue III Mar 2023- Available at www.ijraset.com
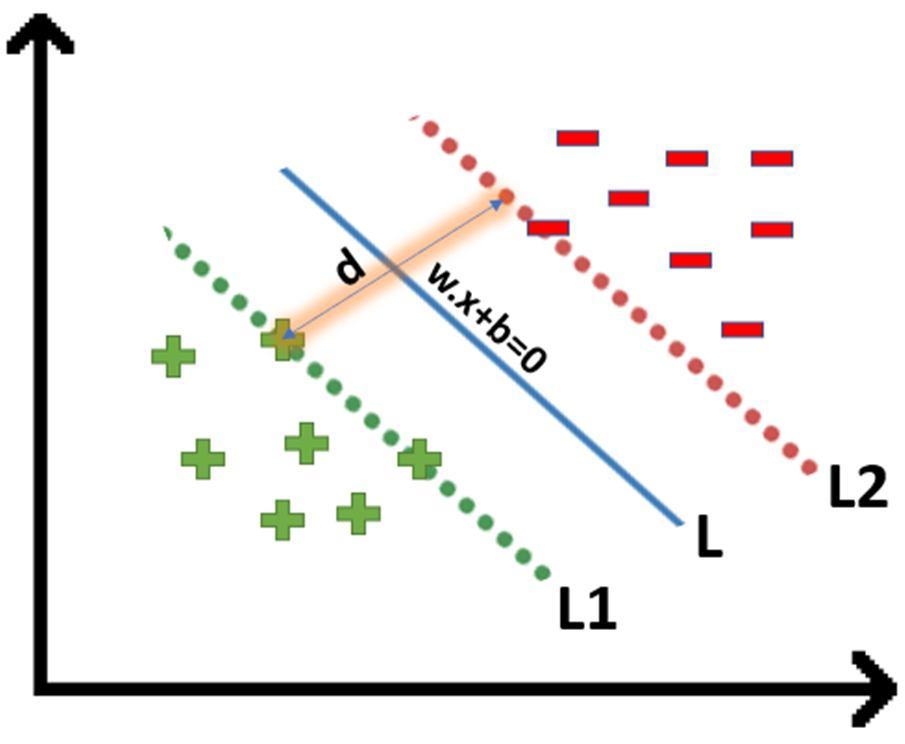
We all know the equation of a hyperplane is w.x+b=0 where w is a vector normal to hyperplane and b is an offset.
to classify a point as negative or positive we need to define a decision rule. We can define decision rule as:
In order to get our optimization function, there are few constraints to consider. That constraint is that “We’ll calculate the distance (d) in such a way that no positive or negative point can cross the margin line”.

Instead of writing these 2 cases separately,We can consider that negative classes have y=-1 and positive classes have y=1, thus. We can say that for every point to be correctly classified this condition should always be true:
Suppose a green point is correctly classified, that means it will follow w.x+b>=1, if we multiply this with y=1 we get this same equation mentioned above. Similarly, if we do this with a red point with y=-1 we will again get this equation. Hence, we can say that we need to maximize (d) such that this constraint holds true.


ISSN: 2321-9653; IC Value: 45.98; SJ Impact Factor: 7.538

Volume 11 Issue III Mar 2023- Available at www.ijraset.com
We already know how to find the projection of a vector on another vector. We do this by dot-product of both vectors. So let’s see how
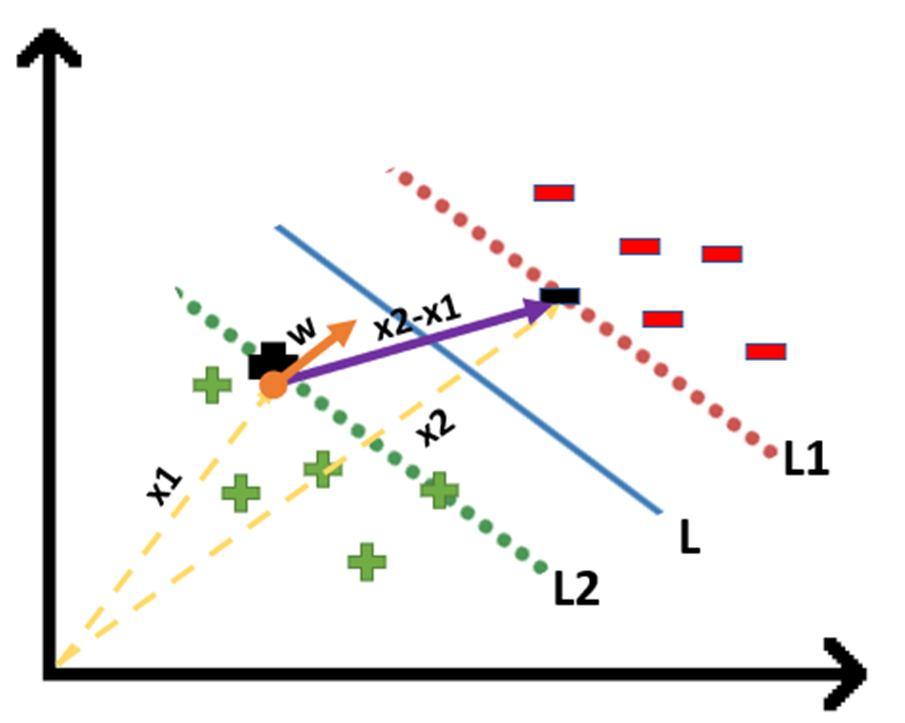
Since x2 and x1 are support vectors and they lie on the hyperplane, hence they will follow yi* (2.x+b)=1 so we can write it as:

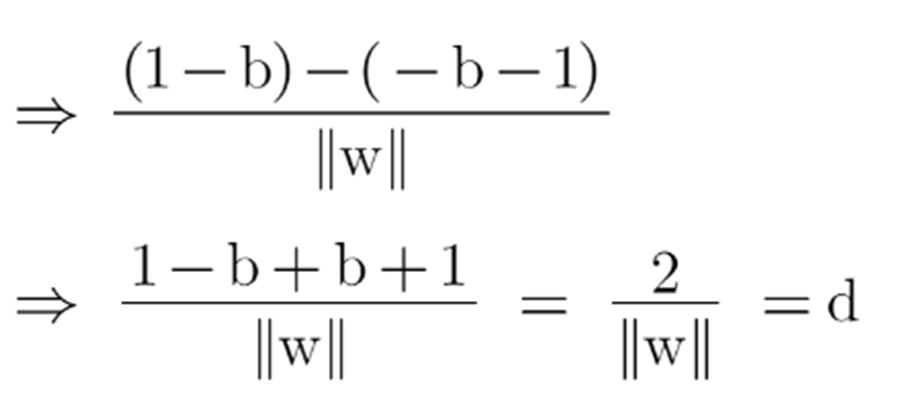

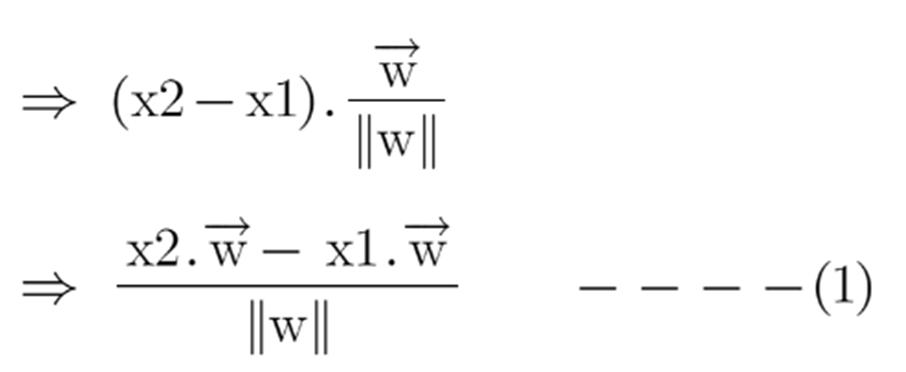
Putting equations (2) and (3) in equation (1) we get: Hence the equation which we have to maximize is:

ISSN: 2321-9653; IC Value: 45.98; SJ Impact Factor: 7.538

Volume 11 Issue III Mar 2023- Available at www.ijraset.com

In real-life scenarios we don’t find any dataset which is linearly separable, we’ll find it is either an almost linearly separable dataset or a non-linearly separable dataset. In this scenario, we can’t use the trick we proved above because it says that it will function only when the dataset is perfectly linearly separable.

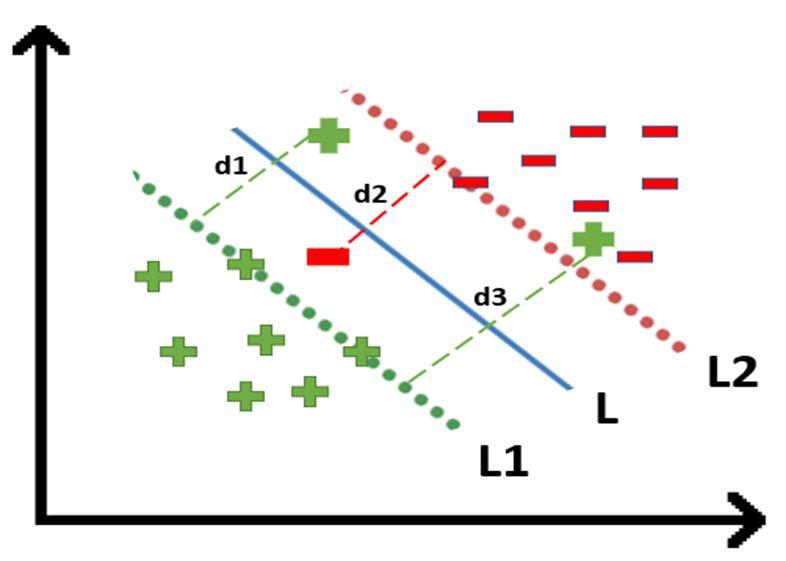
To tackle this problem what we do is modify that equation in such a way that it allows few misclassifications that means it allows few points to be wrongly classified.
To make a soft margin equation we add 2 more terms to this equation which is zeta and multiply that by a hyperparameter ‘c’

For all the correctly classified points our zeta will be equal to 0 and for all the incorrectly classified points the zeta is simply the distance of that particular point from its correct hyperplane that means if we see the wrongly classified green points the value of zeta will be the distance of these points from L1 hyperplane and for wrongly classified redpoint zeta will be the distance of that point from L2 hyperplane.
So now we can say that our are SVM Error = Margin Error + Classification Error. The higher the margin, the lower would-be margin error, and vice versa.
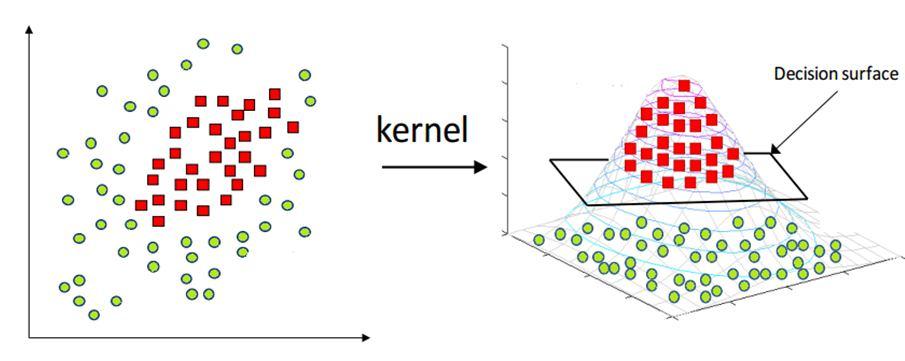

The most interesting feature of SVM is that it can even work with a non-linear dataset and for this, we use “Kernel Trick” which makes it easier to classify the points.
The kernel trick transforms the dimension of the given data points to a higher dimension. I.e It can transform 2D dataset to 3D dataset

ISSN: 2321-9653; IC Value: 45.98; SJ Impact Factor: 7.538
Volume 11 Issue III Mar 2023- Available at www.ijraset.com
Some kernel functions which you can use in SVM are given below:
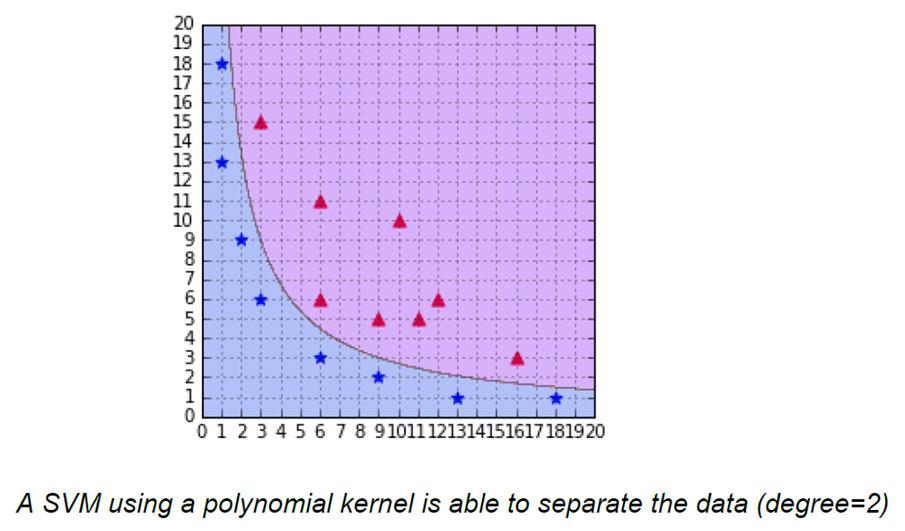

Following is the formula for the polynomial kernel:
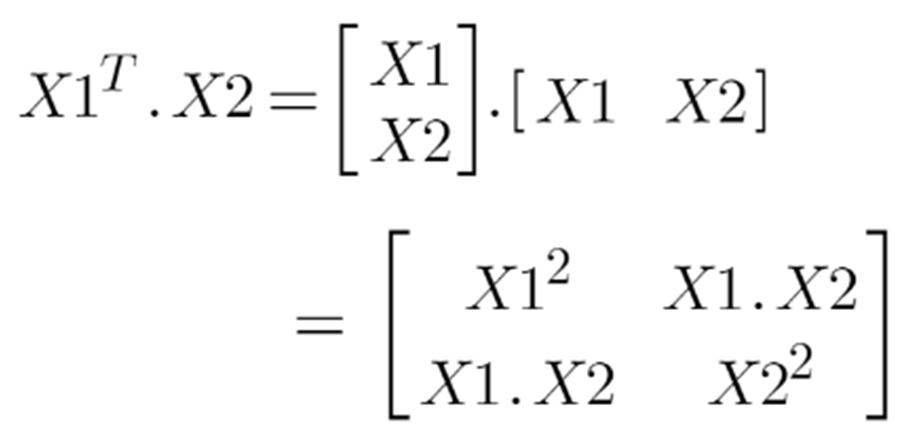
Here d is the degree of the polynomial, which we need to specify manually. Suppose we have two features X1 and X2 and output variable as Y, so using polynomial kernel we can write it as:
So we basically need to find X12 , X22 and X1.X2, and now we can see that 2 dimensions got converted into 5 dimensions.
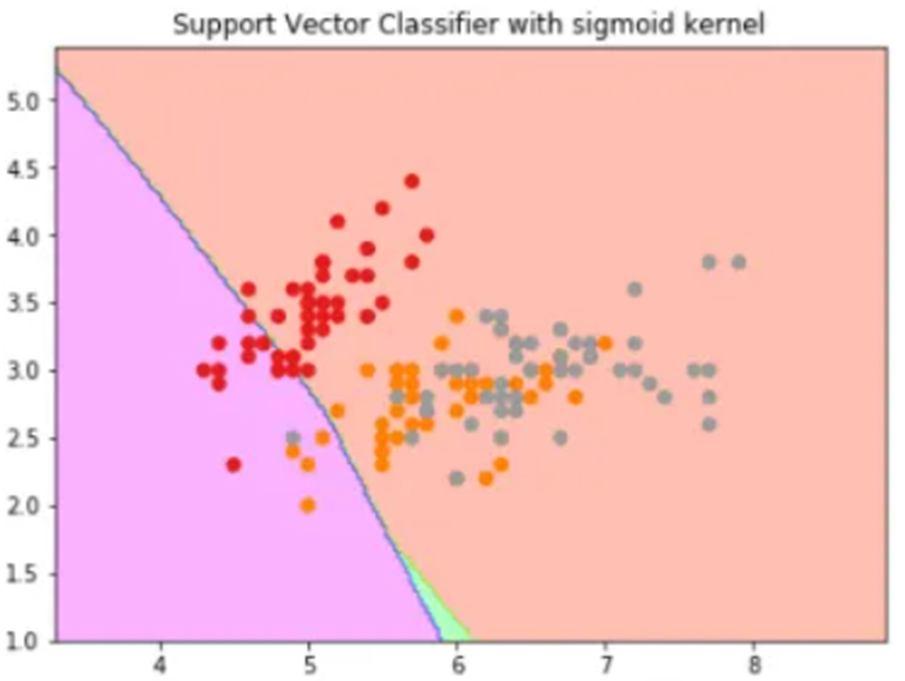
We can use it as the proxy for neural networks. Equation is:

It is just taking your input, mapping them to a value of 0 and 1 so that they can be separated by a simple straight line.


ISSN: 2321-9653; IC Value: 45.98; SJ Impact Factor: 7.538
Volume 11 Issue III Mar 2023- Available at www.ijraset.com

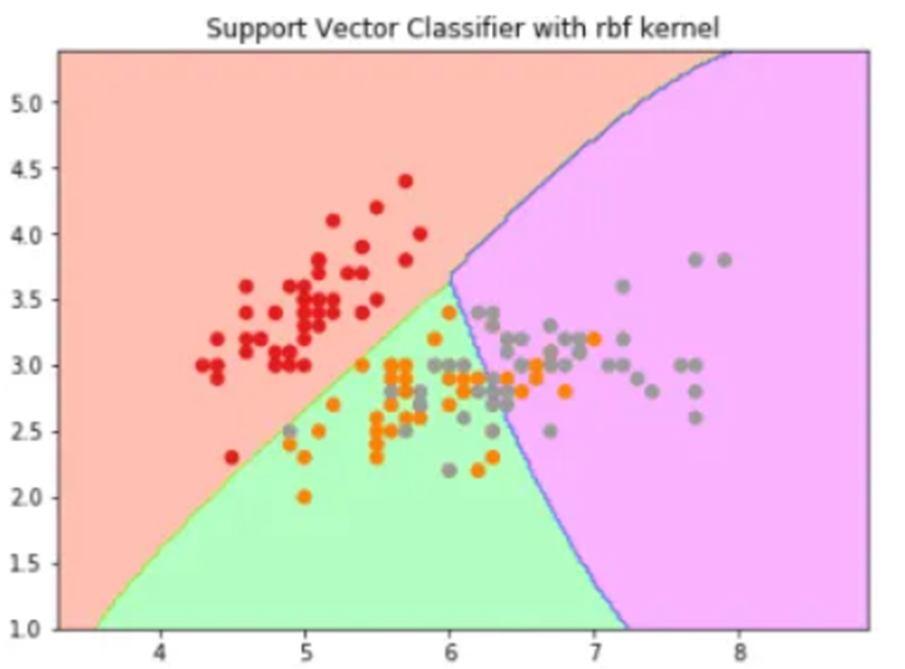
What it actually does is to create non-linear combinations of our features to lift your samples onto a higher-dimensional feature space where we can use a linear decision boundary to separate your classes It is the most used kernel in SVM classifications, the following formula explains it mathematically:
where,
1. ‘σ’ is the variance and our hyperparameter

2. ||X₁ – X₂|| is the Euclidean Distance between two points X₁ and X₂
Intrusion crimes is increasing day by day. Hence there is need to find the optimal intrusion detection system when compared to the intrusion detection systems that use the traditional clustering algorithms. In this paper, we developed an intrusion detection system that uses Support Vector Machine algorithm to detect the type of intrusion.
A brief description of security is provided, focused on IDS and related ML and DL literature for WSNs. An introduction of middleware architectures for WSNs, extended to IoT are also considered along with well-known IDS datasets. A discussion of future research directions are presented to help the researchers find proper motivation to explore the unexplored, yet related areas.
[1] Jayshree Jha and Leena Ragha(2013).Intrusion Detection System using Suppoort Vector Machine.
[2] Nitish A ,Hanumanthappa J , P. Deepa Shenoy ,K.R. Venugopal(2019).Aspects of Machine Learning based Intrusion Detection Systems in Wireless Sensor Networks:A Review.
[3] Zakiyabanu S. Malek, Bhushan Trivedi, Axita Shah(2020).User behavior Pattern -Signature based Intrusion Detection.
[4] Anand Sukumar J V, Pranav I, Neetish MM, Jayasree Narayanan (2018).Network Intrusion Detection Using Improved Genetic k-means Algorithm.
[5] Dr. Manish Kumar and Ashish Kumar Singh(2020).Distributed Intrusion Detection System using Blockchain and Cloud Computing Infrastructure.
[6] WEN-TAOLIU(2008).RESEARCH ON INTRUSION DETECTION RULES BASED ON XML IN DISTRIBUTED IDS.
[7] Zhan Xin,Wang Xiaodong and Yuan Huabing(2019).Research on Block Chain Network Intrusion Detection System.
[8] Shan Suthaharan(2012).An Iterative Ellipsoid-Based Anomaly Detection Technique for Intrusion D
